| Param | Original file | Final file |
|---|---|---|
| Filename | modeM0/AS1A04_100T01_9000002336_15777cztM0_level2.evt | modeM0/AS1A04_100T01_9000002336_15777cztM0_level2_quad_clean.evt |
| Size (bytes) | 421,306,560 | 107,513,280 |
| Size | 401.8 MB | 102.5 MB |
| Events in quadrant A | 2,986,684 | 699,130 |
| Events in quadrant B | 3,185,456 | 726,870 |
| Events in quadrant C | 3,125,954 | 712,031 |
| Events in quadrant D | 3,040,145 | 686,114 |
| Mode SS | |||
|---|---|---|---|
| Quadrant | BADHDUFLAG | Total packets | Discarded packets |
| A | 0 | 126 | 0 |
| B | 0 | 126 | 0 |
| C | 0 | 126 | 0 |
| D | 0 | 126 | 0 |
| Mode M0 | |||
|---|---|---|---|
| Quadrant | BADHDUFLAG | Total packets | Discarded packets |
| A | 0 | 12966 | 3 |
| B | 0 | 13432 | 2 |
| C | 0 | 13237 | 2 |
| D | 0 | 13265 | 2 |
| Mode M9 | |||
|---|---|---|---|
| Quadrant | BADHDUFLAG | Total packets | Discarded packets |
| A | 0 | 14 | 0 |
| B | 0 | 14 | 0 |
| C | 0 | 14 | 0 |
| D | 0 | 15 | 0 |
| Quadrant | Total seconds | Saturated seconds | Saturation percentage |
|---|---|---|---|
| A | 6191 | 28 | 0.452269% |
| B | 6191 | 30 | 0.484574% |
| C | 6191 | 65 | 1.049911% |
| D | 6191 | 26 | 0.419964% |
Noise dominated data is calculated using 1-second bins in cleaned event files. If a bin has >2000 counts, and if more than 50% of those come from <1% of pixels, then it is considered to be noise-dominated and hence unusable.
| Quadrant | # 1 sec bins | Bins with >0 counts | Bins with >2000 counts | High rate bins dominated by noise | Noise dominated (total time) | Noise dominated (detector-on time) | Marked lightcurve |
|---|---|---|---|---|---|---|---|
| A | 7527 | 6193 | 5 | 5 | 0.07% | 0.08% | 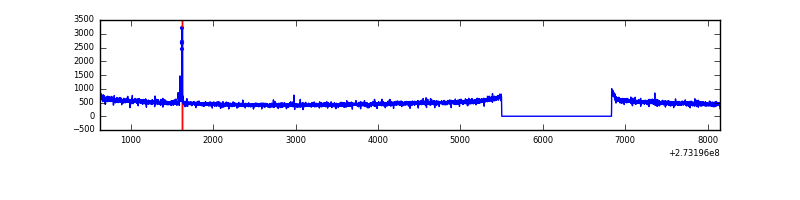 |
| B | 7527 | 6193 | 1 | 1 | 0.01% | 0.02% | 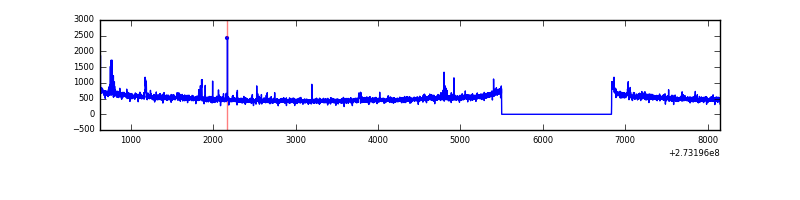 |
| C | 7527 | 6193 | 0 | 0 | 0.00% | 0.00% | 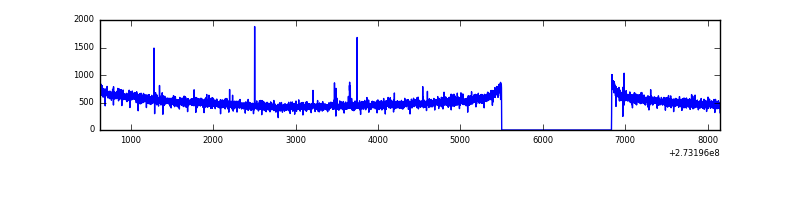 |
| D | 7527 | 6193 | 9 | 9 | 0.12% | 0.15% | 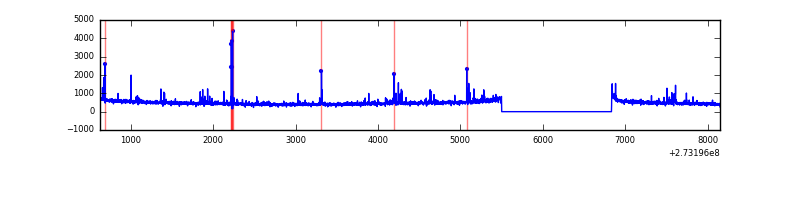 |
Top three noisy pixels from each quadrant. If the there are fewer than three noisy pixels in the level2.evt file, extra rows are filled as -1
| Pixel properties | Quadrant properties | ||||||
|---|---|---|---|---|---|---|---|
| Quadrant | DetID | PixID | Counts | Sigma | Mean | Median | Sigma |
| A | 15 | 174 | 27052 | 169.74 | 769 | 756 | 154.9 |
| A | 0 | 226 | 6852 | 39.35 | 769 | 756 | 154.9 |
| A | 12 | 194 | 5668 | 31.71 | 769 | 756 | 154.9 |
| B | 0 | 189 | 39230 | 264.93 | 782 | 765 | 145.2 |
| B | 3 | 209 | 25823 | 172.59 | 782 | 765 | 145.2 |
| B | 12 | 111 | 16390 | 107.62 | 782 | 765 | 145.2 |
| C | 14 | 238 | 118485 | 669.8 | 757 | 766 | 175.8 |
| C | 3 | 233 | 28803 | 159.52 | 757 | 766 | 175.8 |
| C | 9 | 54 | 14029 | 75.46 | 757 | 766 | 175.8 |
| D | 1 | 52 | 91889 | 456.96 | 747 | 731 | 199.5 |
| D | 10 | 70 | 37977 | 186.71 | 747 | 731 | 199.5 |
| D | 2 | 234 | 24820 | 120.76 | 747 | 731 | 199.5 |
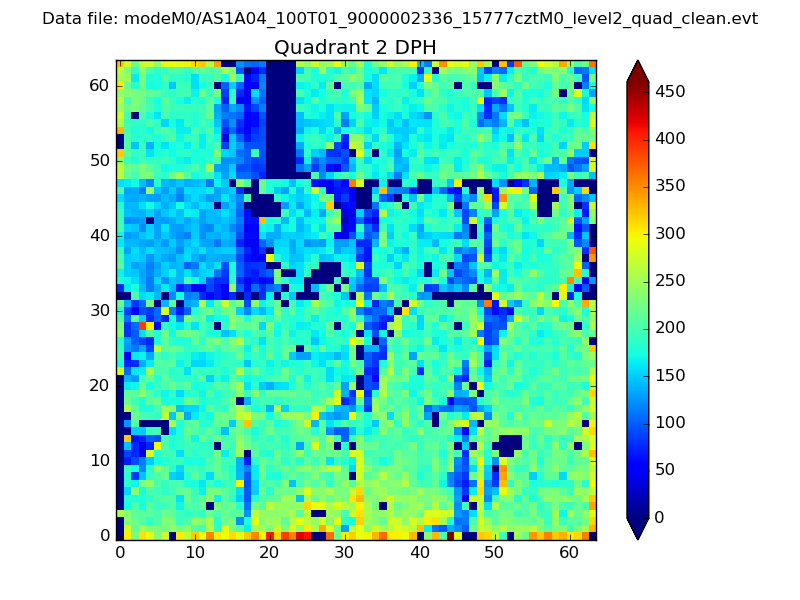
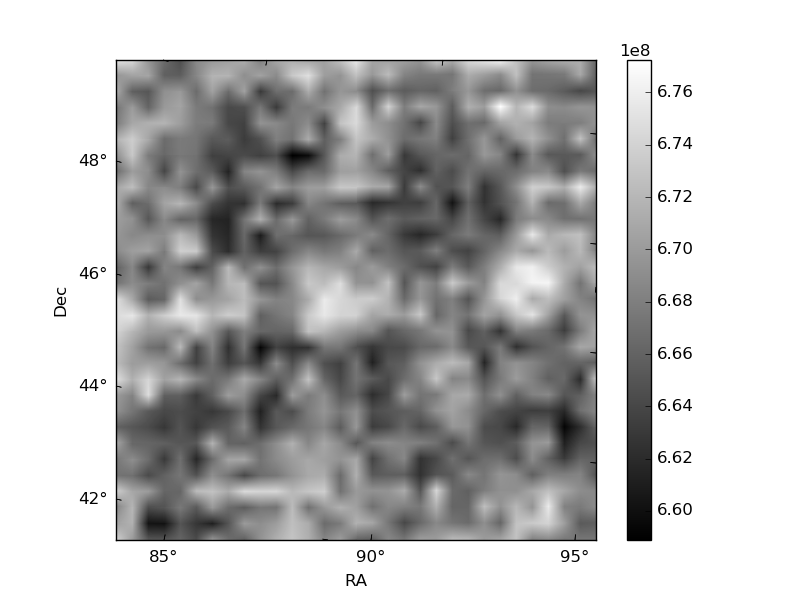
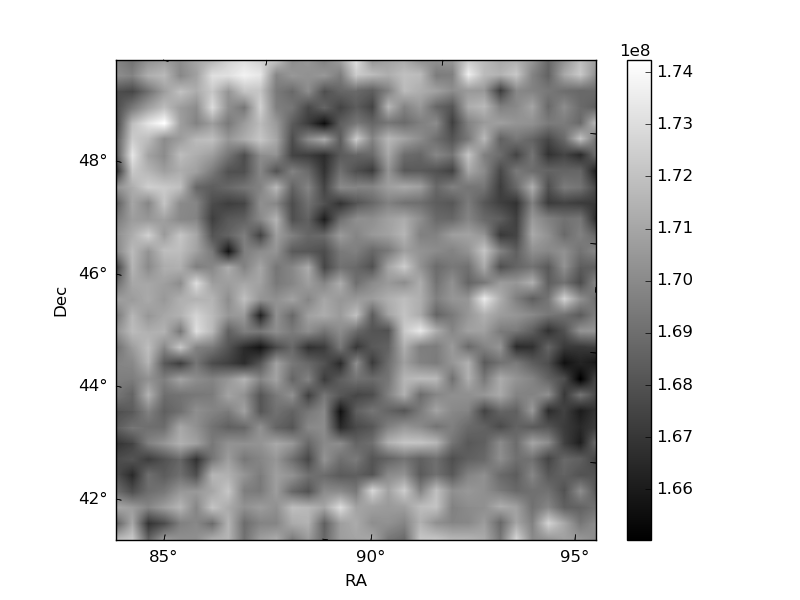
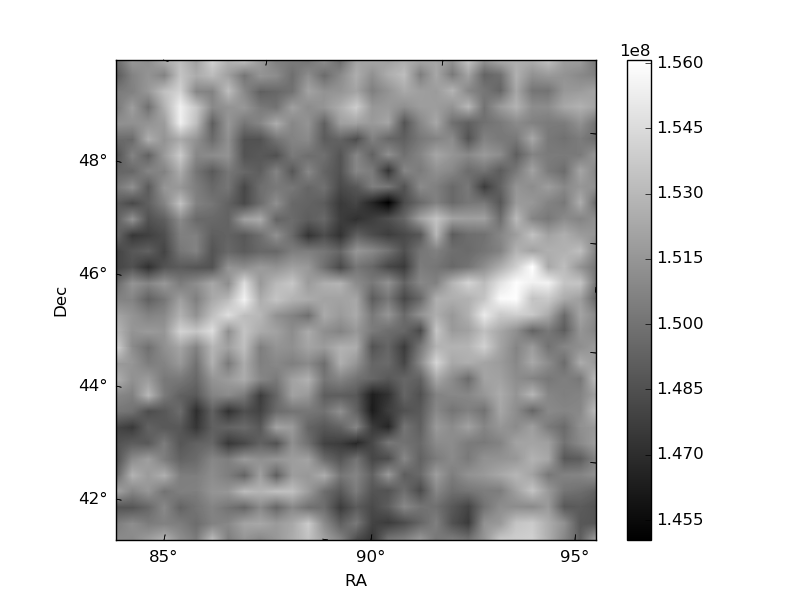
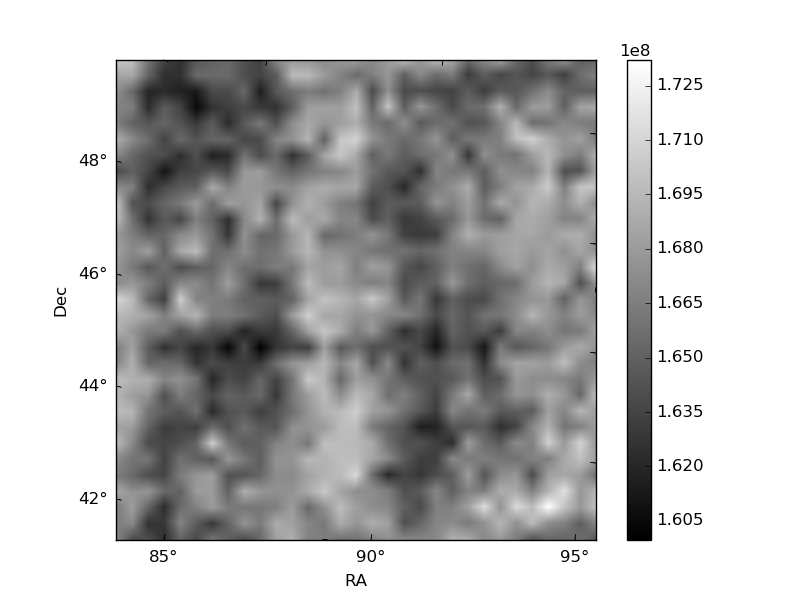
Histogram calculated using DETX and DETY for each event in the final _common_clean file
| Quadrant A | 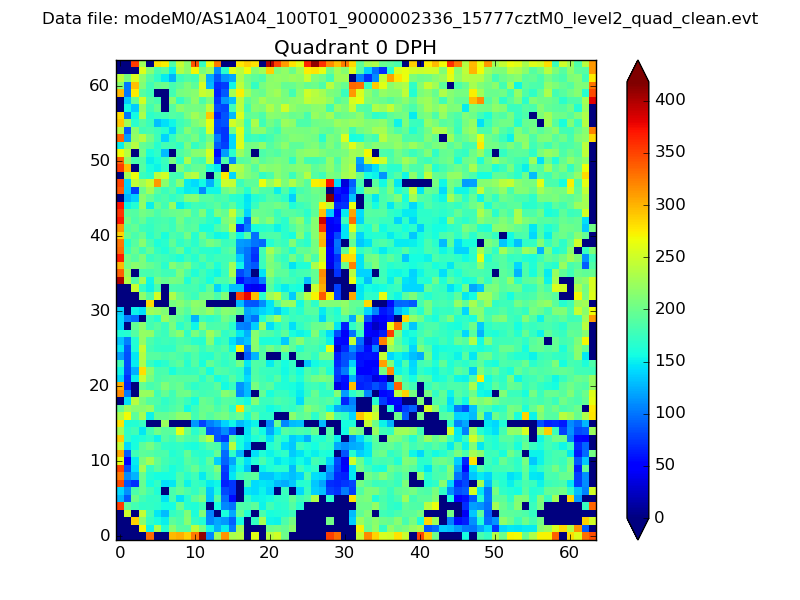 |
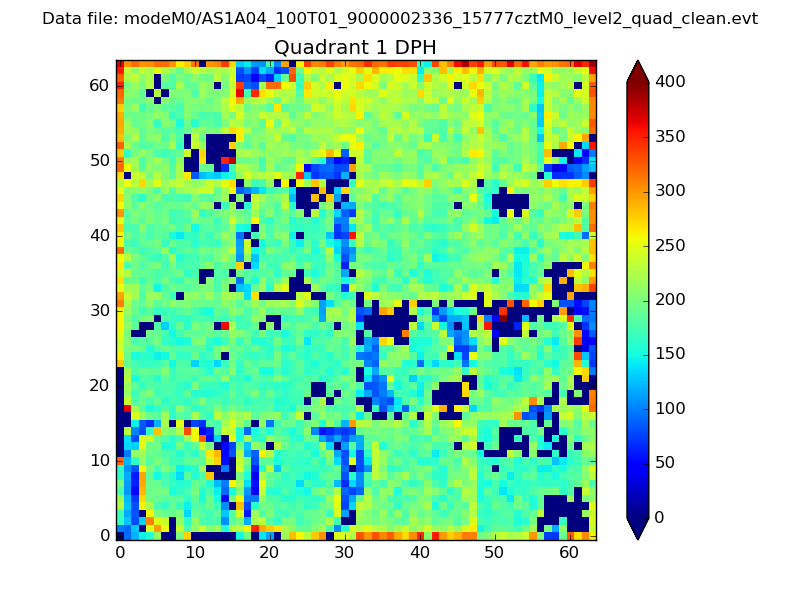 |
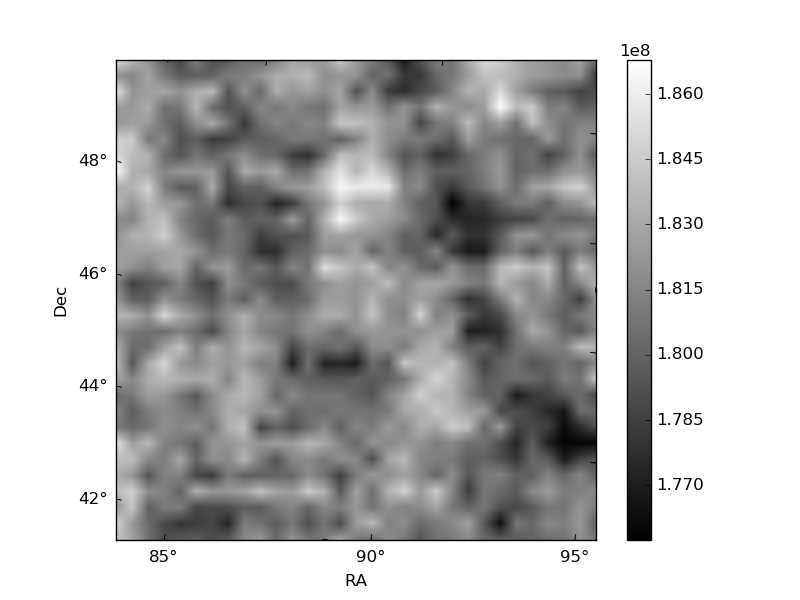
Quadrant B |
|---|---|---|---|
| Quadrant D | 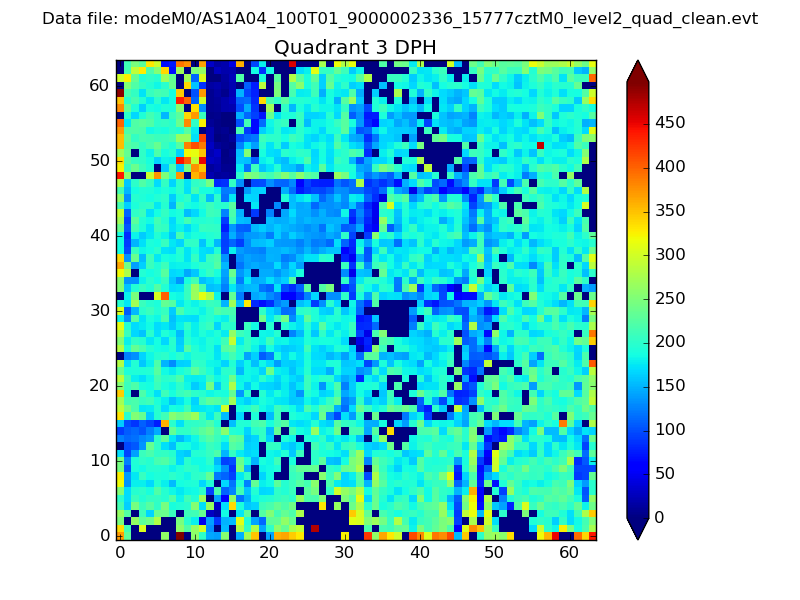 |
 |
Quadrant C |
| Plot type | Count rate plots | Images |
|---|---|---|
| Comparison with Poisson distribution Blue bars denote a histogram of data divided into 1 sec bins. Red curve is a Poisson curve with rate = median count rate of data. |
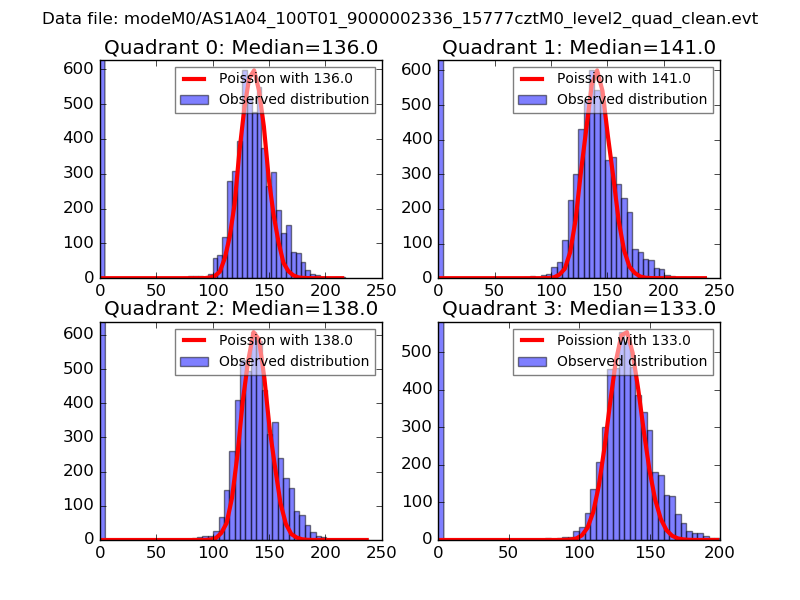 |
 |
| Quadrant-wise count rates Data is divided into 100 sec bins |
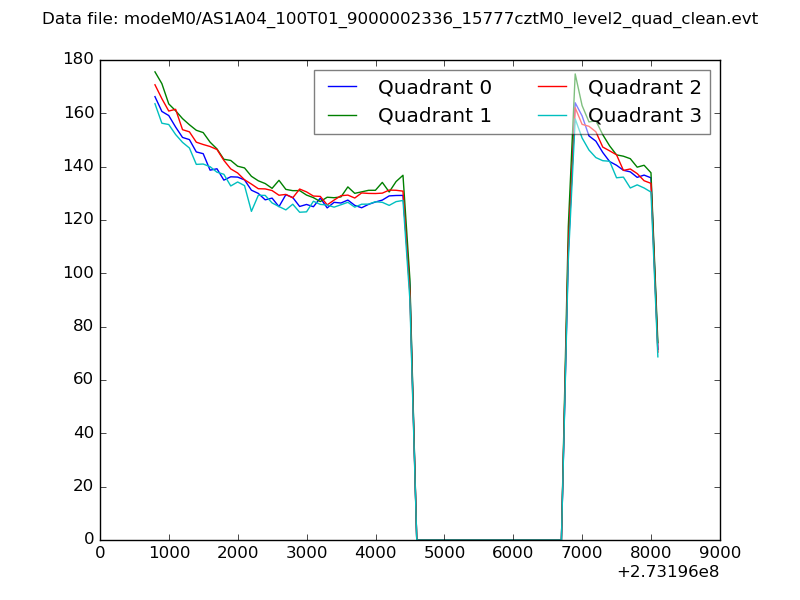 |
|
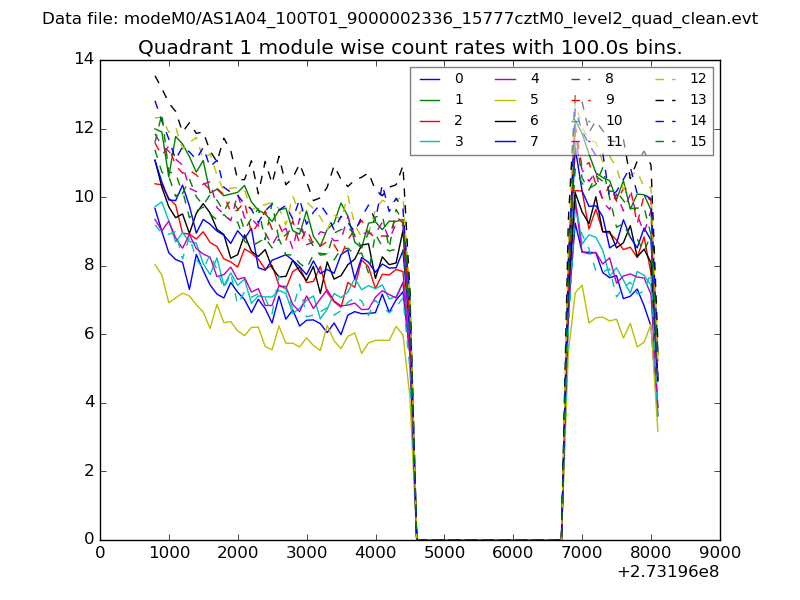
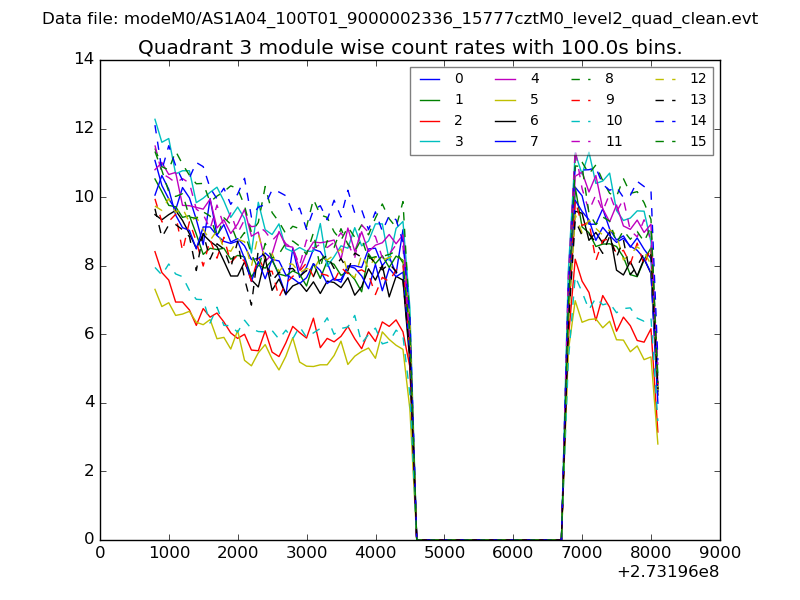
| Module-wise count rates for Quadrant A Data is divided into 100 sec bins |
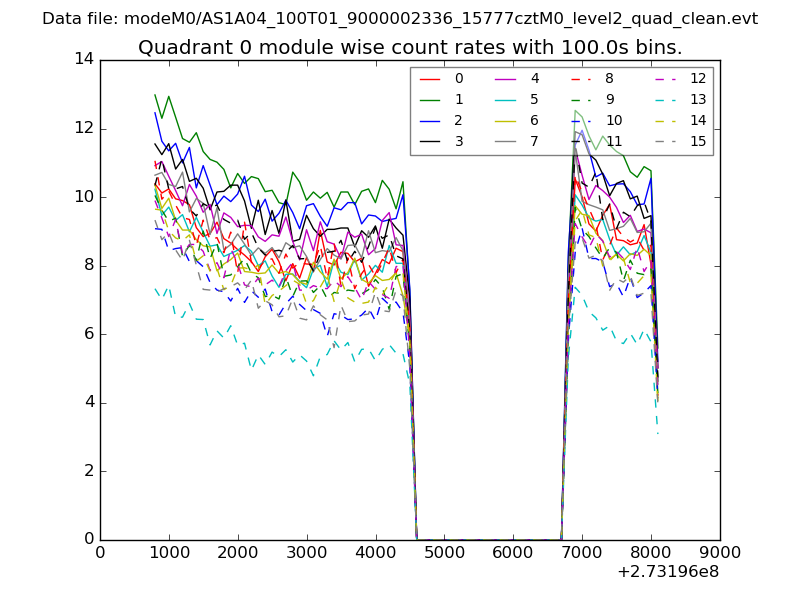 |
 |
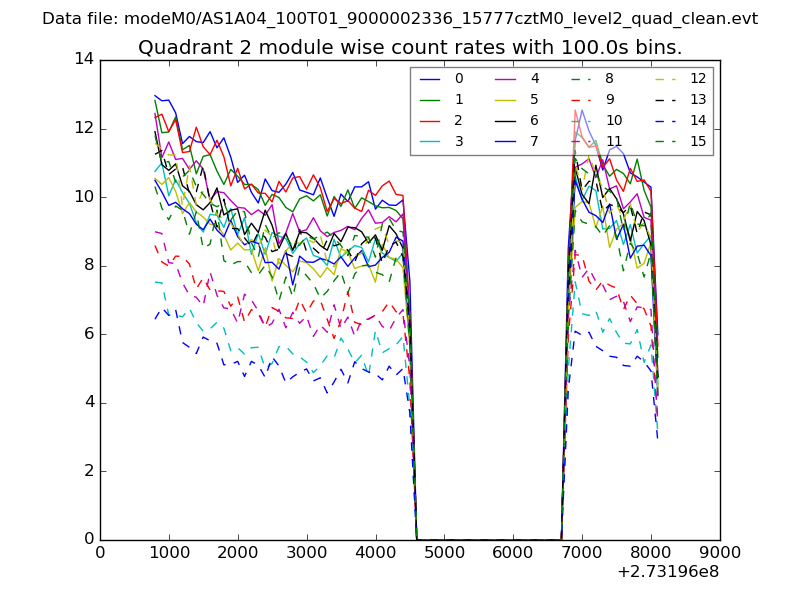
| Module-wise count rates for Quadrant B Data is divided into 100 sec bins |
 |
 |
| Module-wise count rates for Quadrant C Data is divided into 100 sec bins |
 |
 |
| Module-wise count rates for Quadrant D Data is divided into 100 sec bins |
 |
 |
| Parameter | Plot |
|---|---|
| CZT HV Monitor | 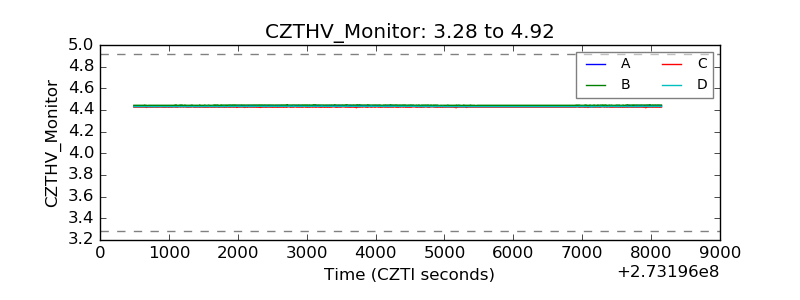 |
| D_VDD | 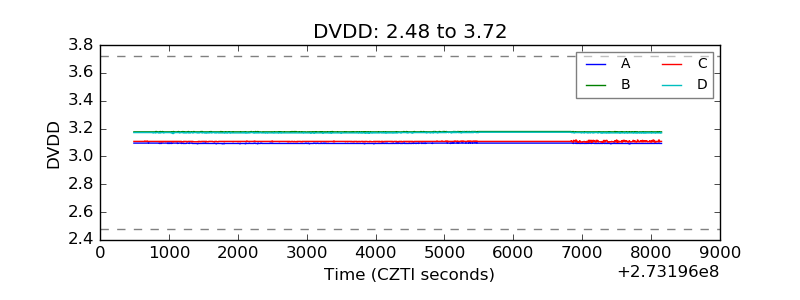 |
| Temperature 1 | 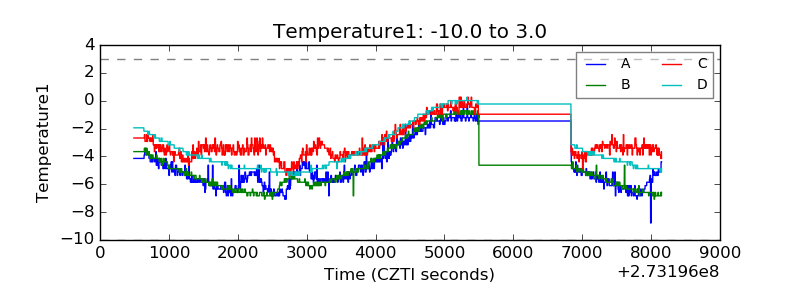 |
| Veto HV Monitor | 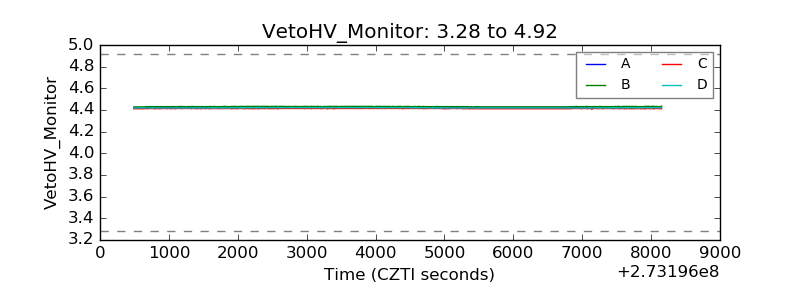 |
| Veto LLD | 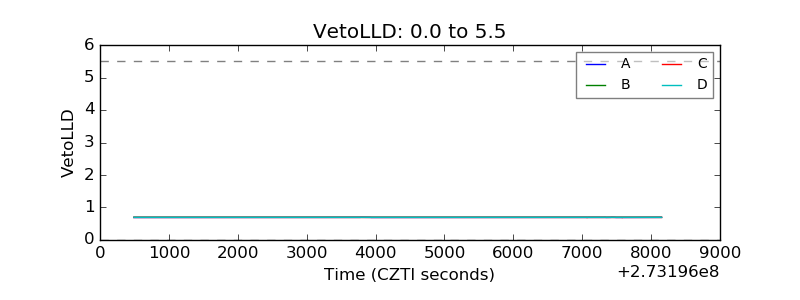 |
| Alpha Counter | 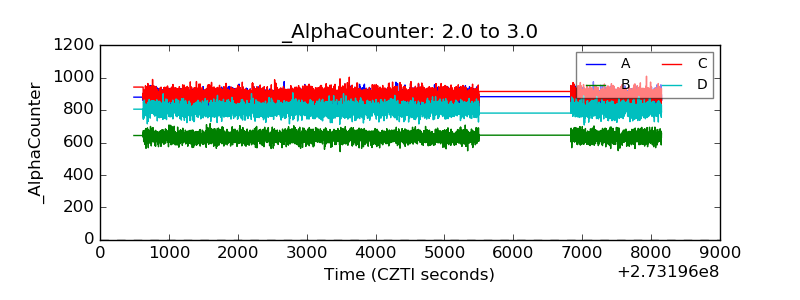 |
| _CPM_Rate | 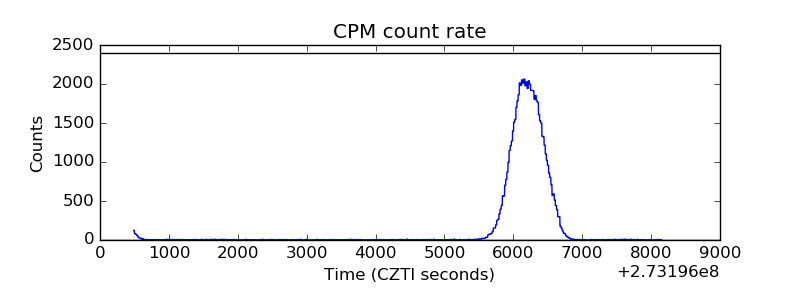 |
| CZT Counter | 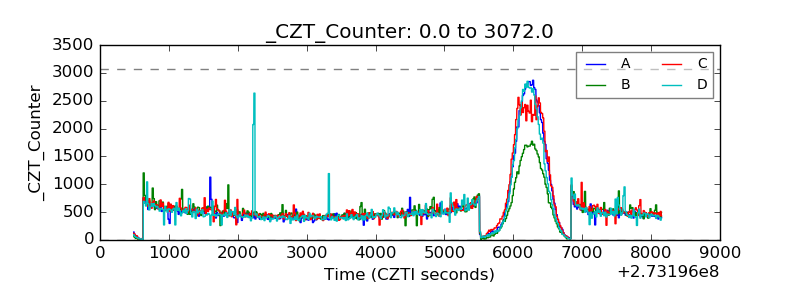 |
| +2.5 Volts monitor | 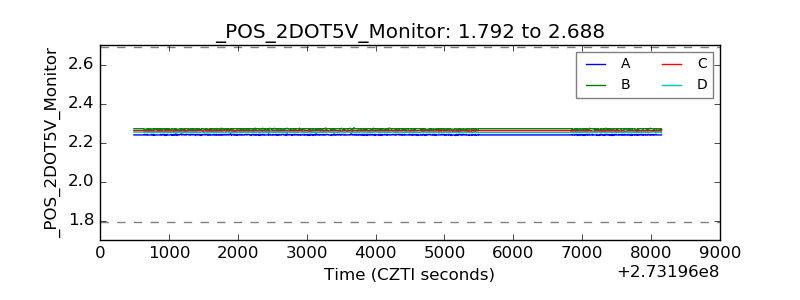 |
| +5 Volts monitor |  |
| _ROLL_ROT | 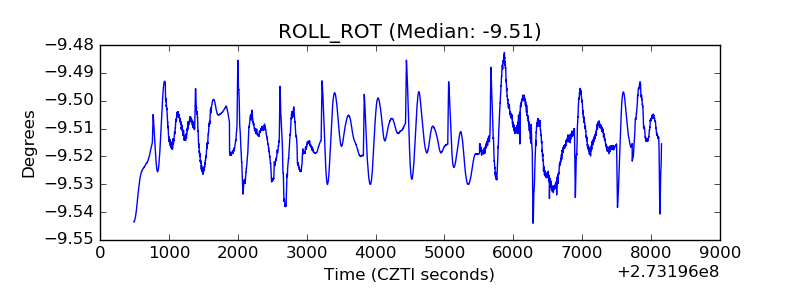 |
| _Roll_DEC | 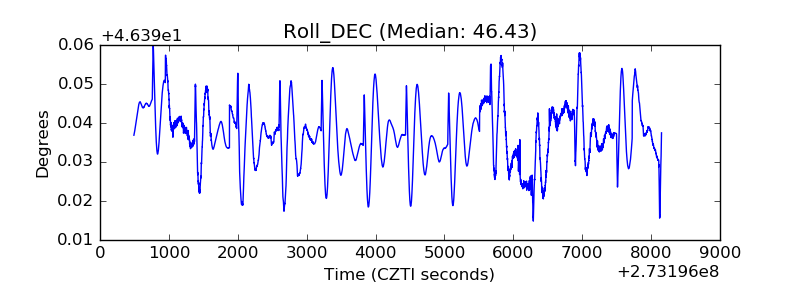 |
| _Roll_RA | 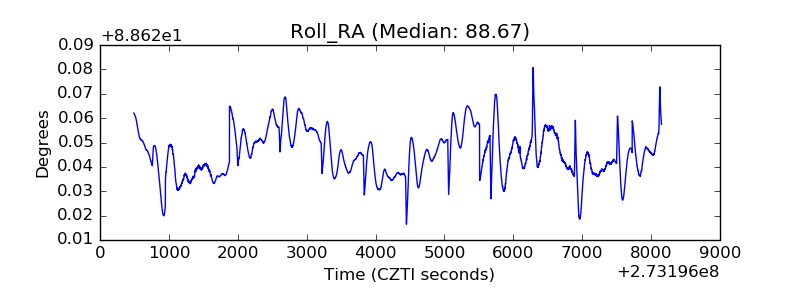 |
| Veto Counter | 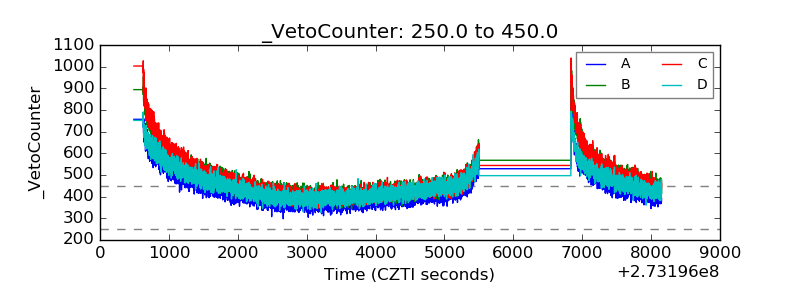 |