| Param | Original file | Final file |
|---|---|---|
| Filename | modeM0/AS1A04_100T01_9000002336_15778cztM0_level2.evt | modeM0/AS1A04_100T01_9000002336_15778cztM0_level2_quad_clean.evt |
| Size (bytes) | 437,287,680 | 107,521,920 |
| Size | 417.0 MB | 102.5 MB |
| Events in quadrant A | 3,112,587 | 693,165 |
| Events in quadrant B | 3,305,977 | 717,735 |
| Events in quadrant C | 3,216,678 | 701,166 |
| Events in quadrant D | 3,153,632 | 678,503 |
| Mode SS | |||
|---|---|---|---|
| Quadrant | BADHDUFLAG | Total packets | Discarded packets |
| A | 0 | 134 | 0 |
| B | 0 | 134 | 0 |
| C | 0 | 134 | 0 |
| D | 0 | 134 | 0 |
| Mode M0 | |||
|---|---|---|---|
| Quadrant | BADHDUFLAG | Total packets | Discarded packets |
| A | 0 | 13790 | 3 |
| B | 0 | 14243 | 2 |
| C | 0 | 13977 | 2 |
| D | 0 | 14137 | 2 |
| Mode M9 | |||
|---|---|---|---|
| Quadrant | BADHDUFLAG | Total packets | Discarded packets |
| A | 0 | 16 | 0 |
| B | 0 | 16 | 0 |
| C | 0 | 16 | 0 |
| D | 0 | 17 | 0 |
| Quadrant | Total seconds | Saturated seconds | Saturation percentage |
|---|---|---|---|
| A | 6688 | 17 | 0.254187% |
| B | 6688 | 43 | 0.642943% |
| C | 6688 | 74 | 1.106459% |
| D | 6688 | 15 | 0.224282% |
Noise dominated data is calculated using 1-second bins in cleaned event files. If a bin has >2000 counts, and if more than 50% of those come from <1% of pixels, then it is considered to be noise-dominated and hence unusable.
| Quadrant | # 1 sec bins | Bins with >0 counts | Bins with >2000 counts | High rate bins dominated by noise | Noise dominated (total time) | Noise dominated (detector-on time) | Marked lightcurve |
|---|---|---|---|---|---|---|---|
| A | 7944 | 6690 | 0 | 0 | 0.00% | 0.00% | 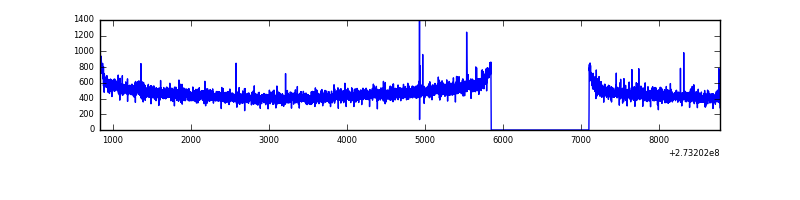 |
| B | 7944 | 6690 | 1 | 1 | 0.01% | 0.01% | 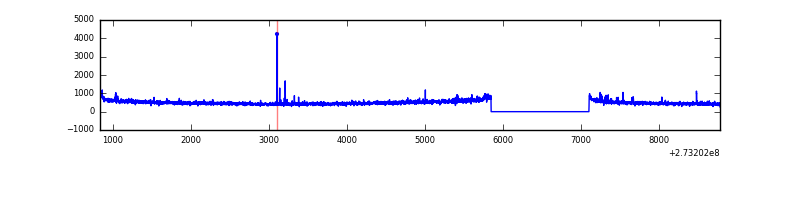 |
| C | 7944 | 6690 | 0 | 0 | 0.00% | 0.00% | 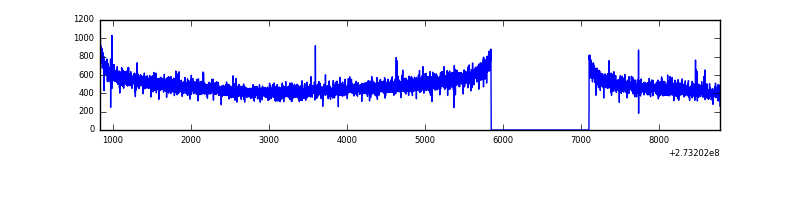 |
| D | 7944 | 6690 | 4 | 4 | 0.05% | 0.06% | 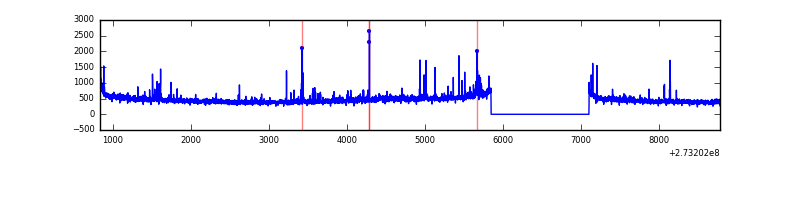 |
Top three noisy pixels from each quadrant. If the there are fewer than three noisy pixels in the level2.evt file, extra rows are filled as -1
| Pixel properties | Quadrant properties | ||||||
|---|---|---|---|---|---|---|---|
| Quadrant | DetID | PixID | Counts | Sigma | Mean | Median | Sigma |
| A | 0 | 226 | 7176 | 39.18 | 805 | 790 | 163.0 |
| A | 12 | 194 | 5866 | 31.14 | 805 | 790 | 163.0 |
| A | 3 | 137 | 5180 | 26.94 | 805 | 790 | 163.0 |
| B | 3 | 209 | 27520 | 175.02 | 817 | 800 | 152.7 |
| B | 0 | 189 | 24787 | 157.12 | 817 | 800 | 152.7 |
| B | 12 | 111 | 17455 | 109.09 | 817 | 800 | 152.7 |
| C | 14 | 238 | 123963 | 675.57 | 785 | 792 | 182.3 |
| C | 3 | 233 | 10451 | 52.98 | 785 | 792 | 182.3 |
| C | 8 | 128 | 9504 | 47.78 | 785 | 792 | 182.3 |
| D | 1 | 52 | 86097 | 441.38 | 781 | 759 | 193.3 |
| D | 5 | 51 | 30678 | 154.75 | 781 | 759 | 193.3 |
| D | 13 | 172 | 28647 | 144.24 | 781 | 759 | 193.3 |
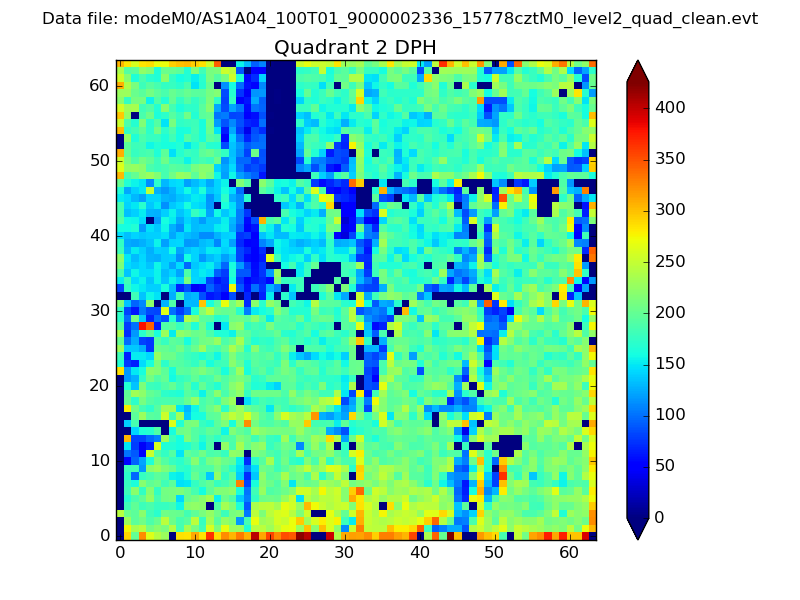
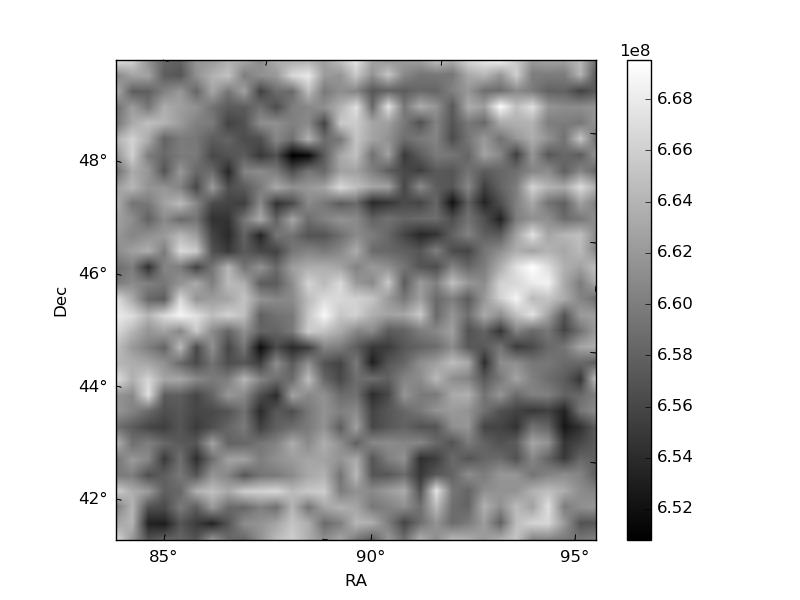
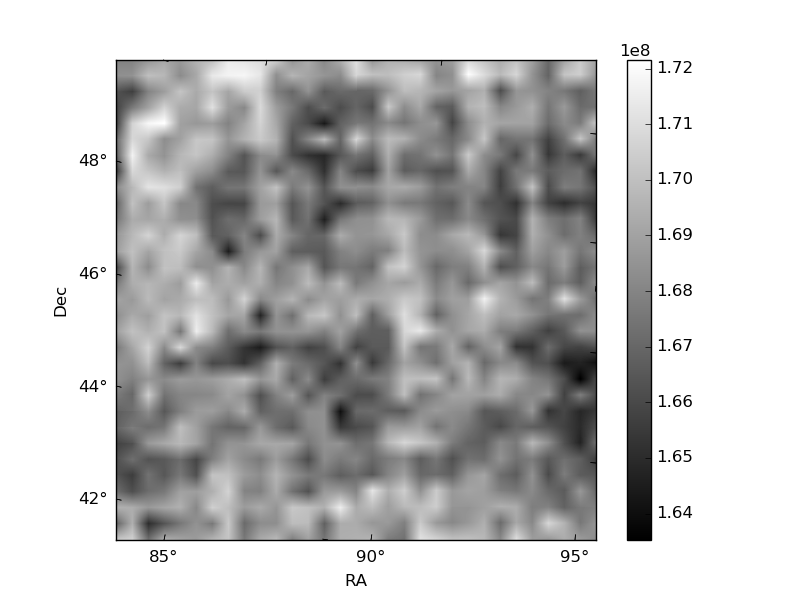
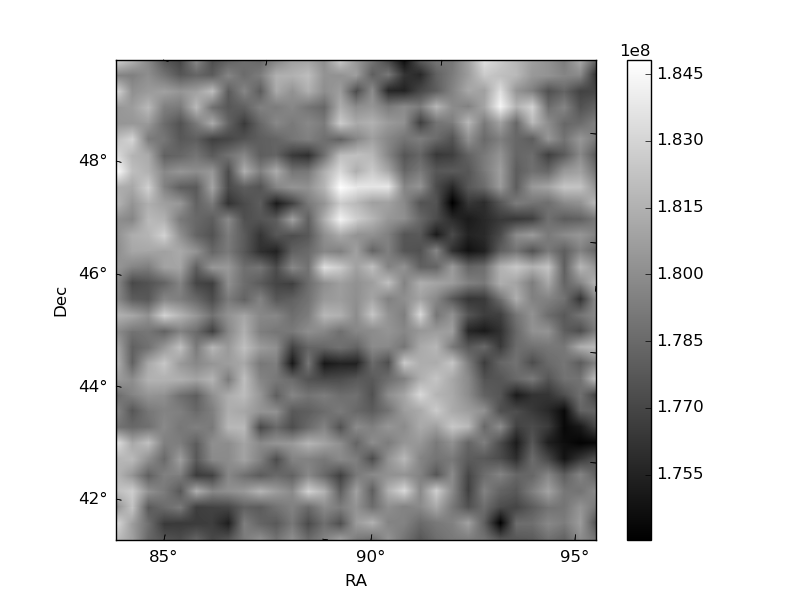
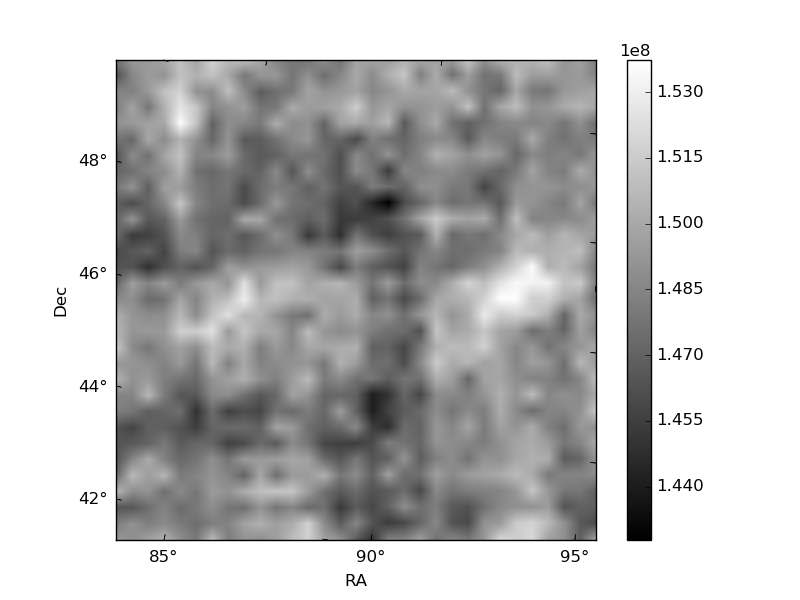
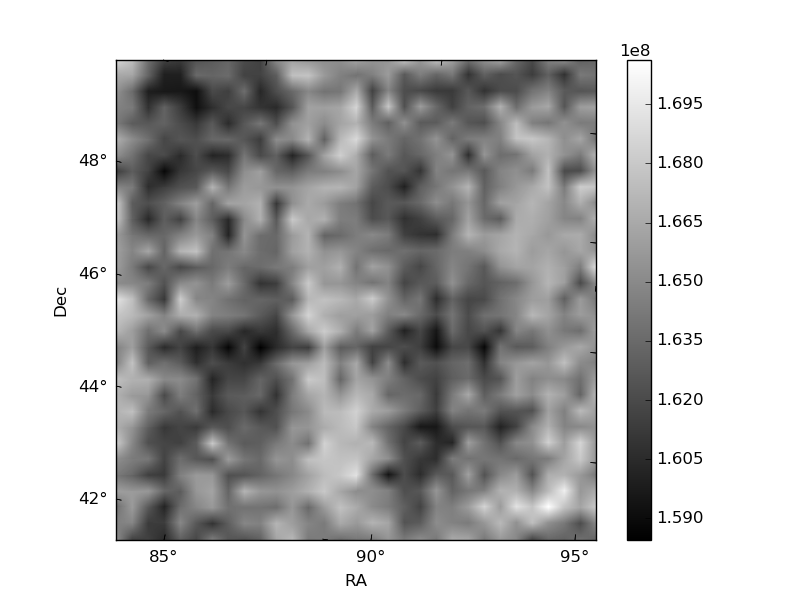
Histogram calculated using DETX and DETY for each event in the final _common_clean file
| Quadrant A | 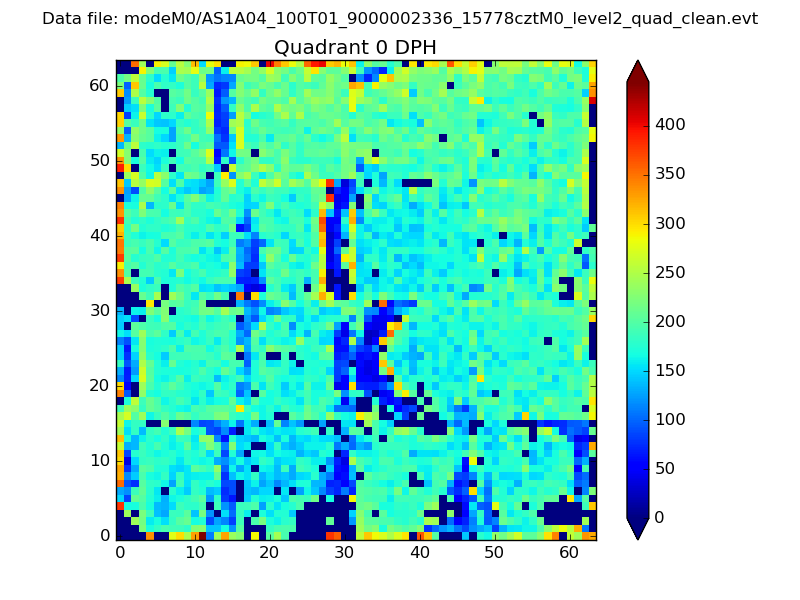 |
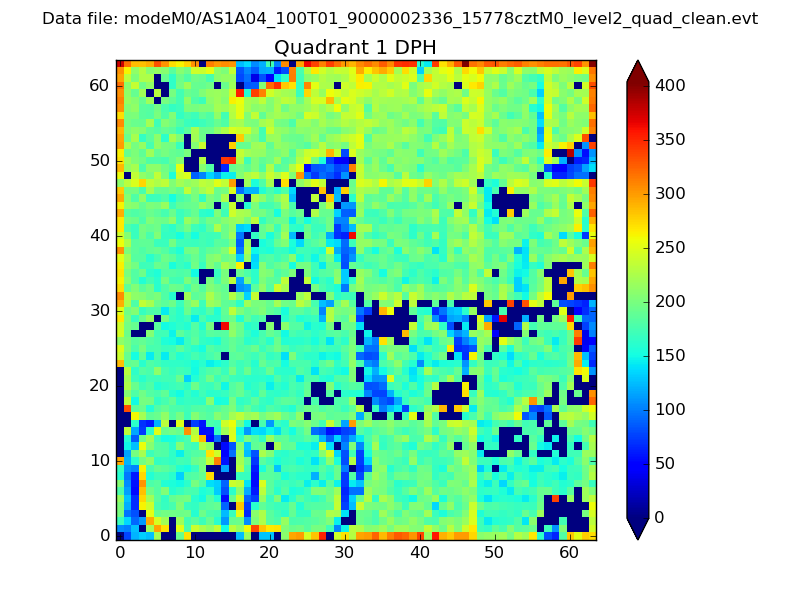 |
Quadrant B |
|---|---|---|---|
| Quadrant D | 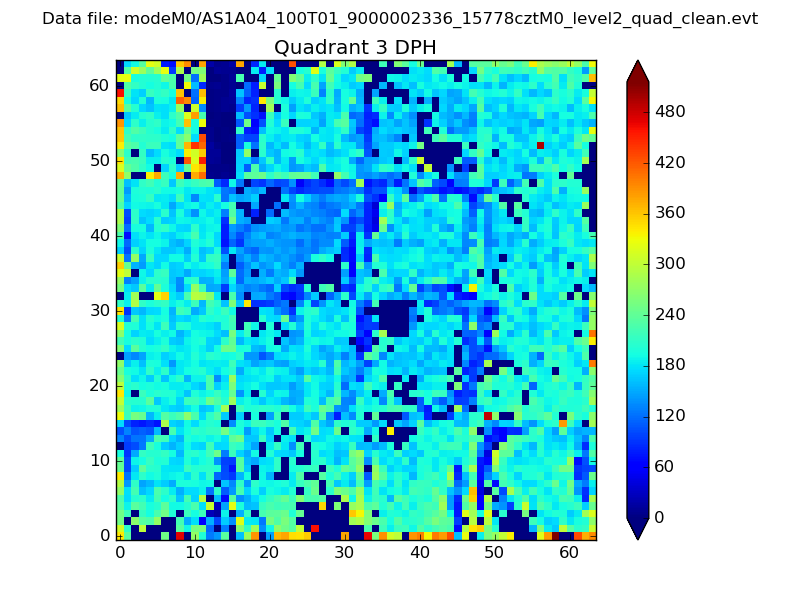 |
 |
Quadrant C |
| Plot type | Count rate plots | Images |
|---|---|---|
| Comparison with Poisson distribution Blue bars denote a histogram of data divided into 1 sec bins. Red curve is a Poisson curve with rate = median count rate of data. |
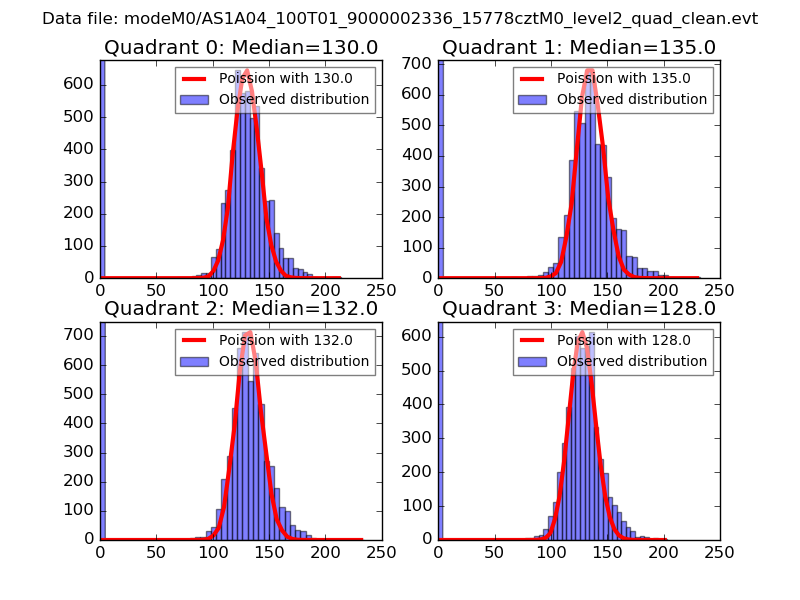 |
 |
| Quadrant-wise count rates Data is divided into 100 sec bins |
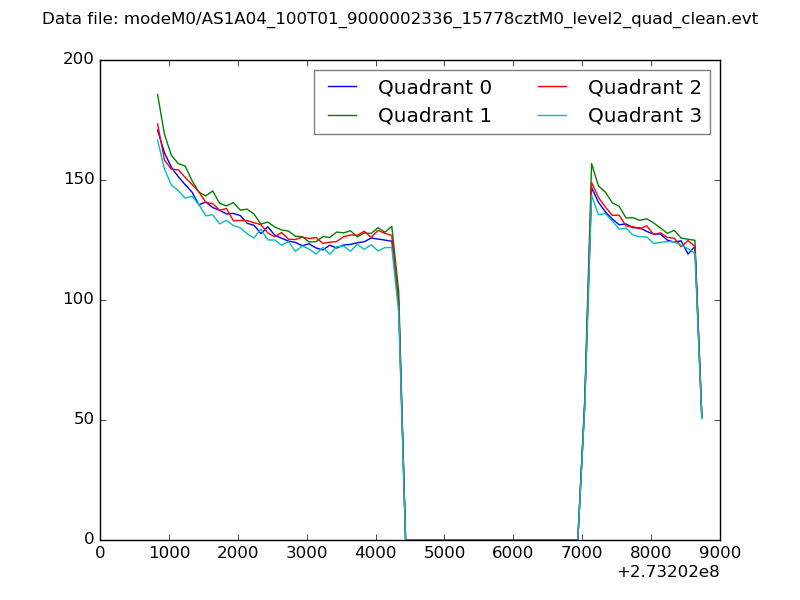 |
|
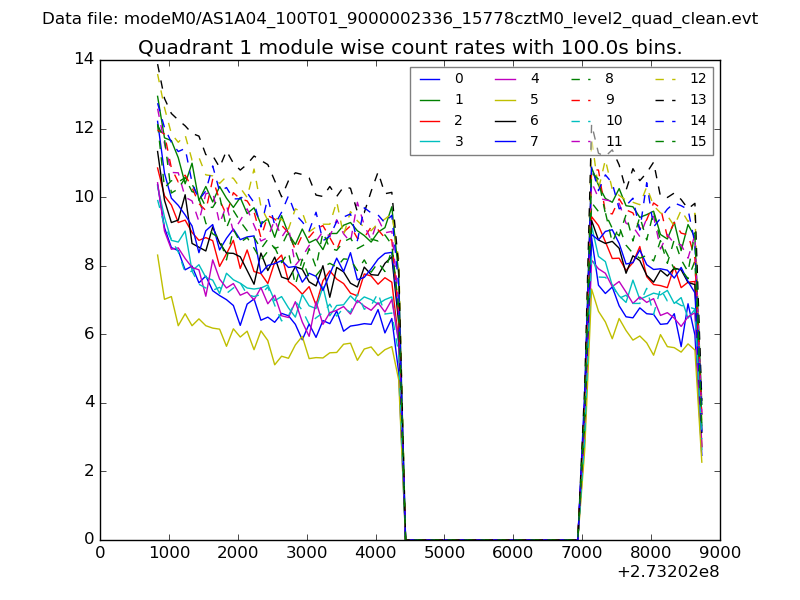
| Module-wise count rates for Quadrant A Data is divided into 100 sec bins |
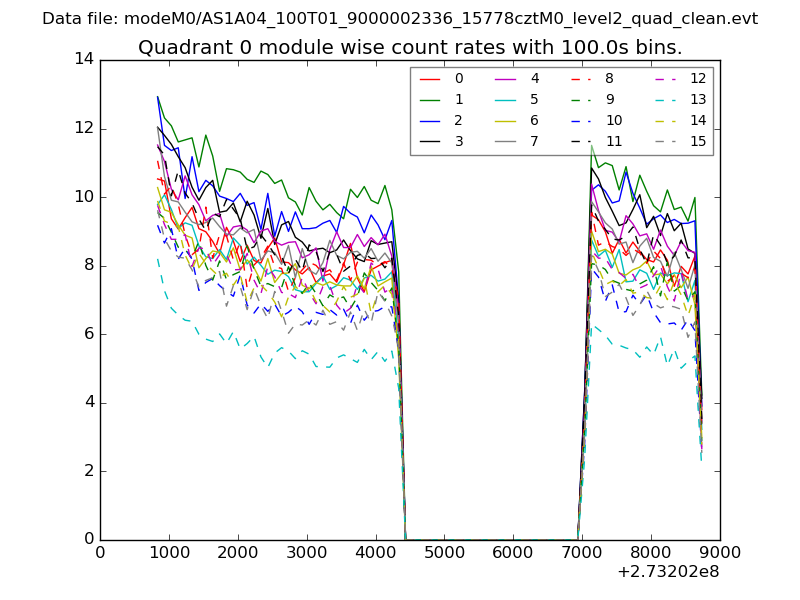 |
 |
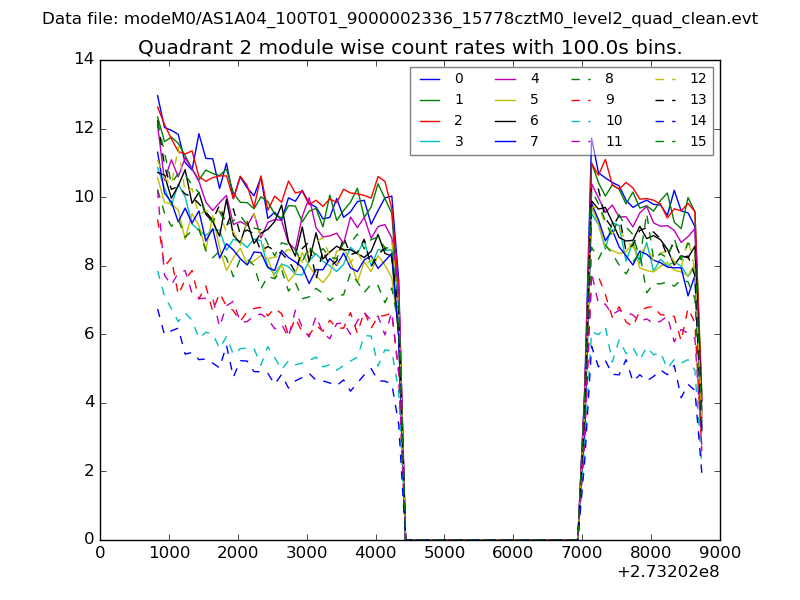
| Module-wise count rates for Quadrant B Data is divided into 100 sec bins |
 |
 |
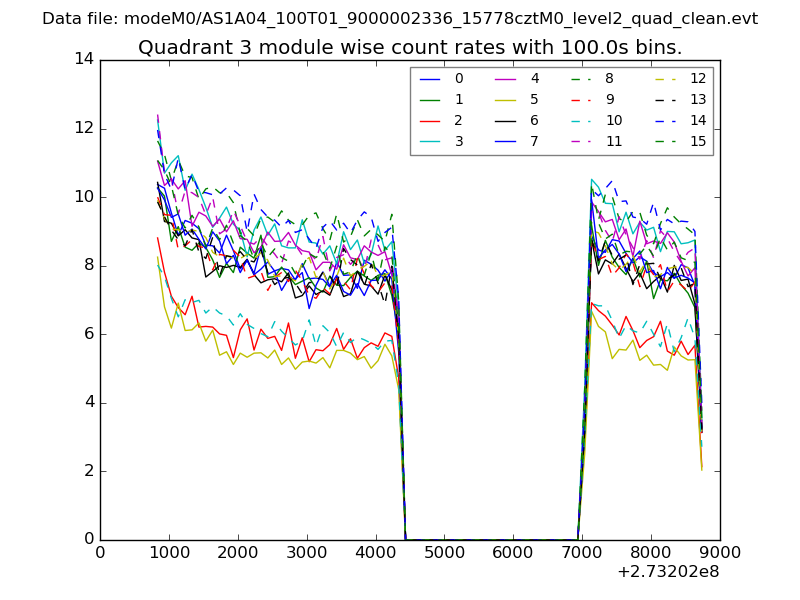
| Module-wise count rates for Quadrant C Data is divided into 100 sec bins |
 |
 |
| Module-wise count rates for Quadrant D Data is divided into 100 sec bins |
 |
 |
| Parameter | Plot |
|---|---|
| CZT HV Monitor | 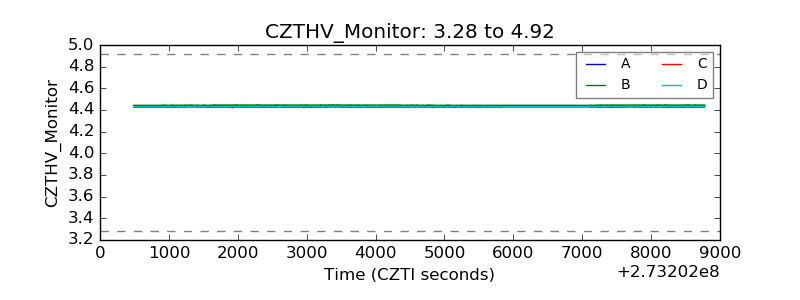 |
| D_VDD | 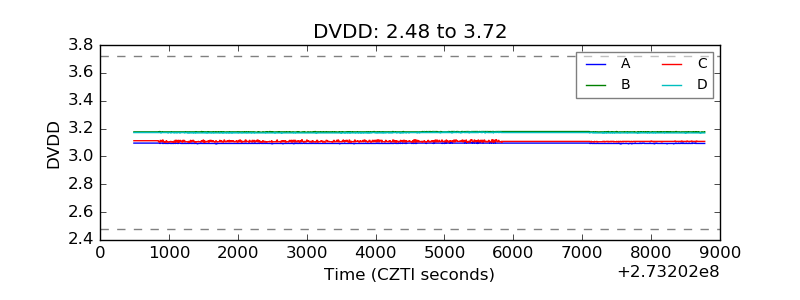 |
| Temperature 1 | 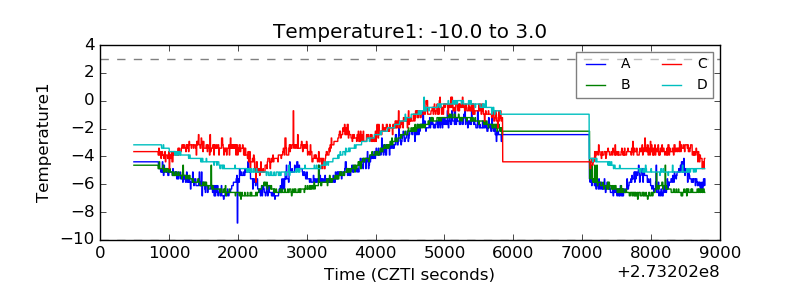 |
| Veto HV Monitor | 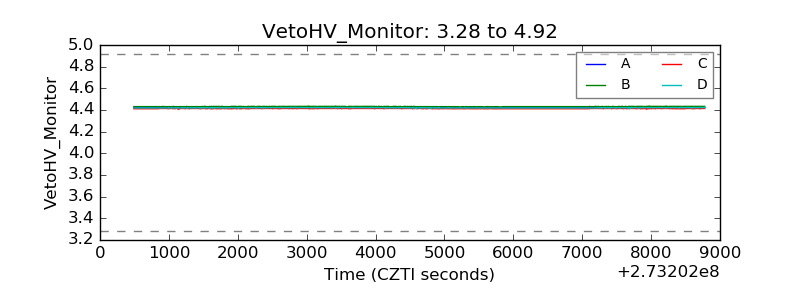 |
| Veto LLD | 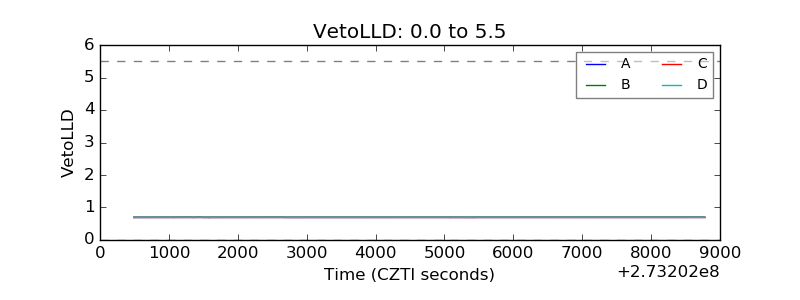 |
| Alpha Counter | 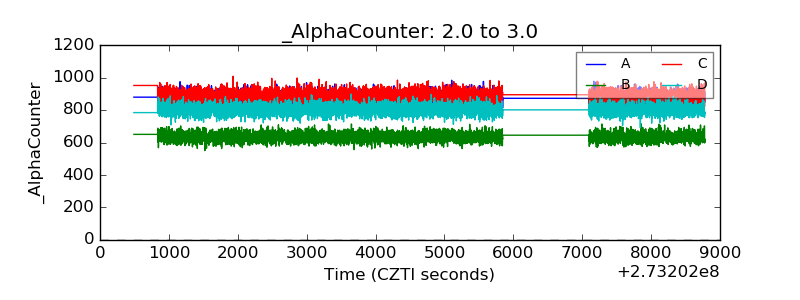 |
| _CPM_Rate | 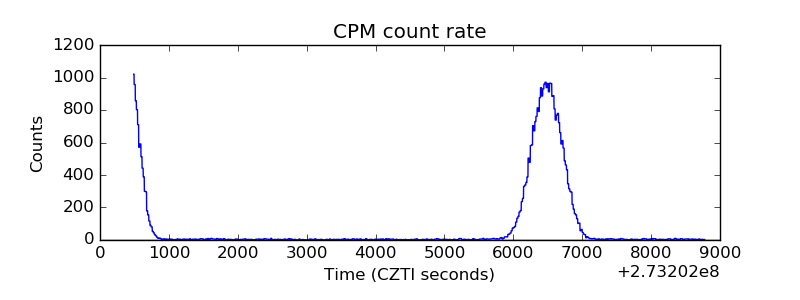 |
| CZT Counter | 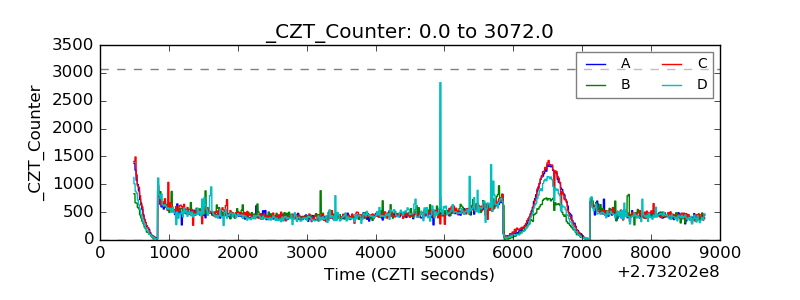 |
| +2.5 Volts monitor | 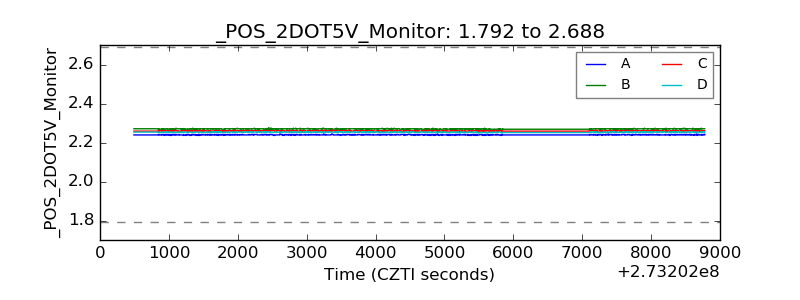 |
| +5 Volts monitor |  |
| _ROLL_ROT | 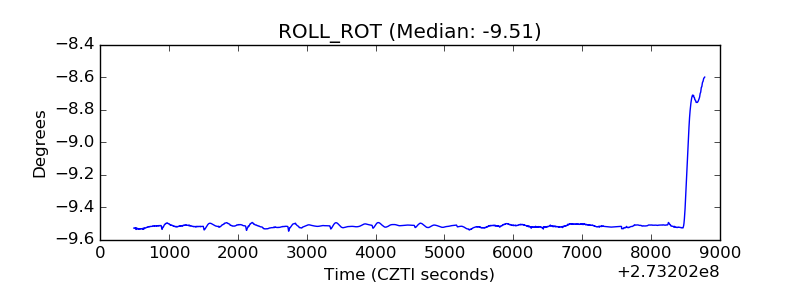 |
| _Roll_DEC | 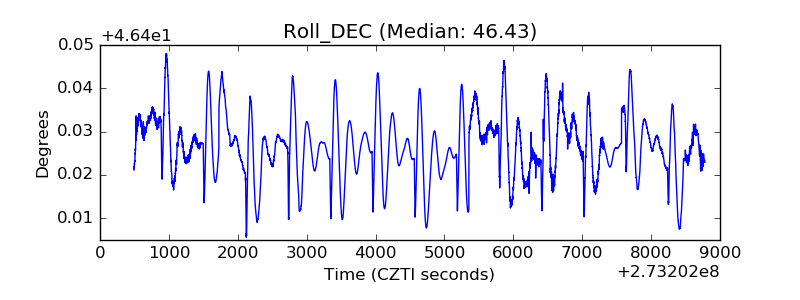 |
| _Roll_RA | 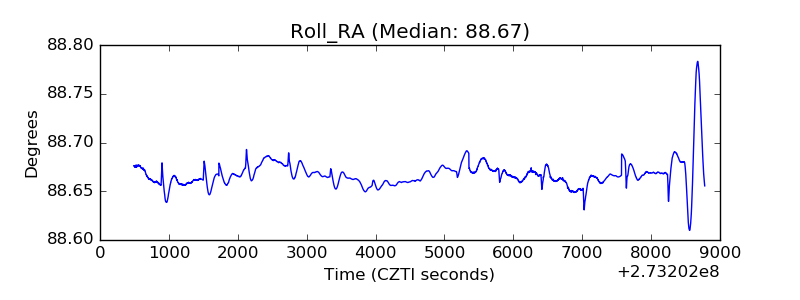 |
| Veto Counter | 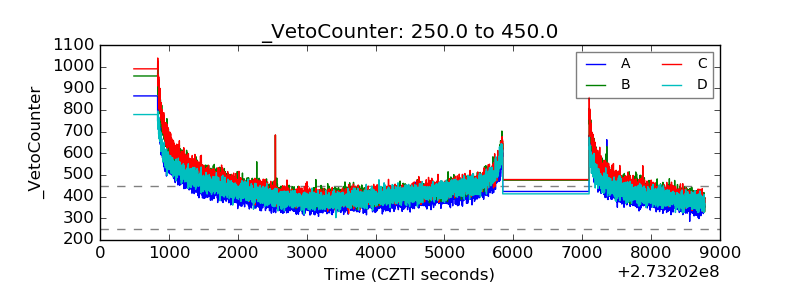 |