| Param | Original file | Final file |
|---|---|---|
| Filename | modeM0/AS1A04_100T01_9000002336_15779cztM0_level2.evt | modeM0/AS1A04_100T01_9000002336_15779cztM0_level2_quad_clean.evt |
| Size (bytes) | 384,785,280 | 78,583,680 |
| Size | 367.0 MB | 74.9 MB |
| Events in quadrant A | 2,771,805 | 486,665 |
| Events in quadrant B | 2,906,291 | 500,636 |
| Events in quadrant C | 2,792,506 | 492,703 |
| Events in quadrant D | 2,771,044 | 477,546 |
| Mode SS | |||
|---|---|---|---|
| Quadrant | BADHDUFLAG | Total packets | Discarded packets |
| A | 0 | 122 | 0 |
| B | 0 | 122 | 0 |
| C | 0 | 122 | 0 |
| D | 0 | 122 | 0 |
| Mode M0 | |||
|---|---|---|---|
| Quadrant | BADHDUFLAG | Total packets | Discarded packets |
| A | 0 | 12510 | 2 |
| B | 0 | 12783 | 1 |
| C | 0 | 12441 | 1 |
| D | 0 | 12746 | 1 |
| Mode M9 | |||
|---|---|---|---|
| Quadrant | BADHDUFLAG | Total packets | Discarded packets |
| A | 0 | 10 | 0 |
| B | 0 | 10 | 0 |
| C | 0 | 10 | 0 |
| D | 0 | 10 | 0 |
| Quadrant | Total seconds | Saturated seconds | Saturation percentage |
|---|---|---|---|
| A | 6046 | 32 | 0.529276% |
| B | 6046 | 58 | 0.959312% |
| C | 6046 | 68 | 1.124711% |
| D | 6046 | 28 | 0.463116% |
Noise dominated data is calculated using 1-second bins in cleaned event files. If a bin has >2000 counts, and if more than 50% of those come from <1% of pixels, then it is considered to be noise-dominated and hence unusable.
| Quadrant | # 1 sec bins | Bins with >0 counts | Bins with >2000 counts | High rate bins dominated by noise | Noise dominated (total time) | Noise dominated (detector-on time) | Marked lightcurve |
|---|---|---|---|---|---|---|---|
| A | 7017 | 6048 | 8 | 8 | 0.11% | 0.13% | 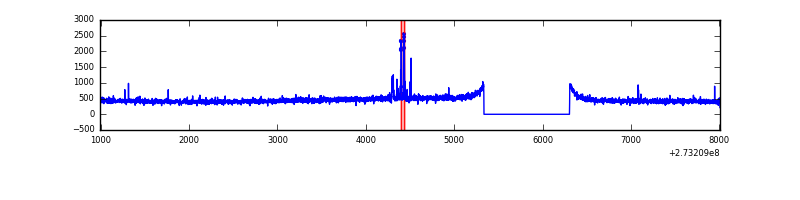 |
| B | 7017 | 6048 | 1 | 1 | 0.01% | 0.02% | 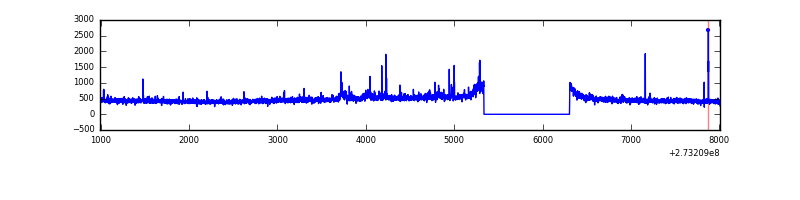 |
| C | 7017 | 6048 | 0 | 0 | 0.00% | 0.00% | 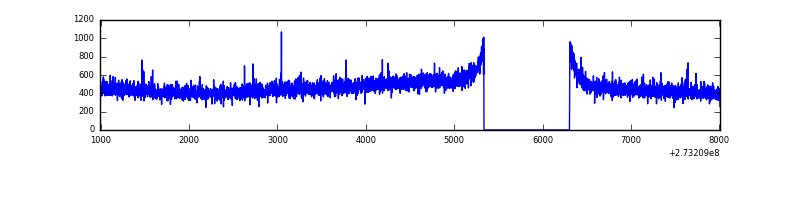 |
| D | 7017 | 6048 | 9 | 9 | 0.13% | 0.15% | 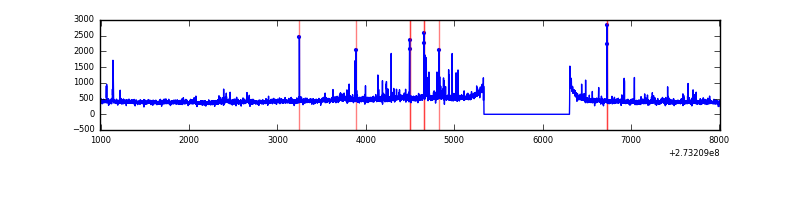 |
Top three noisy pixels from each quadrant. If the there are fewer than three noisy pixels in the level2.evt file, extra rows are filled as -1
| Pixel properties | Quadrant properties | ||||||
|---|---|---|---|---|---|---|---|
| Quadrant | DetID | PixID | Counts | Sigma | Mean | Median | Sigma |
| A | 0 | 230 | 34236 | 235.39 | 706 | 692 | 142.5 |
| A | 15 | 239 | 13393 | 89.13 | 706 | 692 | 142.5 |
| A | 0 | 226 | 8804 | 56.93 | 706 | 692 | 142.5 |
| B | 4 | 216 | 26413 | 186.97 | 713 | 696 | 137.5 |
| B | 0 | 189 | 23102 | 162.89 | 713 | 696 | 137.5 |
| B | 3 | 209 | 17605 | 122.93 | 713 | 696 | 137.5 |
| C | 14 | 238 | 106256 | 665.33 | 683 | 687 | 158.7 |
| C | 3 | 233 | 9825 | 57.59 | 683 | 687 | 158.7 |
| C | 10 | 22 | 5172 | 28.27 | 683 | 687 | 158.7 |
| D | 1 | 52 | 56112 | 301.58 | 680 | 666 | 183.9 |
| D | 2 | 14 | 49885 | 267.71 | 680 | 666 | 183.9 |
| D | 2 | 234 | 24197 | 127.99 | 680 | 666 | 183.9 |
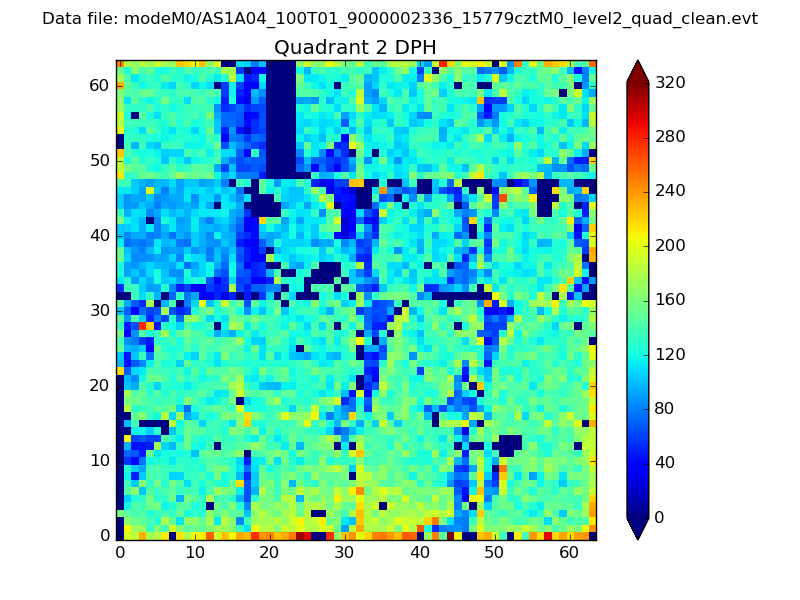
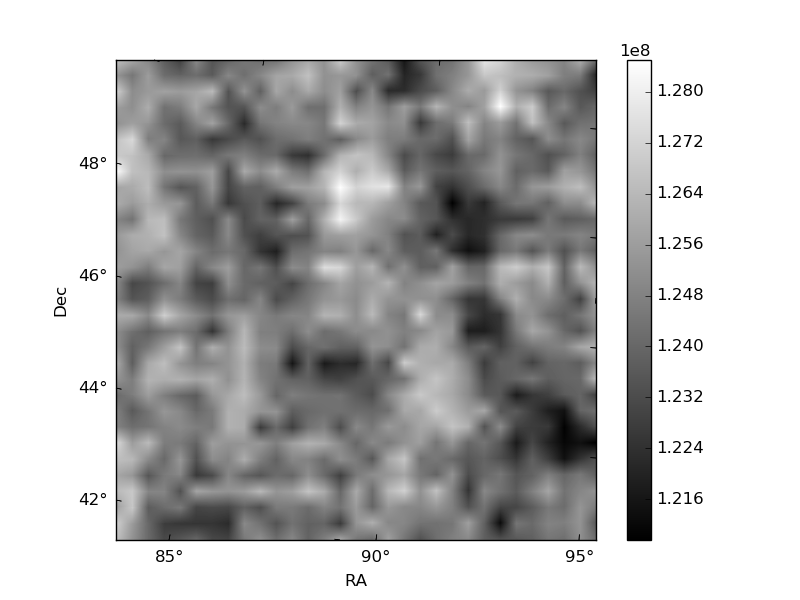
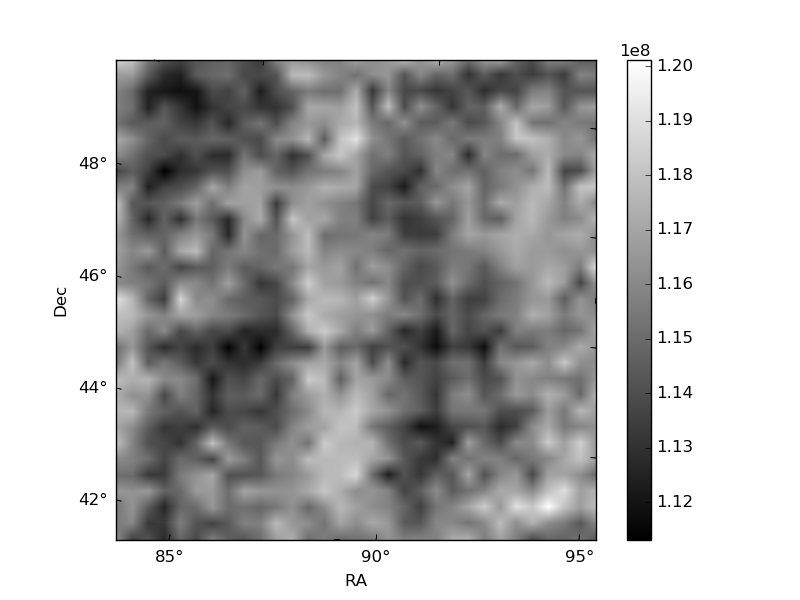
Histogram calculated using DETX and DETY for each event in the final _common_clean file
| Quadrant A | 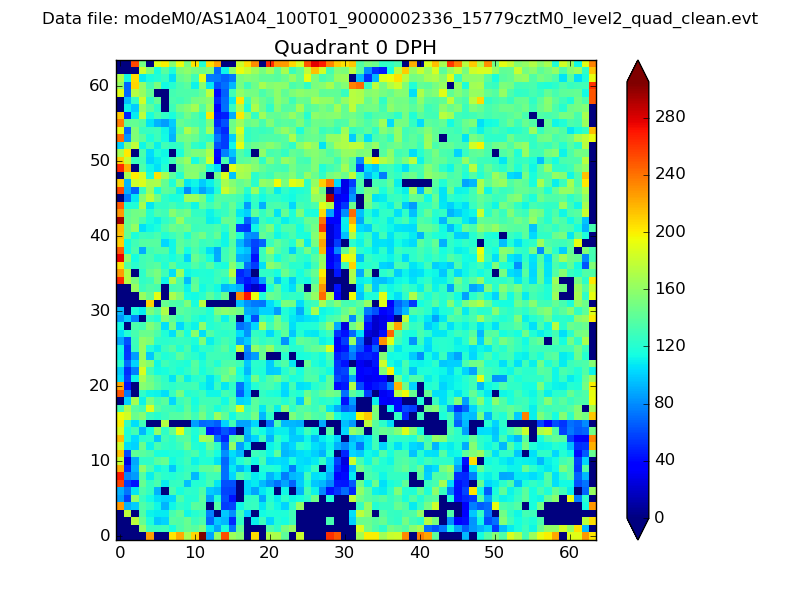 |
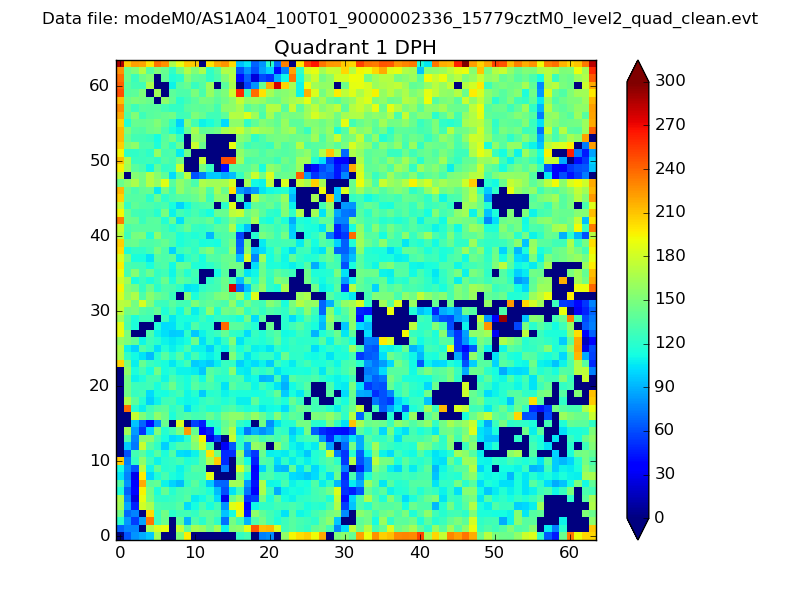 |
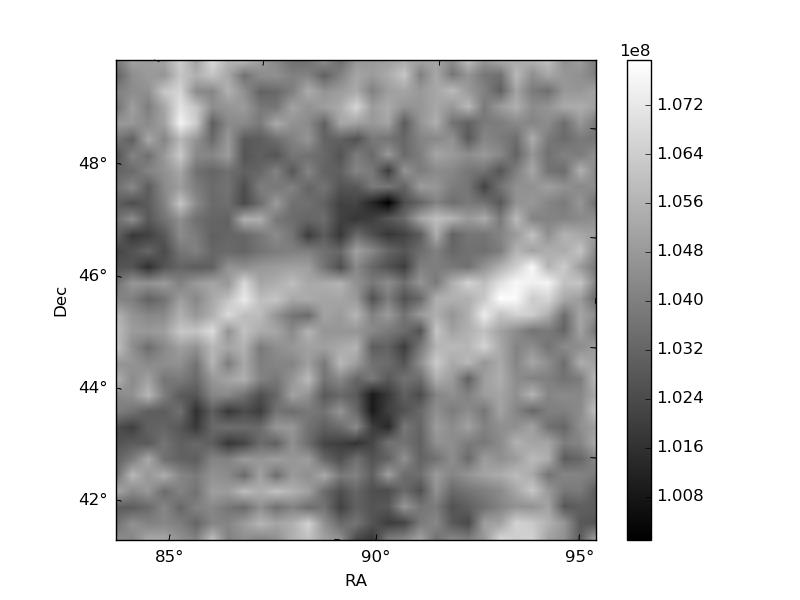
Quadrant B |
|---|---|---|---|
| Quadrant D | 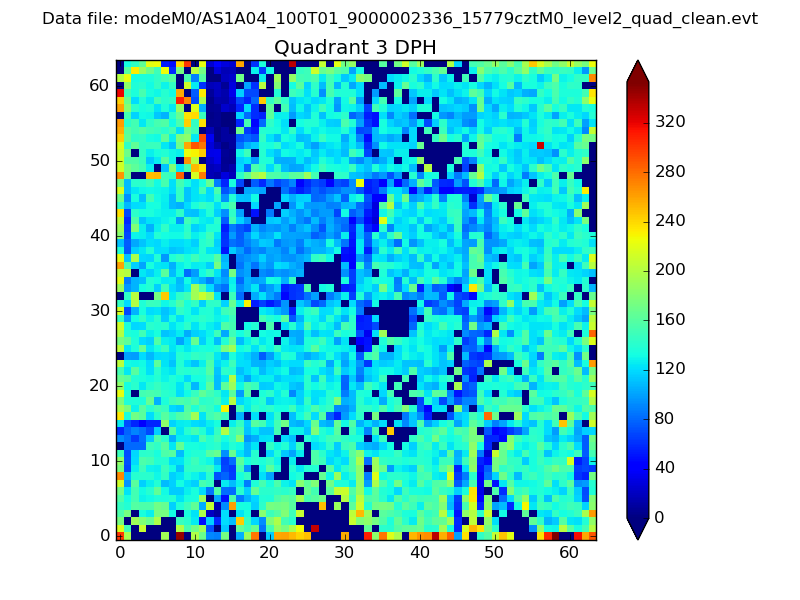 |
 |
Quadrant C |
| Plot type | Count rate plots | Images |
|---|---|---|
| Comparison with Poisson distribution Blue bars denote a histogram of data divided into 1 sec bins. Red curve is a Poisson curve with rate = median count rate of data. |
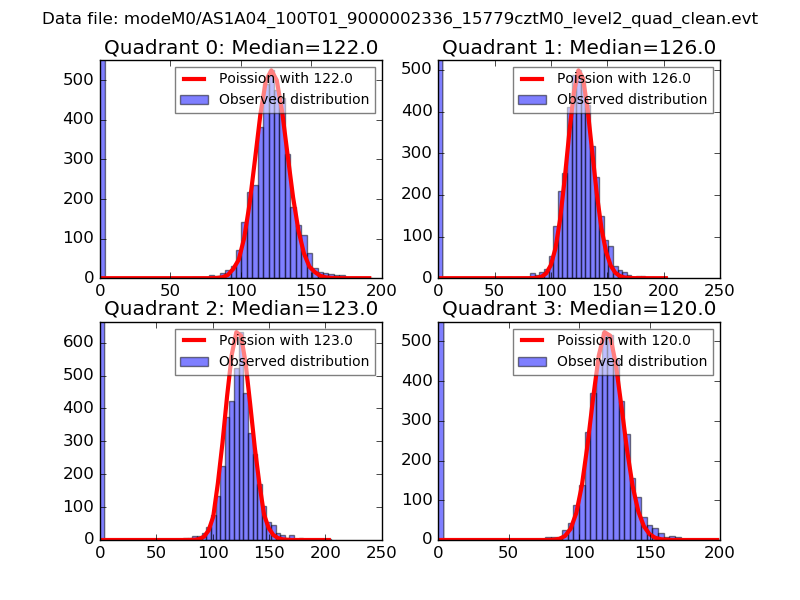 |
 |
| Quadrant-wise count rates Data is divided into 100 sec bins |
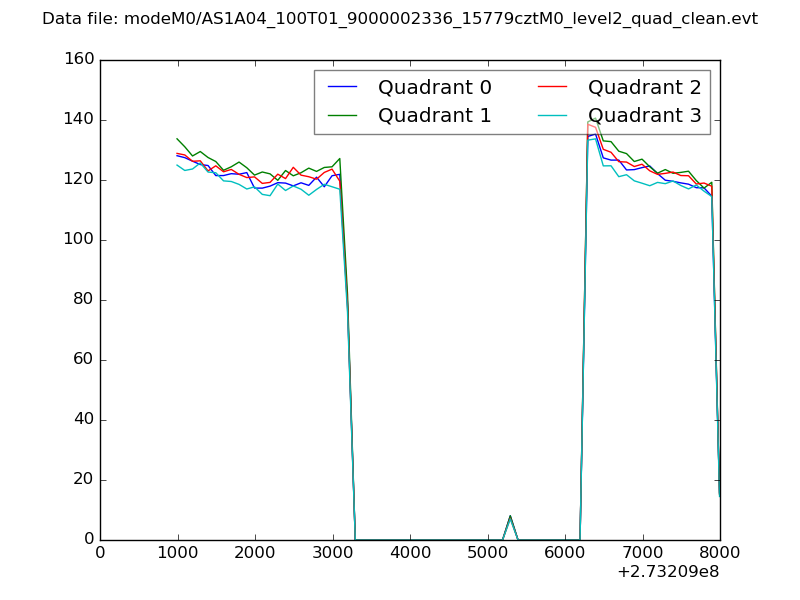 |
|
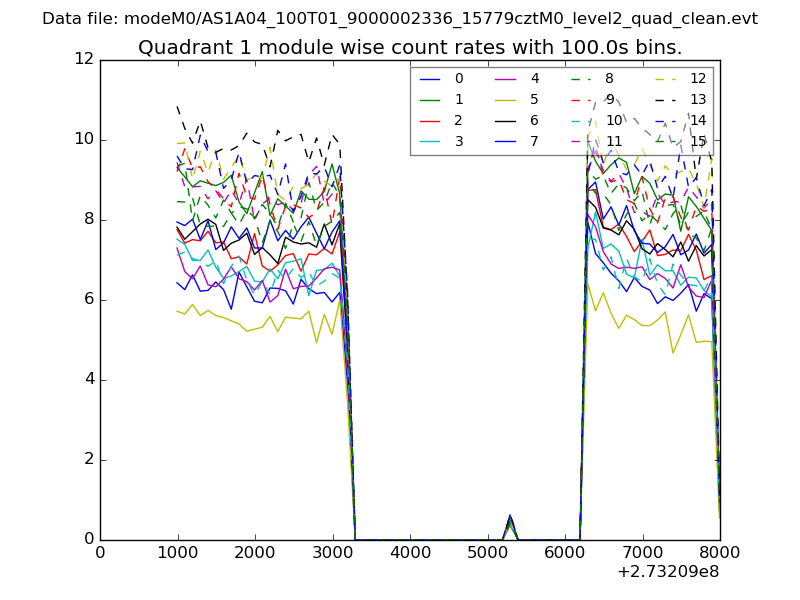
| Module-wise count rates for Quadrant A Data is divided into 100 sec bins |
 |
 |
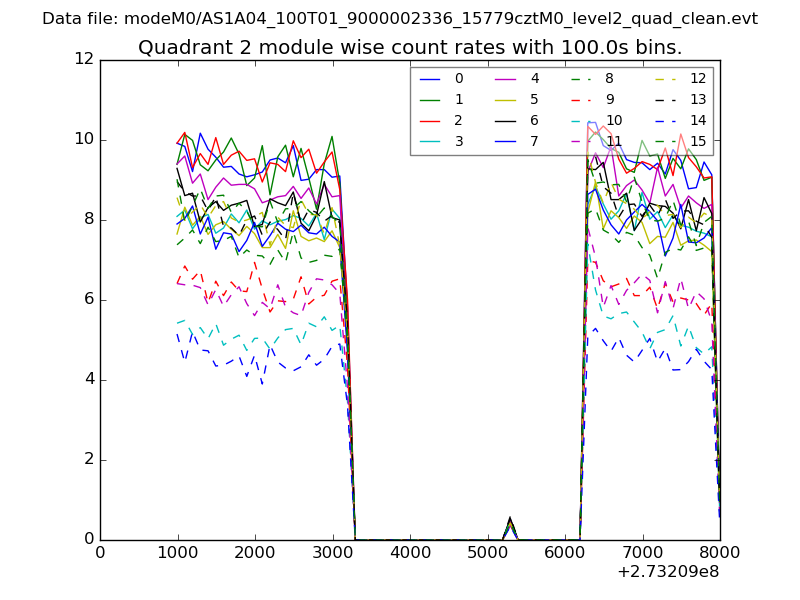
| Module-wise count rates for Quadrant B Data is divided into 100 sec bins |
 |
 |
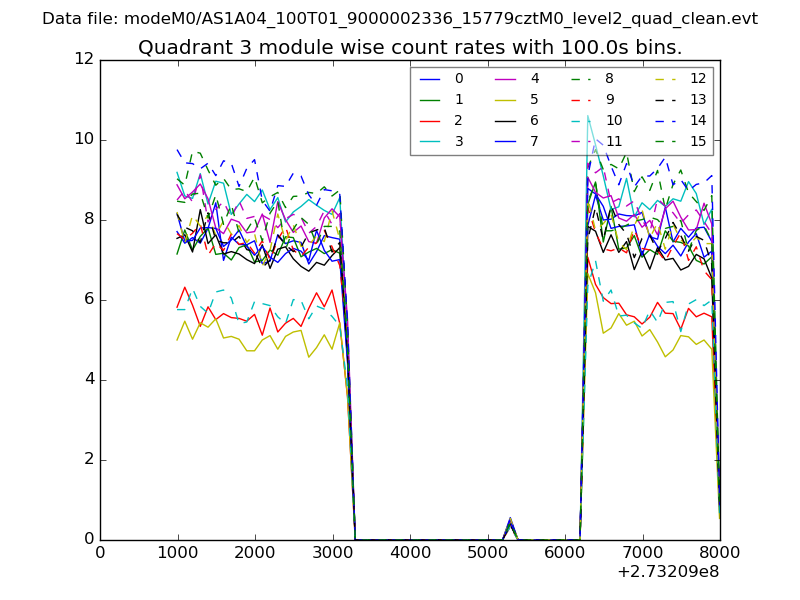
| Module-wise count rates for Quadrant C Data is divided into 100 sec bins |
 |
 |
| Module-wise count rates for Quadrant D Data is divided into 100 sec bins |
 |
 |
| Parameter | Plot |
|---|---|
| CZT HV Monitor |  |
| D_VDD | 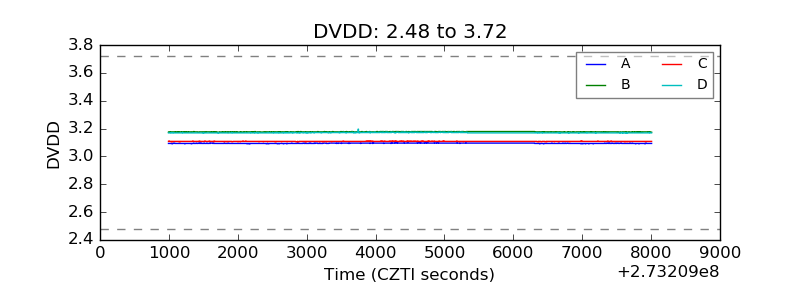 |
| Temperature 1 | 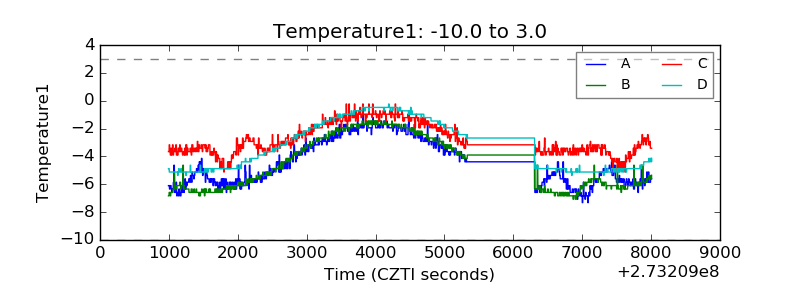 |
| Veto HV Monitor | 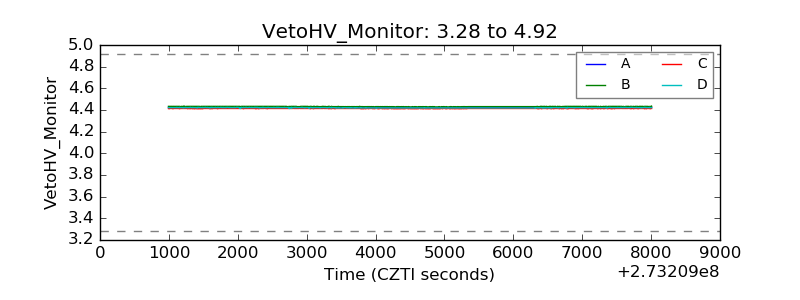 |
| Veto LLD | 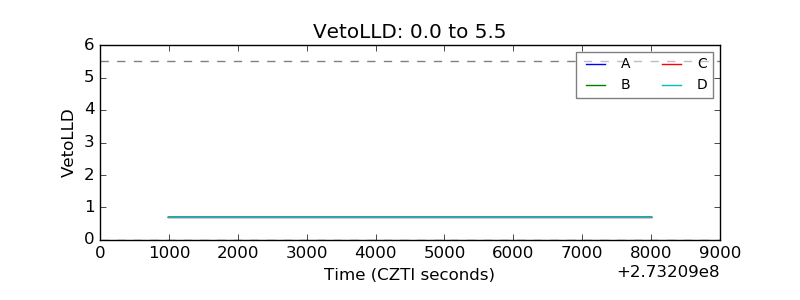 |
| Alpha Counter | 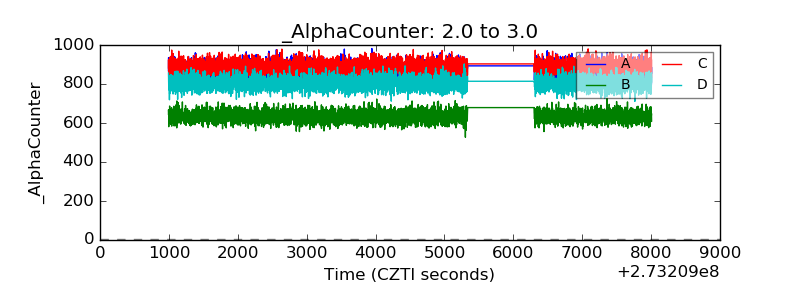 |
| _CPM_Rate | 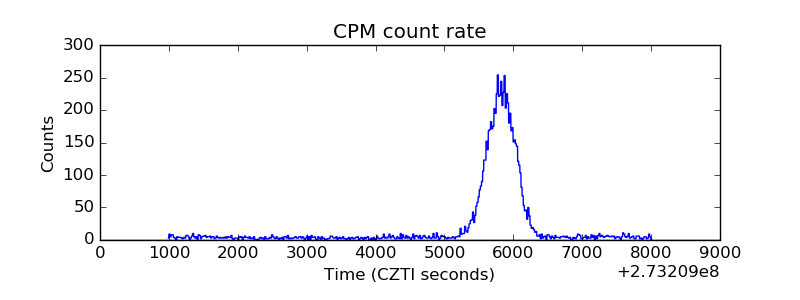 |
| CZT Counter | 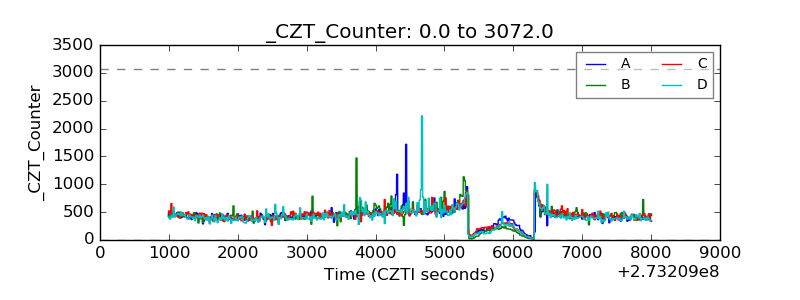 |
| +2.5 Volts monitor |  |
| +5 Volts monitor |  |
| _ROLL_ROT |  |
| _Roll_DEC | 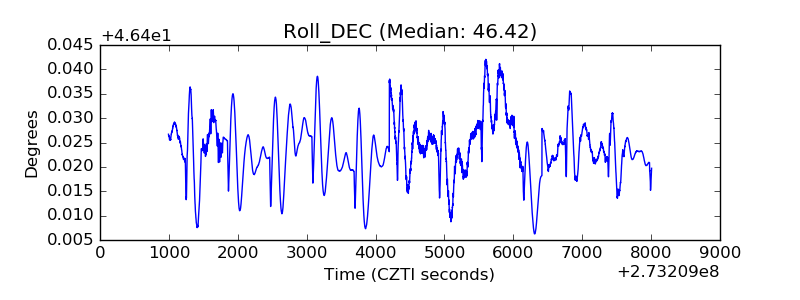 |
| _Roll_RA | 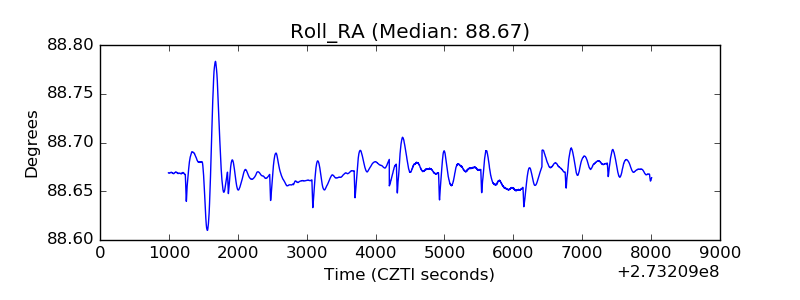 |
| Veto Counter | 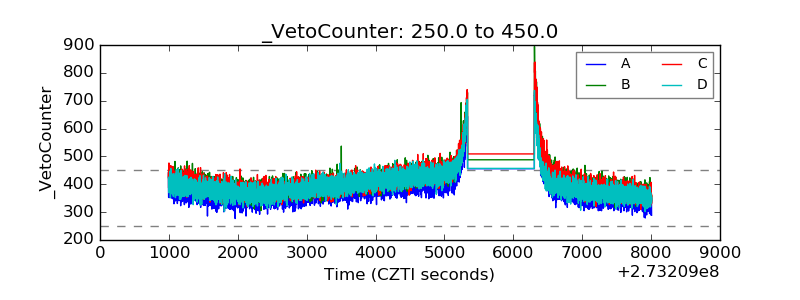 |