| Param | Original file | Final file |
|---|---|---|
| Filename | modeM0/AS1A04_100T01_9000002336_15780cztM0_level2.evt | modeM0/AS1A04_100T01_9000002336_15780cztM0_level2_quad_clean.evt |
| Size (bytes) | 409,841,280 | 85,821,120 |
| Size | 390.9 MB | 81.8 MB |
| Events in quadrant A | 2,930,842 | 533,956 |
| Events in quadrant B | 3,138,378 | 547,223 |
| Events in quadrant C | 2,968,879 | 537,469 |
| Events in quadrant D | 2,933,291 | 528,544 |
| Mode SS | |||
|---|---|---|---|
| Quadrant | BADHDUFLAG | Total packets | Discarded packets |
| A | 0 | 130 | 0 |
| B | 0 | 130 | 0 |
| C | 0 | 130 | 0 |
| D | 0 | 130 | 0 |
| Mode M0 | |||
|---|---|---|---|
| Quadrant | BADHDUFLAG | Total packets | Discarded packets |
| A | 0 | 13268 | 2 |
| B | 0 | 13717 | 1 |
| C | 0 | 13292 | 1 |
| D | 0 | 13472 | 1 |
| Mode M9 | |||
|---|---|---|---|
| Quadrant | BADHDUFLAG | Total packets | Discarded packets |
| A | 0 | 6 | 0 |
| B | 0 | 6 | 0 |
| C | 0 | 6 | 0 |
| D | 0 | 6 | 0 |
| Quadrant | Total seconds | Saturated seconds | Saturation percentage |
|---|---|---|---|
| A | 6479 | 47 | 0.725421% |
| B | 6479 | 65 | 1.003241% |
| C | 6479 | 71 | 1.095848% |
| D | 6479 | 30 | 0.463034% |
Noise dominated data is calculated using 1-second bins in cleaned event files. If a bin has >2000 counts, and if more than 50% of those come from <1% of pixels, then it is considered to be noise-dominated and hence unusable.
| Quadrant | # 1 sec bins | Bins with >0 counts | Bins with >2000 counts | High rate bins dominated by noise | Noise dominated (total time) | Noise dominated (detector-on time) | Marked lightcurve |
|---|---|---|---|---|---|---|---|
| A | 7060 | 6481 | 0 | 0 | 0.00% | 0.00% | 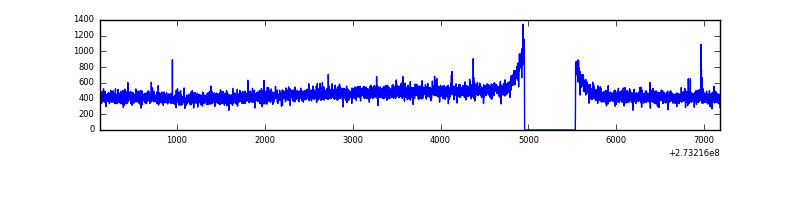 |
| B | 7060 | 6481 | 1 | 1 | 0.01% | 0.02% | 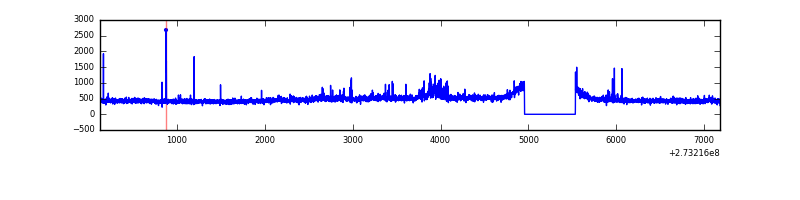 |
| C | 7060 | 6481 | 0 | 0 | 0.00% | 0.00% | 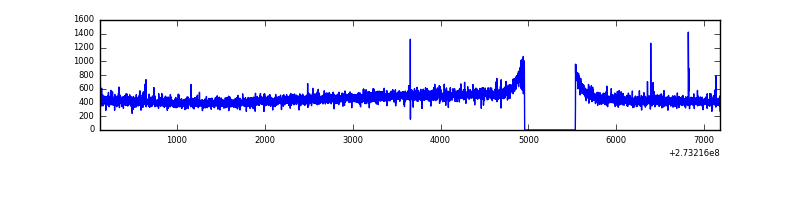 |
| D | 7060 | 6481 | 11 | 11 | 0.16% | 0.17% | 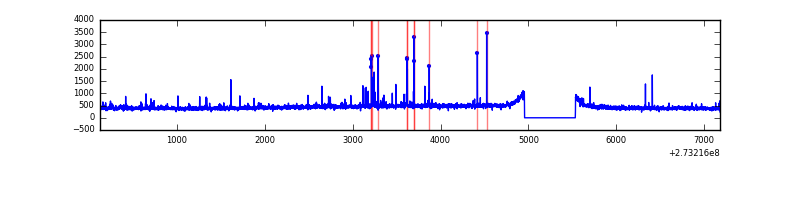 |
Top three noisy pixels from each quadrant. If the there are fewer than three noisy pixels in the level2.evt file, extra rows are filled as -1
| Pixel properties | Quadrant properties | ||||||
|---|---|---|---|---|---|---|---|
| Quadrant | DetID | PixID | Counts | Sigma | Mean | Median | Sigma |
| A | 0 | 226 | 6742 | 39.12 | 758 | 742 | 153.4 |
| A | 12 | 194 | 5652 | 32.01 | 758 | 742 | 153.4 |
| A | 15 | 69 | 5221 | 29.2 | 758 | 742 | 153.4 |
| B | 4 | 216 | 63188 | 424.7 | 760 | 741 | 147.0 |
| B | 3 | 209 | 40551 | 270.75 | 760 | 741 | 147.0 |
| B | 4 | 173 | 23302 | 153.44 | 760 | 741 | 147.0 |
| C | 14 | 238 | 112255 | 651.42 | 727 | 733 | 171.2 |
| C | 10 | 22 | 6008 | 30.81 | 727 | 733 | 171.2 |
| C | 13 | 61 | 5230 | 26.27 | 727 | 733 | 171.2 |
| D | 2 | 14 | 51696 | 260.62 | 732 | 717 | 195.6 |
| D | 1 | 52 | 45535 | 229.12 | 732 | 717 | 195.6 |
| D | 2 | 234 | 26387 | 131.23 | 732 | 717 | 195.6 |
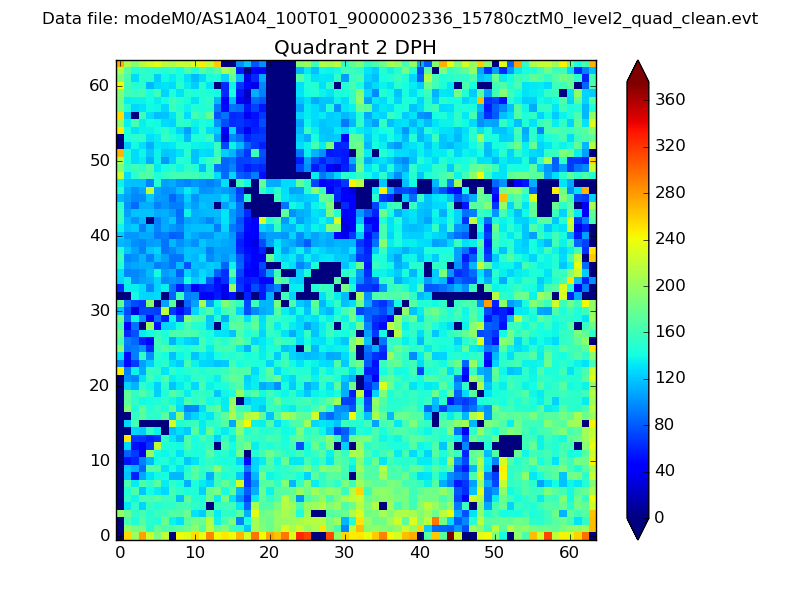
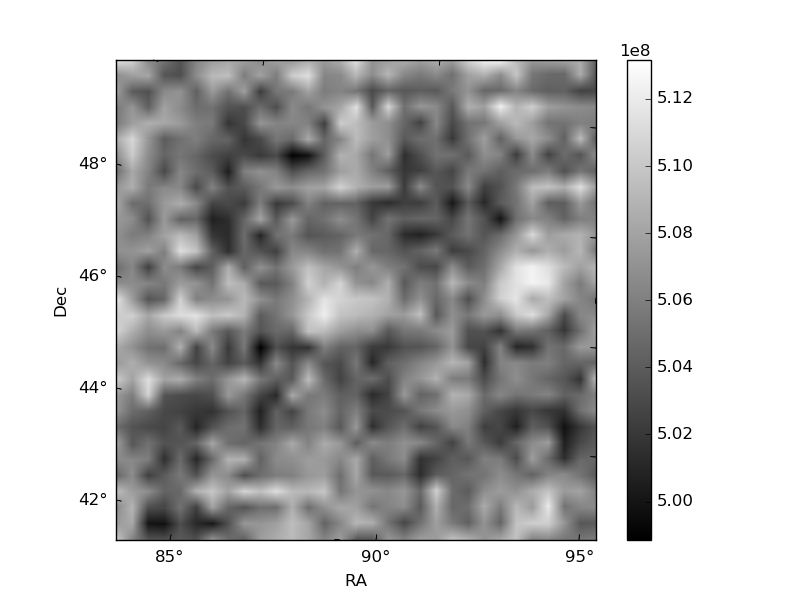
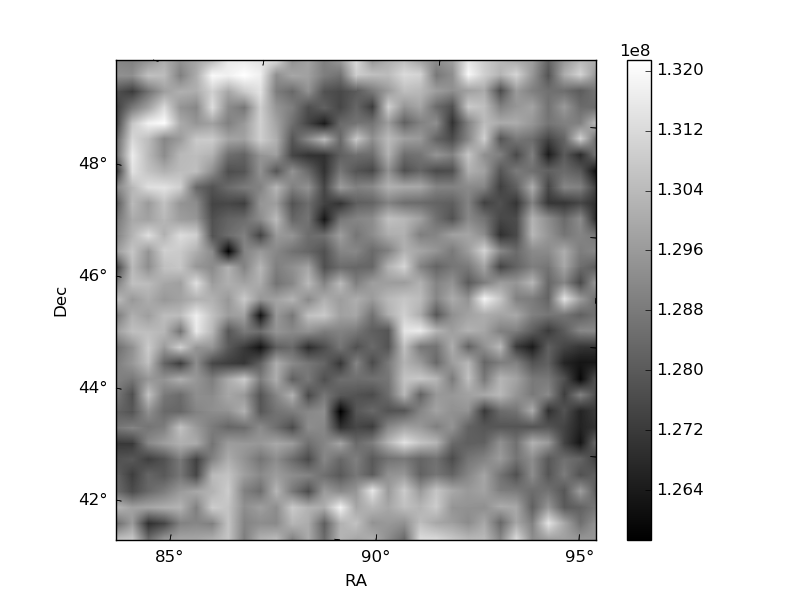
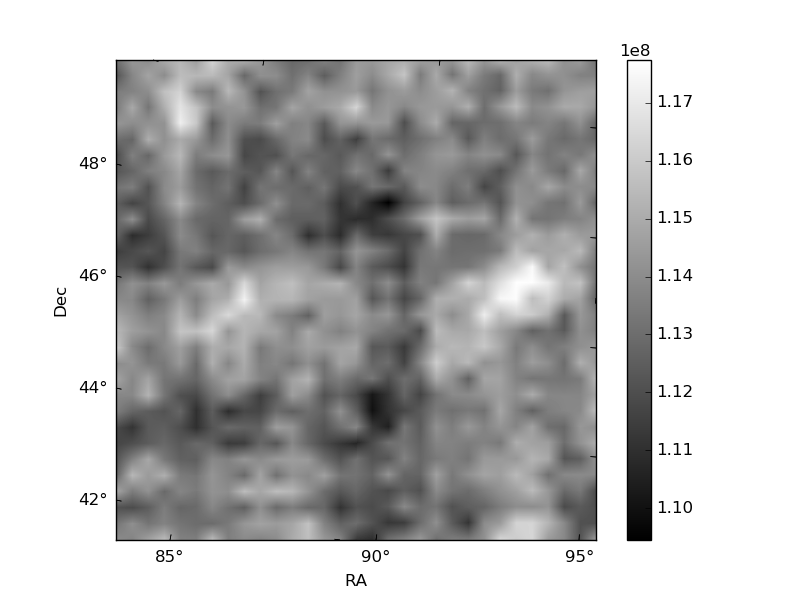
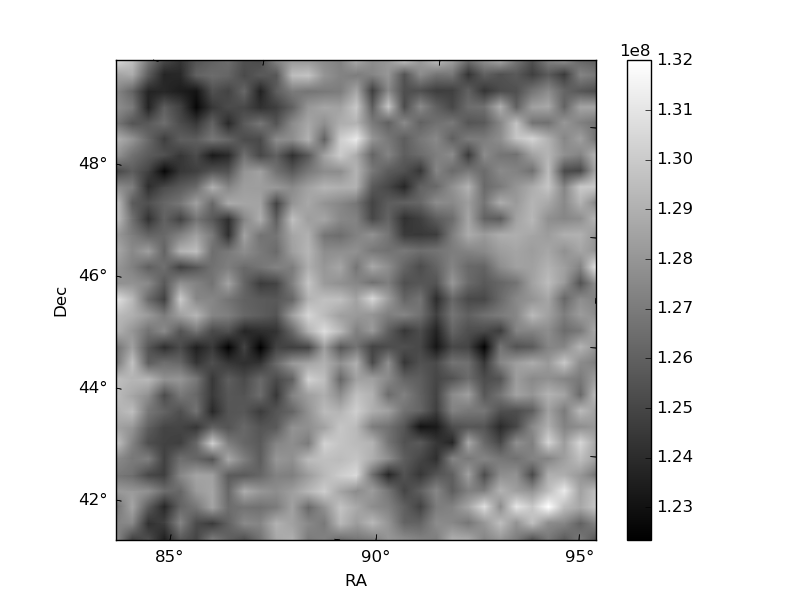
Histogram calculated using DETX and DETY for each event in the final _common_clean file
| Quadrant A | 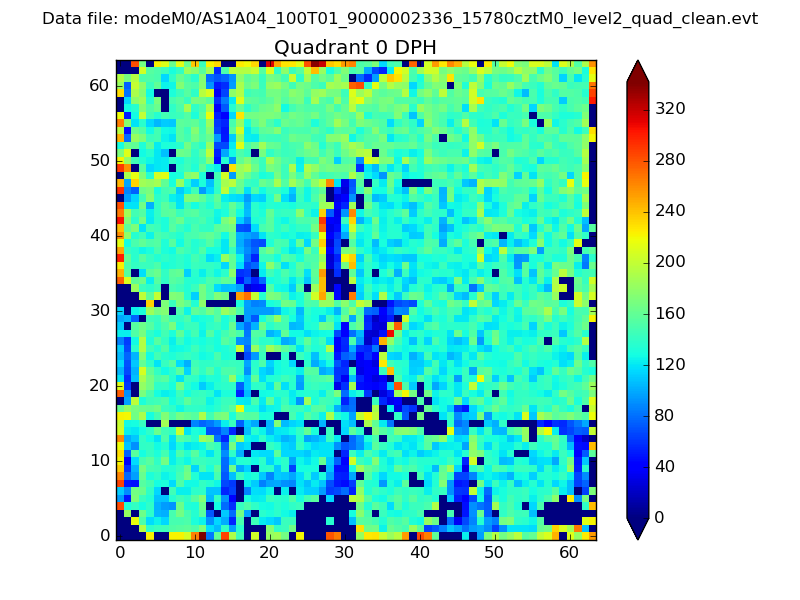 |
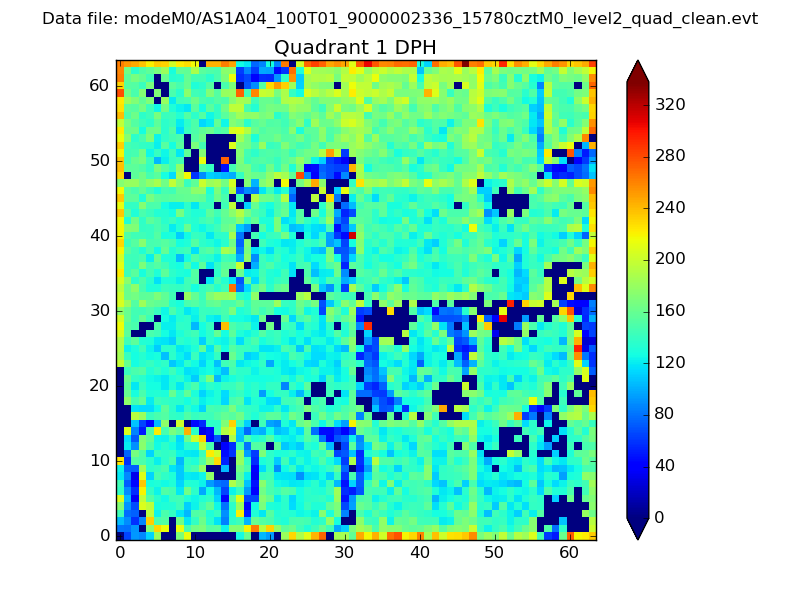 |
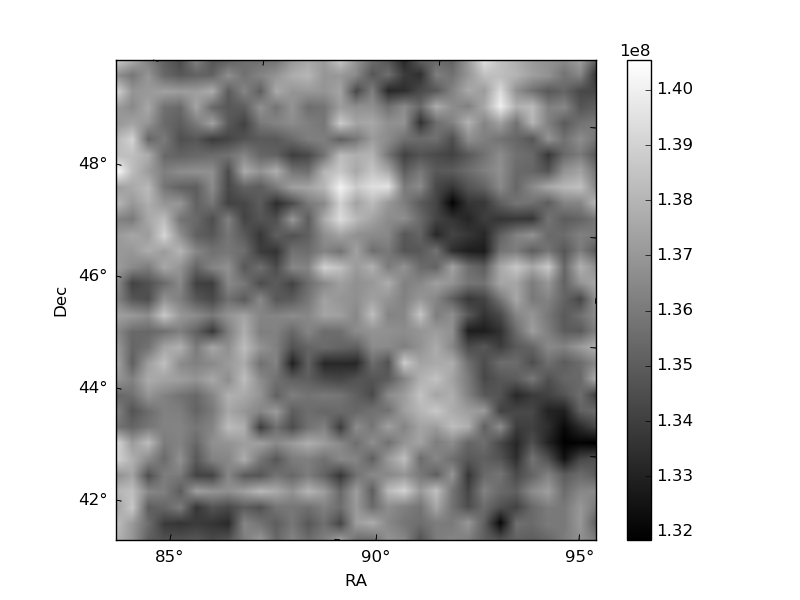
Quadrant B |
|---|---|---|---|
| Quadrant D | 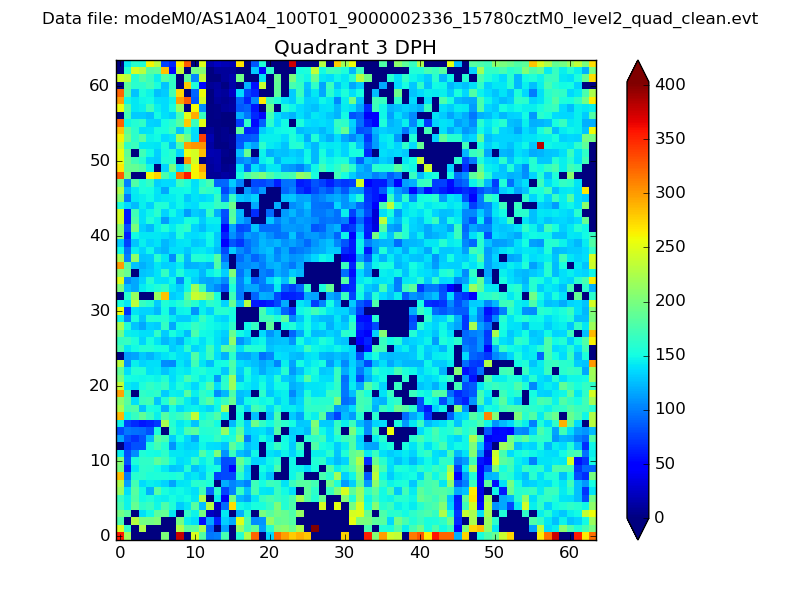 |
 |
Quadrant C |
| Plot type | Count rate plots | Images |
|---|---|---|
| Comparison with Poisson distribution Blue bars denote a histogram of data divided into 1 sec bins. Red curve is a Poisson curve with rate = median count rate of data. |
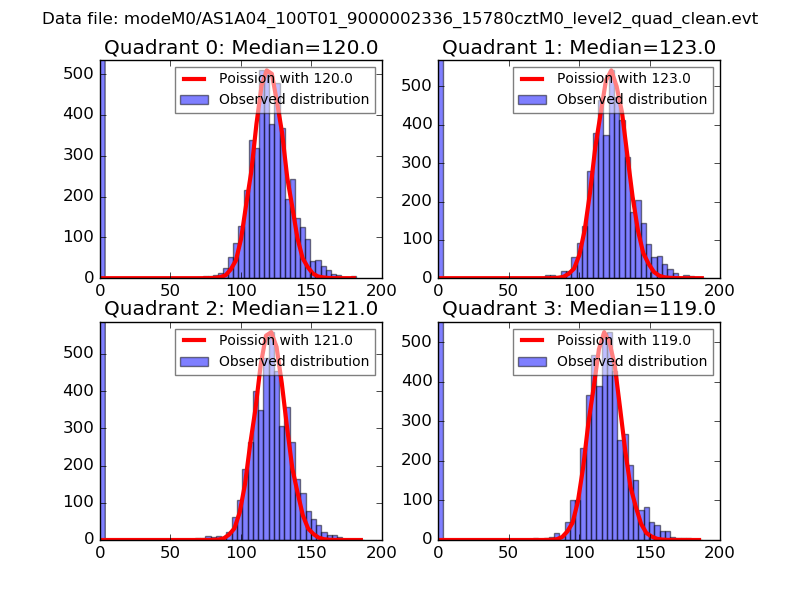 |
 |
| Quadrant-wise count rates Data is divided into 100 sec bins |
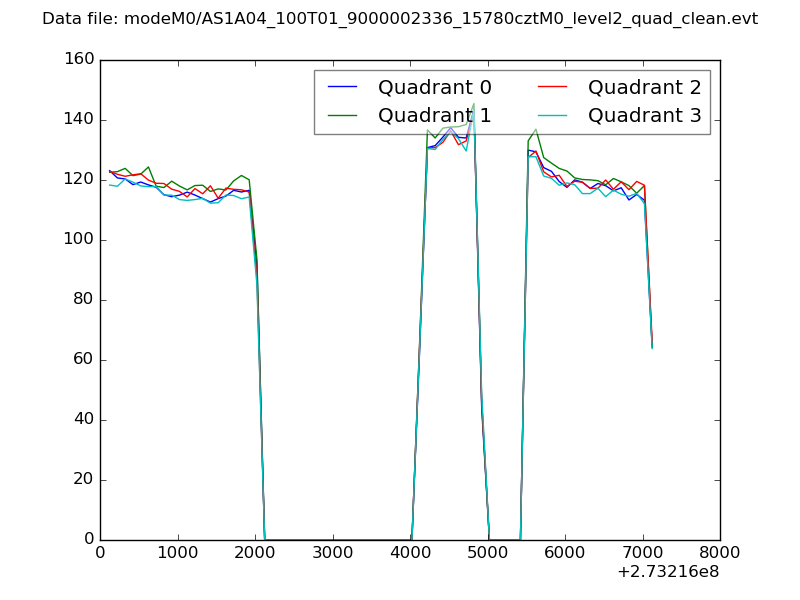 |
|
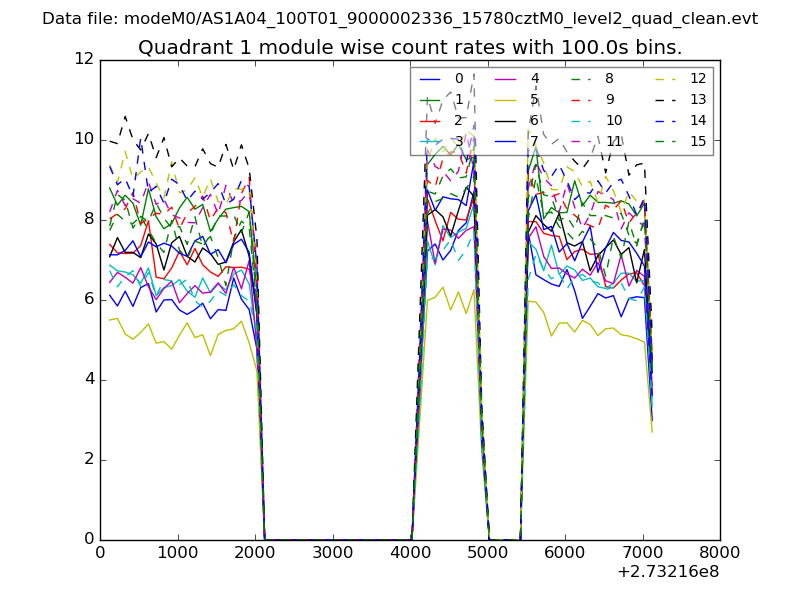
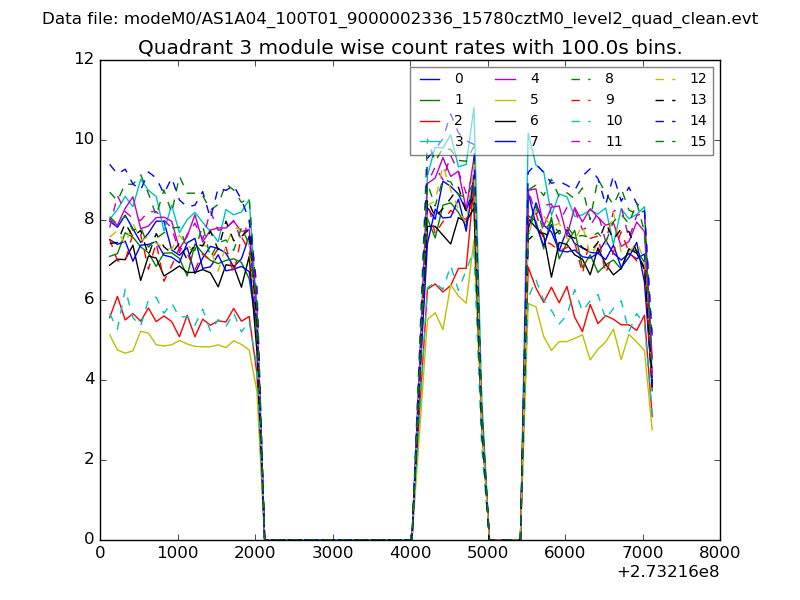
| Module-wise count rates for Quadrant A Data is divided into 100 sec bins |
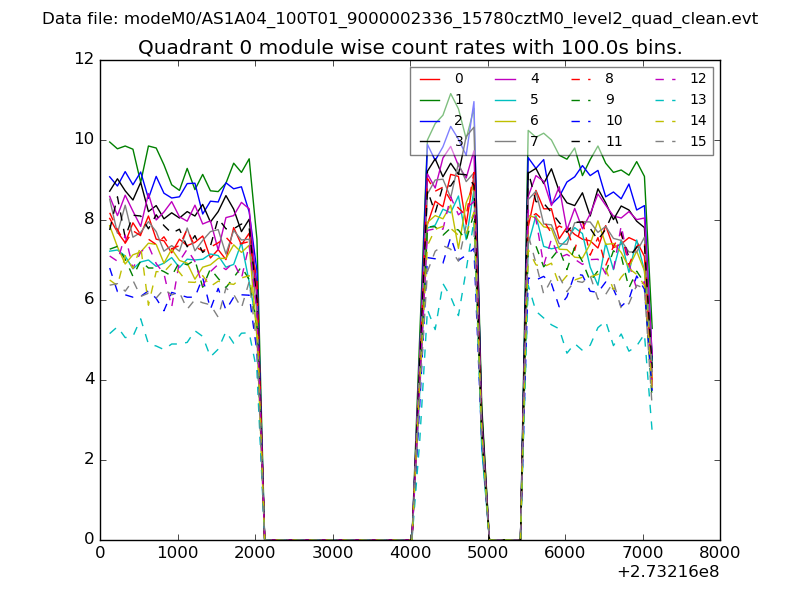 |
 |
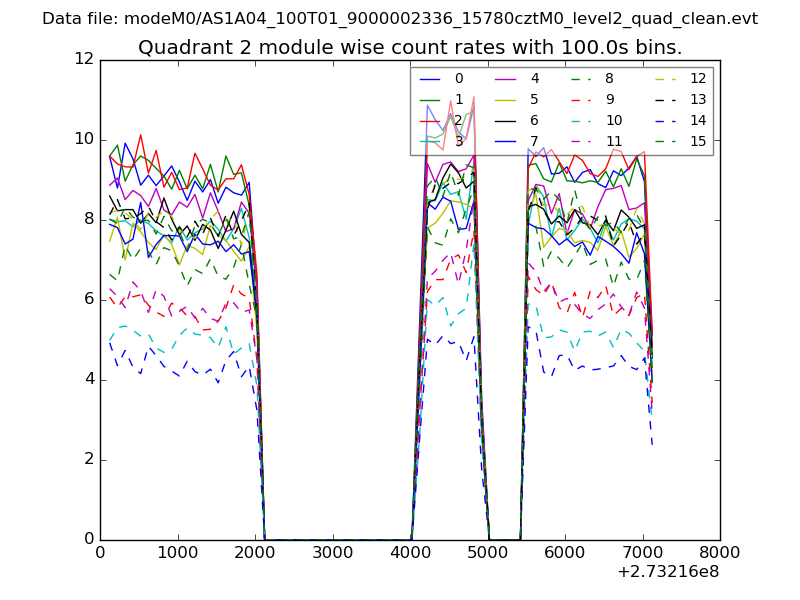
| Module-wise count rates for Quadrant B Data is divided into 100 sec bins |
 |
 |
| Module-wise count rates for Quadrant C Data is divided into 100 sec bins |
 |
 |
| Module-wise count rates for Quadrant D Data is divided into 100 sec bins |
 |
 |
| Parameter | Plot |
|---|---|
| CZT HV Monitor | 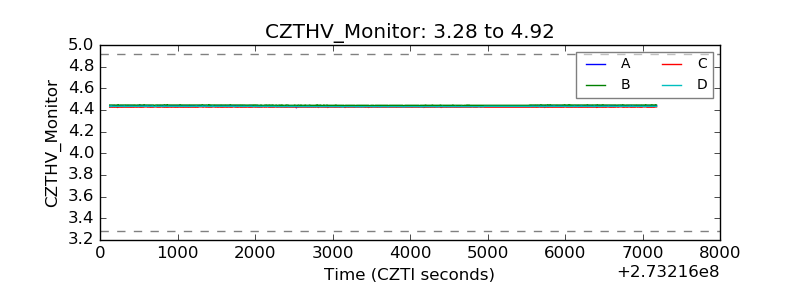 |
| D_VDD | 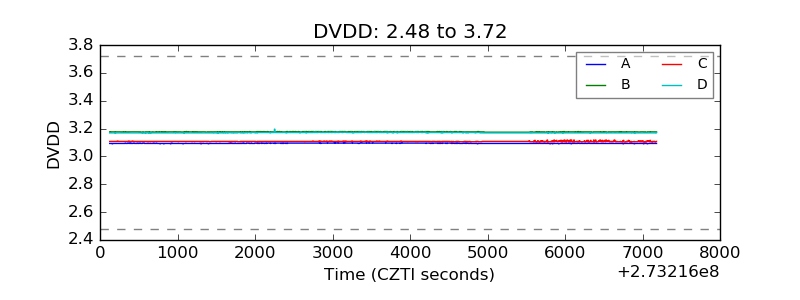 |
| Temperature 1 |  |
| Veto HV Monitor | 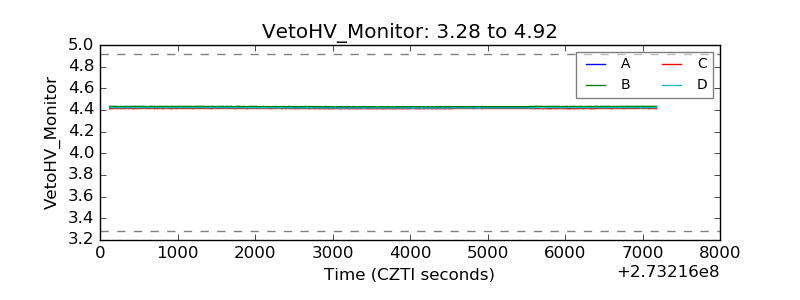 |
| Veto LLD | 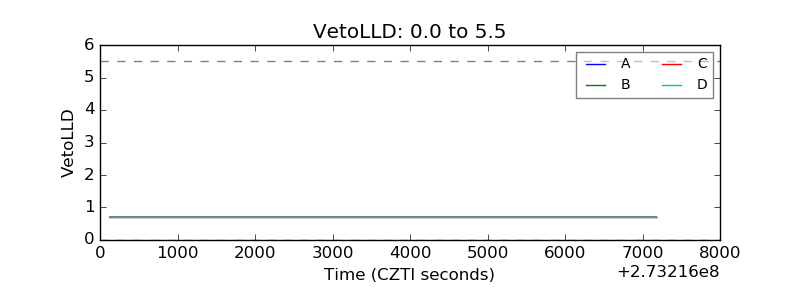 |
| Alpha Counter | 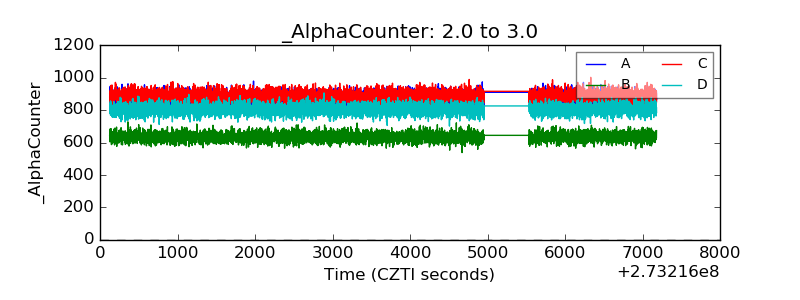 |
| _CPM_Rate | 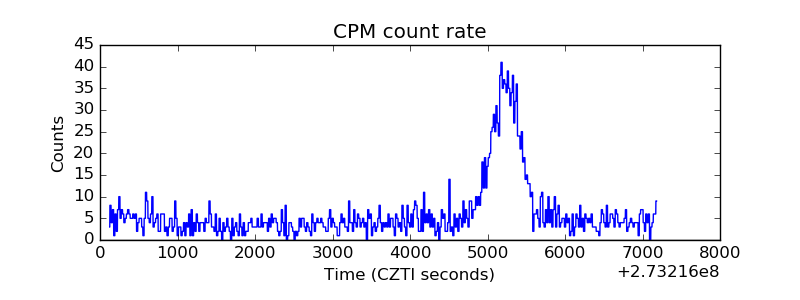 |
| CZT Counter | 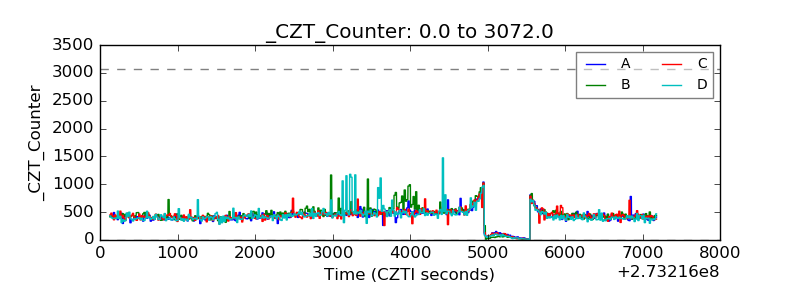 |
| +2.5 Volts monitor | 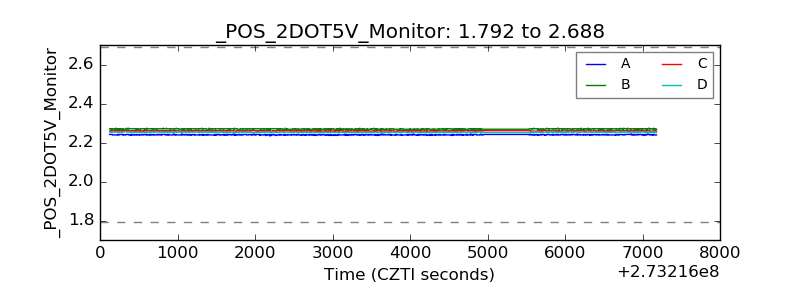 |
| +5 Volts monitor | 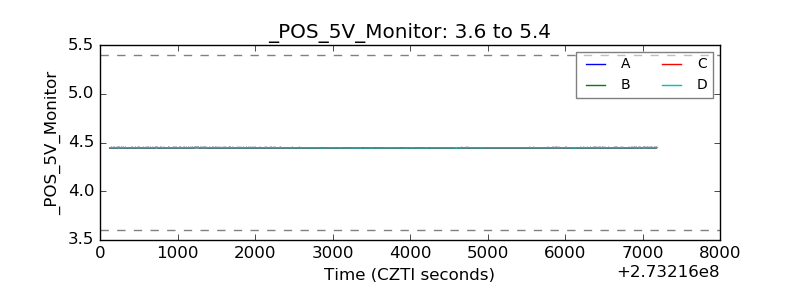 |
| _ROLL_ROT | 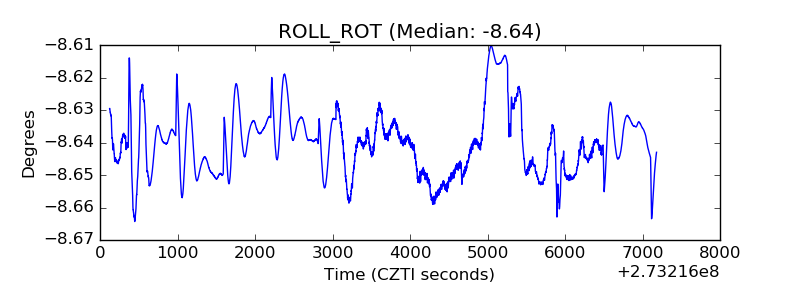 |
| _Roll_DEC | 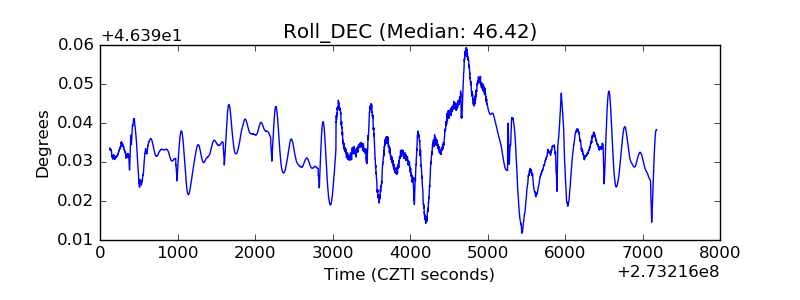 |
| _Roll_RA | 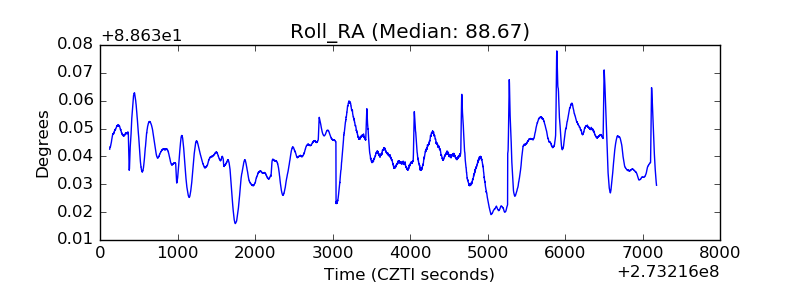 |
| Veto Counter | 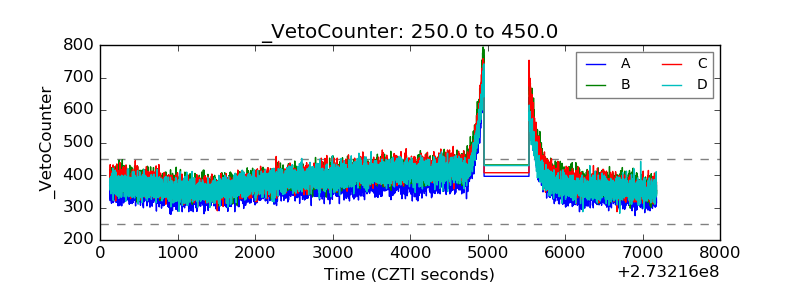 |