| Param | Original file | Final file |
|---|---|---|
| Filename | modeM0/AS1A04_100T01_9000002336_15781cztM0_level2.evt | modeM0/AS1A04_100T01_9000002336_15781cztM0_level2_quad_clean.evt |
| Size (bytes) | 456,315,840 | 95,330,880 |
| Size | 435.2 MB | 90.9 MB |
| Events in quadrant A | 3,265,966 | 595,137 |
| Events in quadrant B | 3,400,149 | 612,412 |
| Events in quadrant C | 3,299,093 | 603,714 |
| Events in quadrant D | 3,377,276 | 587,033 |
| Mode SS | |||
|---|---|---|---|
| Quadrant | BADHDUFLAG | Total packets | Discarded packets |
| A | 0 | 140 | 0 |
| B | 0 | 140 | 0 |
| C | 0 | 140 | 0 |
| D | 0 | 140 | 0 |
| Mode M0 | |||
|---|---|---|---|
| Quadrant | BADHDUFLAG | Total packets | Discarded packets |
| A | 0 | 14605 | 3 |
| B | 0 | 14810 | 2 |
| C | 0 | 14533 | 2 |
| D | 0 | 15080 | 2 |
| Quadrant | Total seconds | Saturated seconds | Saturation percentage |
|---|---|---|---|
| A | 7011 | 259 | 3.694195% |
| B | 7011 | 250 | 3.565825% |
| C | 7011 | 238 | 3.394666% |
| D | 7011 | 249 | 3.551562% |
Noise dominated data is calculated using 1-second bins in cleaned event files. If a bin has >2000 counts, and if more than 50% of those come from <1% of pixels, then it is considered to be noise-dominated and hence unusable.
| Quadrant | # 1 sec bins | Bins with >0 counts | Bins with >2000 counts | High rate bins dominated by noise | Noise dominated (total time) | Noise dominated (detector-on time) | Marked lightcurve |
|---|---|---|---|---|---|---|---|
| A | 7062 | 7014 | 1 | 1 | 0.01% | 0.01% | 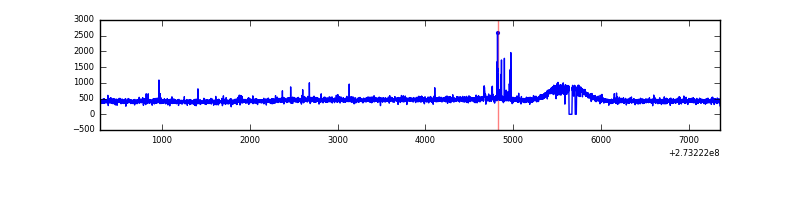 |
| B | 7062 | 7014 | 7 | 7 | 0.10% | 0.10% | 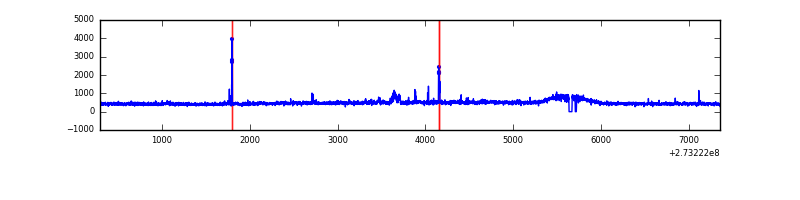 |
| C | 7062 | 7014 | 0 | 0 | 0.00% | 0.00% | 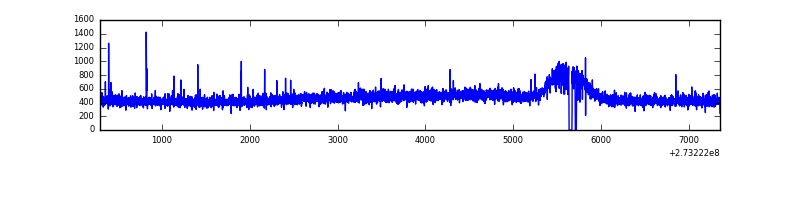 |
| D | 7062 | 7014 | 39 | 39 | 0.55% | 0.56% | 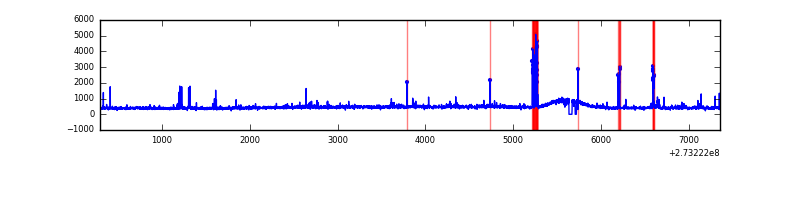 |
Top three noisy pixels from each quadrant. If the there are fewer than three noisy pixels in the level2.evt file, extra rows are filled as -1
| Pixel properties | Quadrant properties | ||||||
|---|---|---|---|---|---|---|---|
| Quadrant | DetID | PixID | Counts | Sigma | Mean | Median | Sigma |
| A | 15 | 239 | 30212 | 169.96 | 837 | 816 | 173.0 |
| A | 15 | 157 | 10916 | 58.4 | 837 | 816 | 173.0 |
| A | 0 | 226 | 7574 | 39.07 | 837 | 816 | 173.0 |
| B | 3 | 209 | 55286 | 333.58 | 836 | 811 | 163.3 |
| B | 4 | 216 | 36561 | 218.92 | 836 | 811 | 163.3 |
| B | 12 | 111 | 18904 | 110.79 | 836 | 811 | 163.3 |
| C | 14 | 238 | 123703 | 650.41 | 802 | 807 | 189.0 |
| C | 8 | 128 | 11474 | 56.45 | 802 | 807 | 189.0 |
| C | 10 | 22 | 8934 | 43.01 | 802 | 807 | 189.0 |
| D | 5 | 51 | 147335 | 734.03 | 816 | 791 | 199.6 |
| D | 1 | 52 | 45678 | 224.84 | 816 | 791 | 199.6 |
| D | 2 | 14 | 39267 | 192.72 | 816 | 791 | 199.6 |
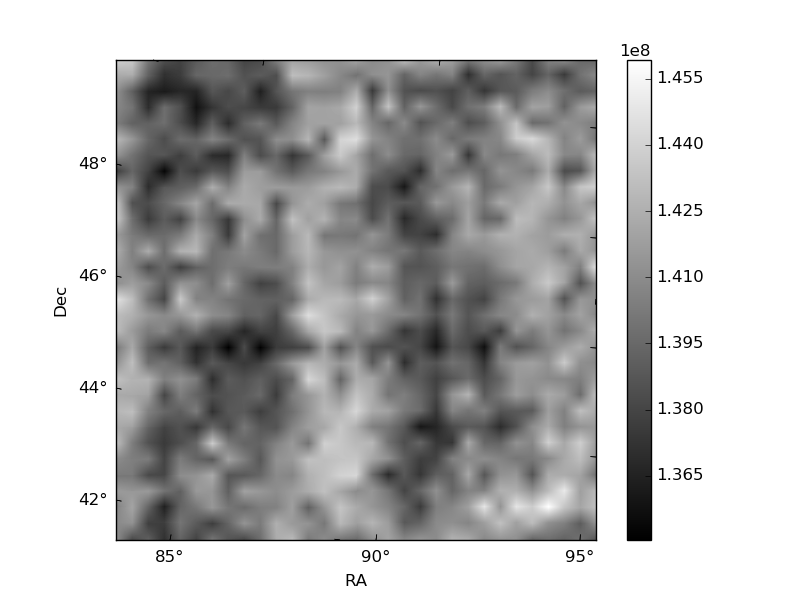
Histogram calculated using DETX and DETY for each event in the final _common_clean file
| Quadrant A | 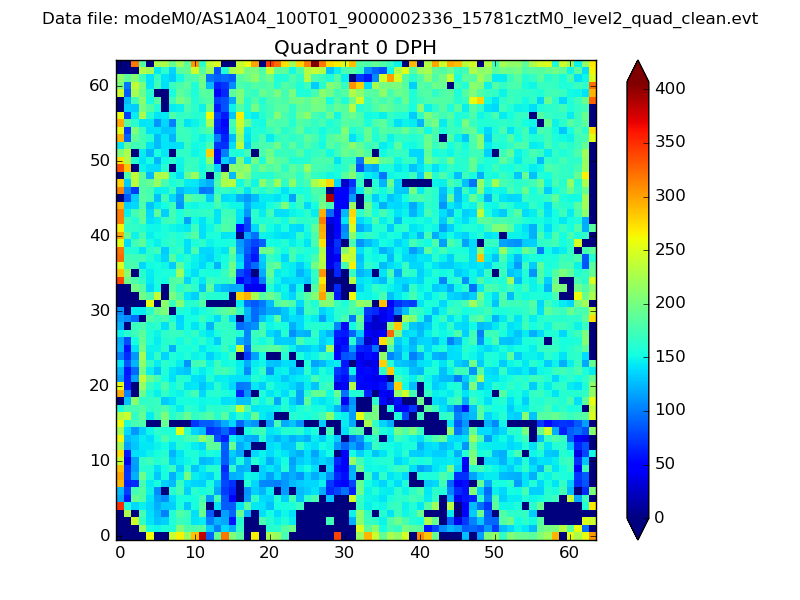 |
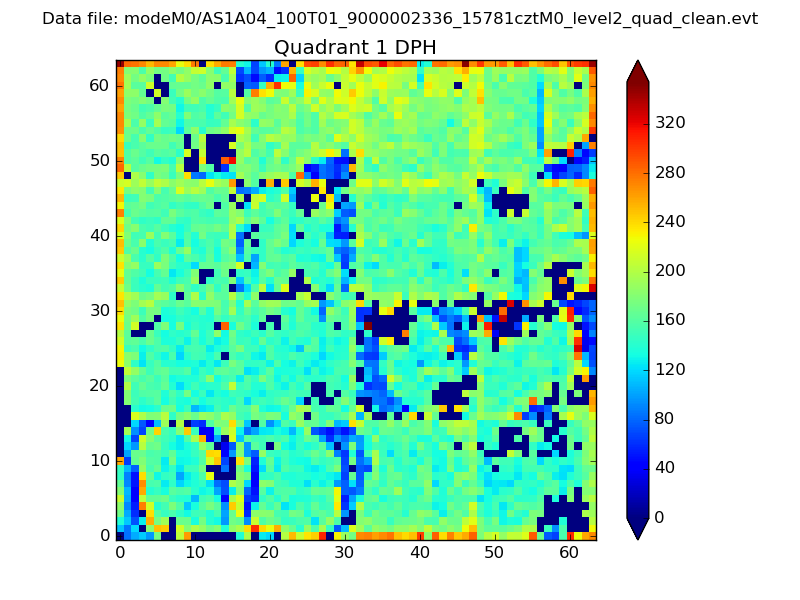 |
Quadrant B |
|---|---|---|---|
| Quadrant D | 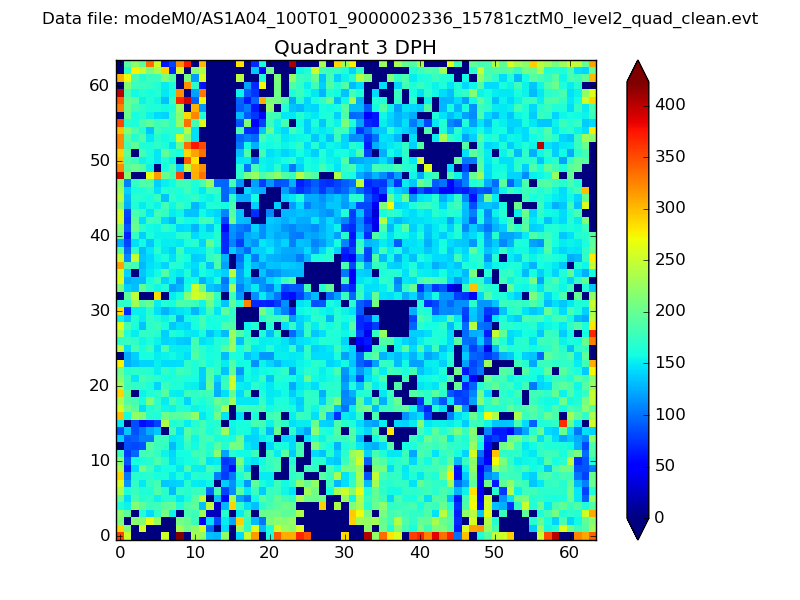 |
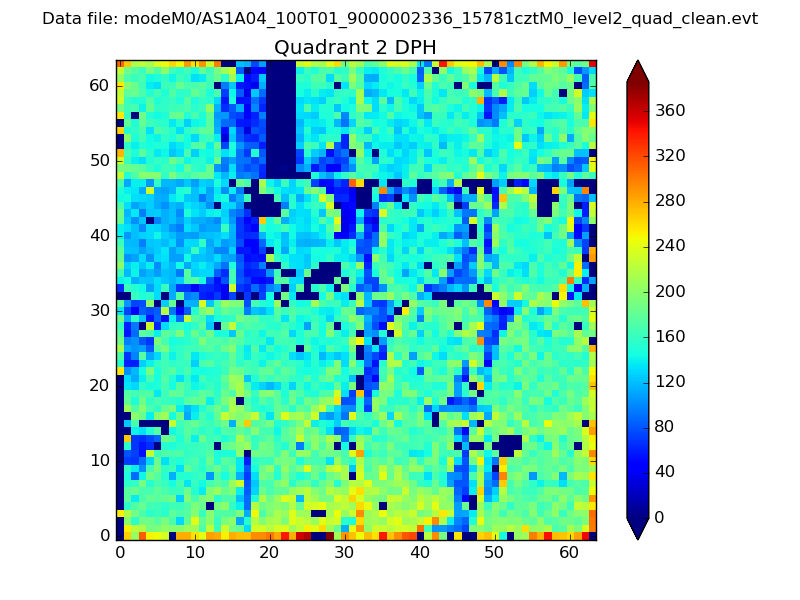 |
Quadrant C |
| Plot type | Count rate plots | Images |
|---|---|---|
| Comparison with Poisson distribution Blue bars denote a histogram of data divided into 1 sec bins. Red curve is a Poisson curve with rate = median count rate of data. |
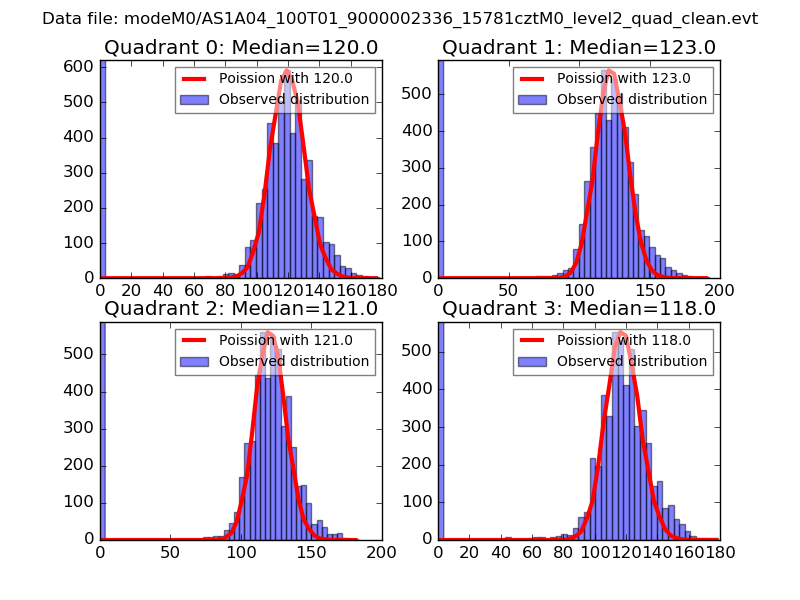 |
 |
| Quadrant-wise count rates Data is divided into 100 sec bins |
 |
|
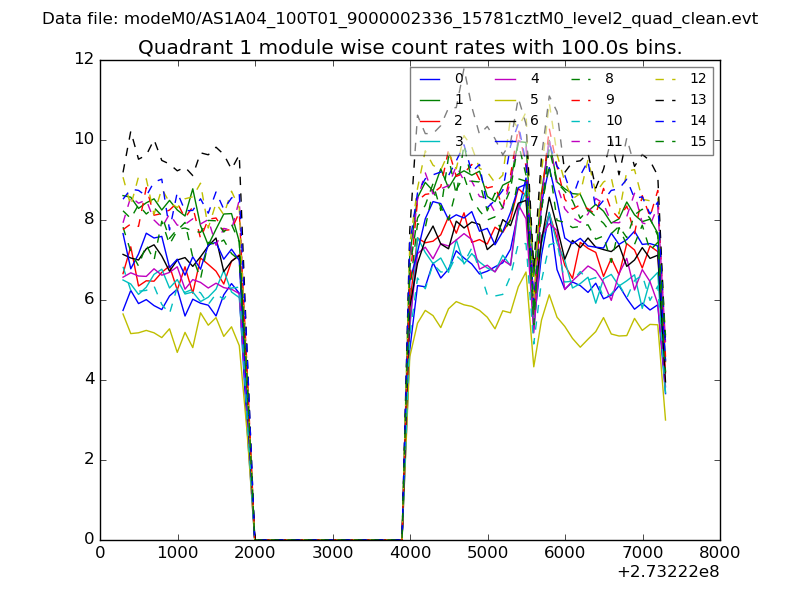
| Module-wise count rates for Quadrant A Data is divided into 100 sec bins |
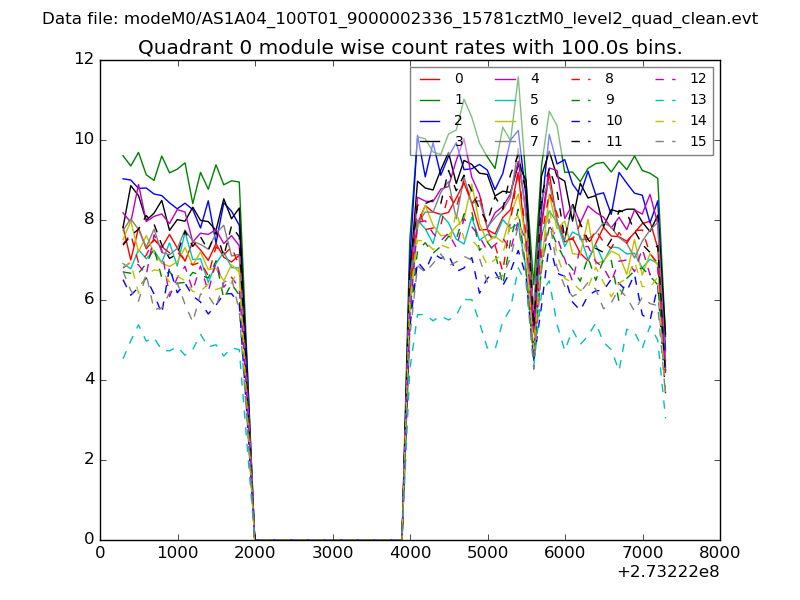 |
 |
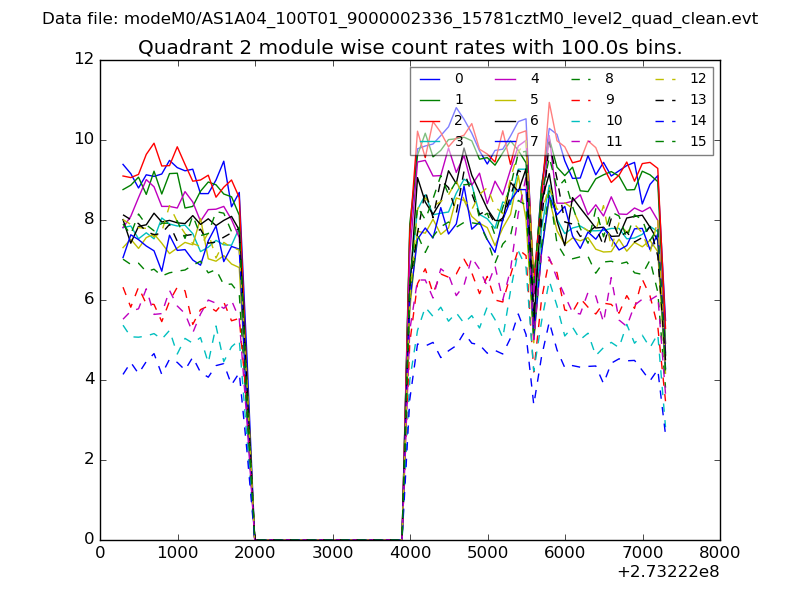
| Module-wise count rates for Quadrant B Data is divided into 100 sec bins |
 |
 |
| Module-wise count rates for Quadrant C Data is divided into 100 sec bins |
 |
 |
| Module-wise count rates for Quadrant D Data is divided into 100 sec bins |
 |
 |
| Parameter | Plot |
|---|---|
| CZT HV Monitor | 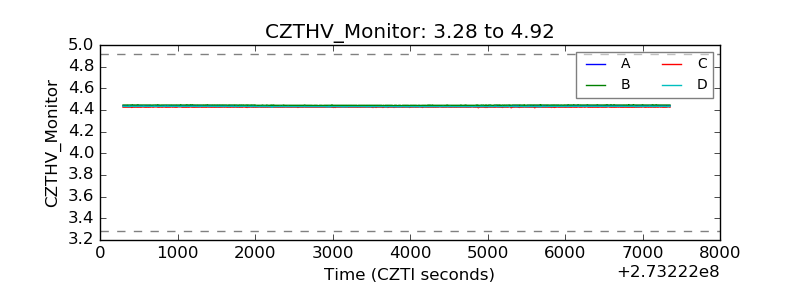 |
| D_VDD | 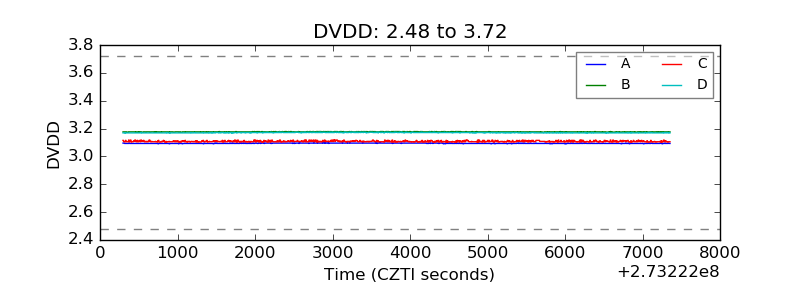 |
| Temperature 1 | 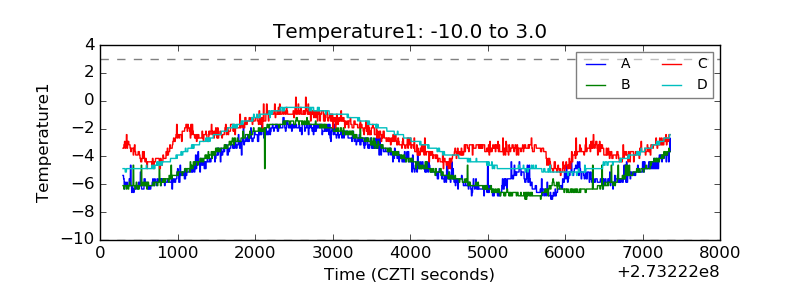 |
| Veto HV Monitor | 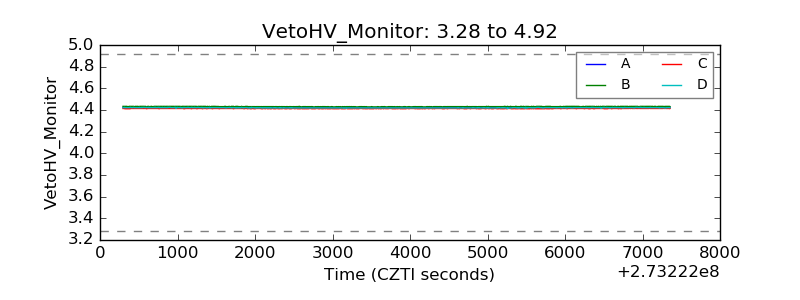 |
| Veto LLD | 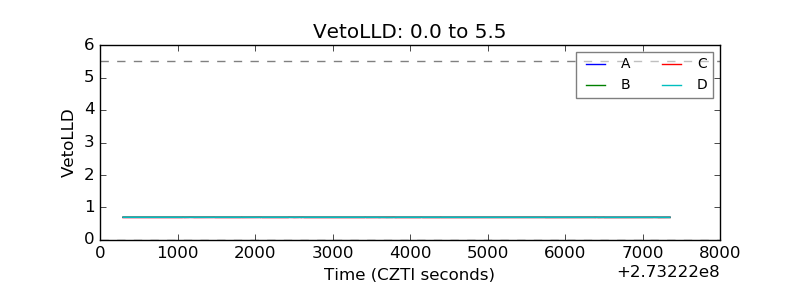 |
| Alpha Counter | 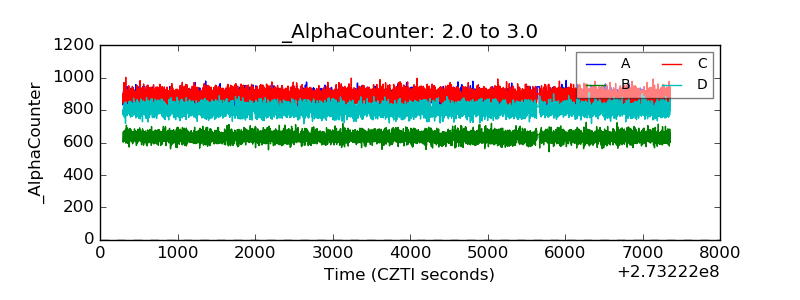 |
| _CPM_Rate | 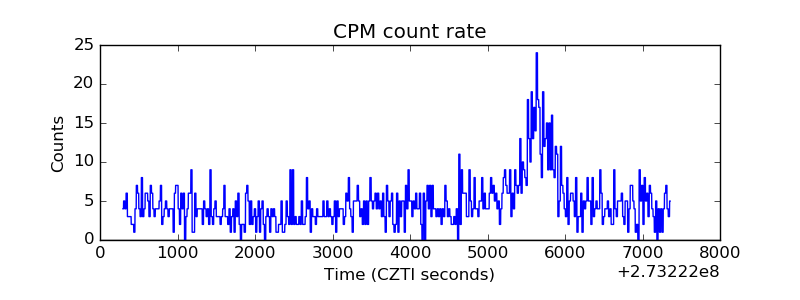 |
| CZT Counter | 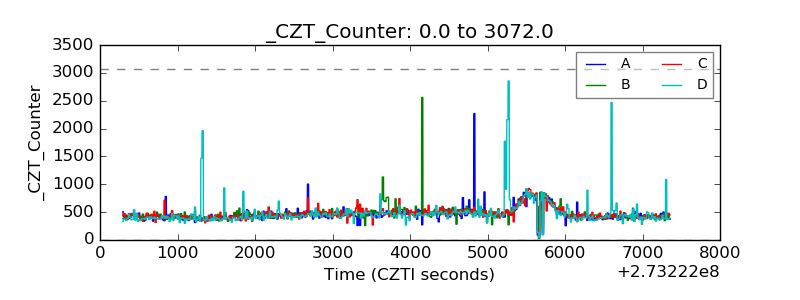 |
| +2.5 Volts monitor |  |
| +5 Volts monitor |  |
| _ROLL_ROT |  |
| _Roll_DEC | 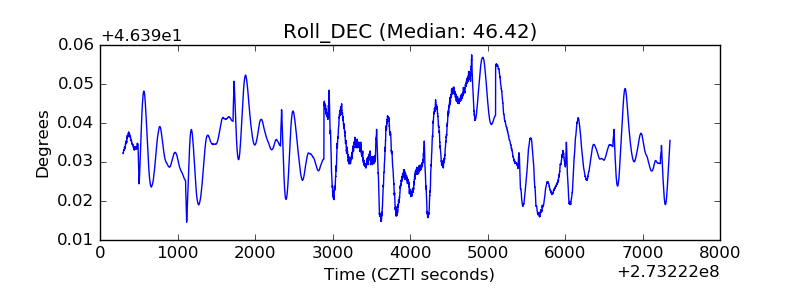 |
| _Roll_RA | 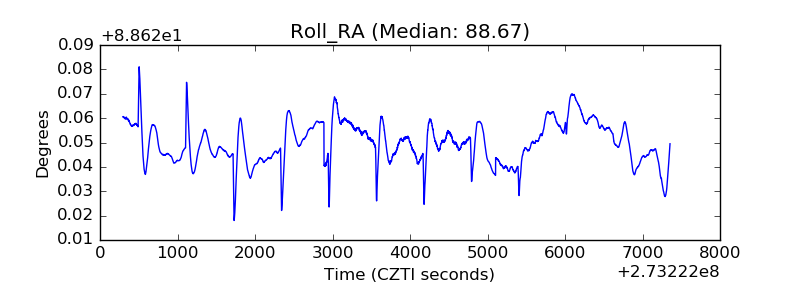 |
| Veto Counter | 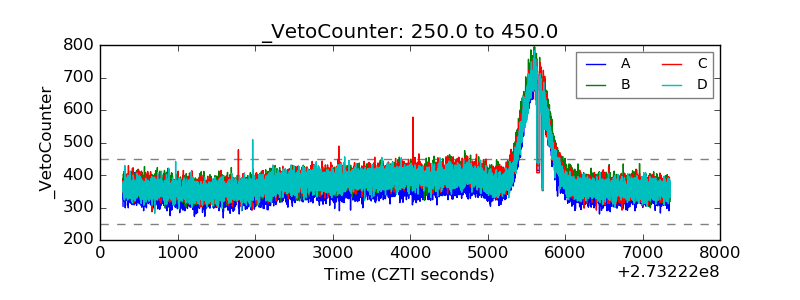 |