| Param | Original file | Final file |
|---|---|---|
| Filename | modeM0/AS1A04_100T01_9000002336_15782cztM0_level2.evt | modeM0/AS1A04_100T01_9000002336_15782cztM0_level2_quad_clean.evt |
| Size (bytes) | 452,174,400 | 95,722,560 |
| Size | 431.2 MB | 91.3 MB |
| Events in quadrant A | 3,207,223 | 598,339 |
| Events in quadrant B | 3,482,871 | 614,307 |
| Events in quadrant C | 3,247,087 | 602,974 |
| Events in quadrant D | 3,276,287 | 591,032 |
| Mode SS | |||
|---|---|---|---|
| Quadrant | BADHDUFLAG | Total packets | Discarded packets |
| A | 0 | 144 | 0 |
| B | 0 | 144 | 0 |
| C | 0 | 144 | 0 |
| D | 0 | 144 | 0 |
| Mode M0 | |||
|---|---|---|---|
| Quadrant | BADHDUFLAG | Total packets | Discarded packets |
| A | 0 | 14460 | 2 |
| B | 0 | 15064 | 1 |
| C | 0 | 14426 | 1 |
| D | 0 | 14777 | 1 |
| Mode M9 | |||
|---|---|---|---|
| Quadrant | BADHDUFLAG | Total packets | Discarded packets |
| A | 0 | 2 | 0 |
| B | 0 | 2 | 0 |
| C | 0 | 2 | 0 |
| D | 0 | 2 | 0 |
| Quadrant | Total seconds | Saturated seconds | Saturation percentage |
|---|---|---|---|
| A | 7062 | 155 | 2.194846% |
| B | 7062 | 166 | 2.350609% |
| C | 7062 | 166 | 2.350609% |
| D | 7062 | 126 | 1.784197% |
Noise dominated data is calculated using 1-second bins in cleaned event files. If a bin has >2000 counts, and if more than 50% of those come from <1% of pixels, then it is considered to be noise-dominated and hence unusable.
| Quadrant | # 1 sec bins | Bins with >0 counts | Bins with >2000 counts | High rate bins dominated by noise | Noise dominated (total time) | Noise dominated (detector-on time) | Marked lightcurve |
|---|---|---|---|---|---|---|---|
| A | 7248 | 7065 | 0 | 0 | 0.00% | 0.00% | 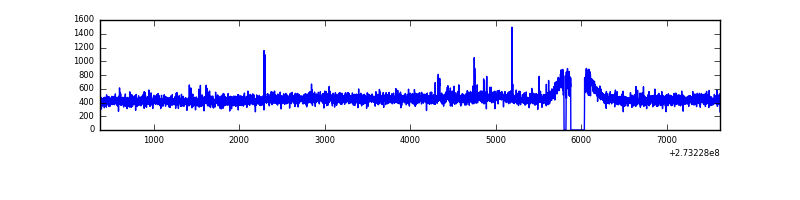 |
| B | 7248 | 7065 | 5 | 5 | 0.07% | 0.07% | 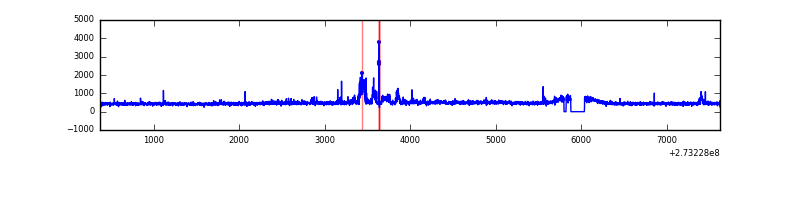 |
| C | 7248 | 7065 | 0 | 0 | 0.00% | 0.00% | 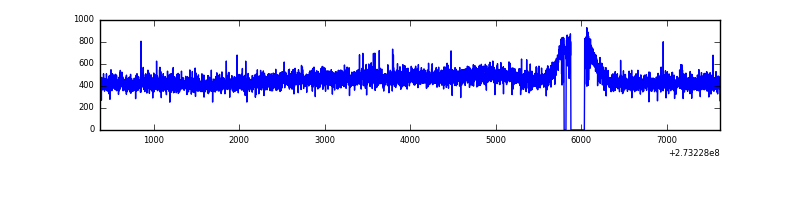 |
| D | 7248 | 7065 | 9 | 9 | 0.12% | 0.13% | 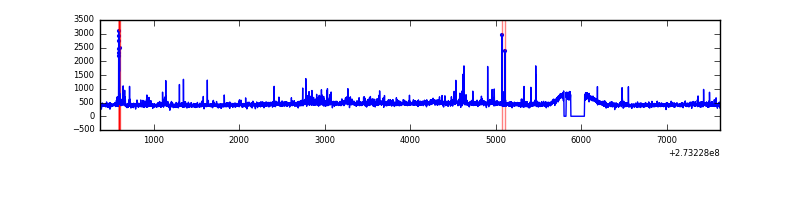 |
Top three noisy pixels from each quadrant. If the there are fewer than three noisy pixels in the level2.evt file, extra rows are filled as -1
| Pixel properties | Quadrant properties | ||||||
|---|---|---|---|---|---|---|---|
| Quadrant | DetID | PixID | Counts | Sigma | Mean | Median | Sigma |
| A | 15 | 157 | 10748 | 58.49 | 827 | 807 | 169.9 |
| A | 0 | 226 | 7133 | 37.22 | 827 | 807 | 169.9 |
| A | 9 | 143 | 7053 | 36.75 | 827 | 807 | 169.9 |
| B | 3 | 209 | 103084 | 643.55 | 826 | 802 | 158.9 |
| B | 4 | 216 | 90610 | 565.07 | 826 | 802 | 158.9 |
| B | 12 | 111 | 18606 | 112.02 | 826 | 802 | 158.9 |
| C | 14 | 238 | 123302 | 657.49 | 792 | 793 | 186.3 |
| C | 3 | 233 | 10410 | 51.61 | 792 | 793 | 186.3 |
| C | 8 | 128 | 8654 | 42.19 | 792 | 793 | 186.3 |
| D | 1 | 52 | 98796 | 498.03 | 805 | 780 | 196.8 |
| D | 2 | 234 | 34675 | 172.22 | 805 | 780 | 196.8 |
| D | 7 | 223 | 25711 | 126.68 | 805 | 780 | 196.8 |
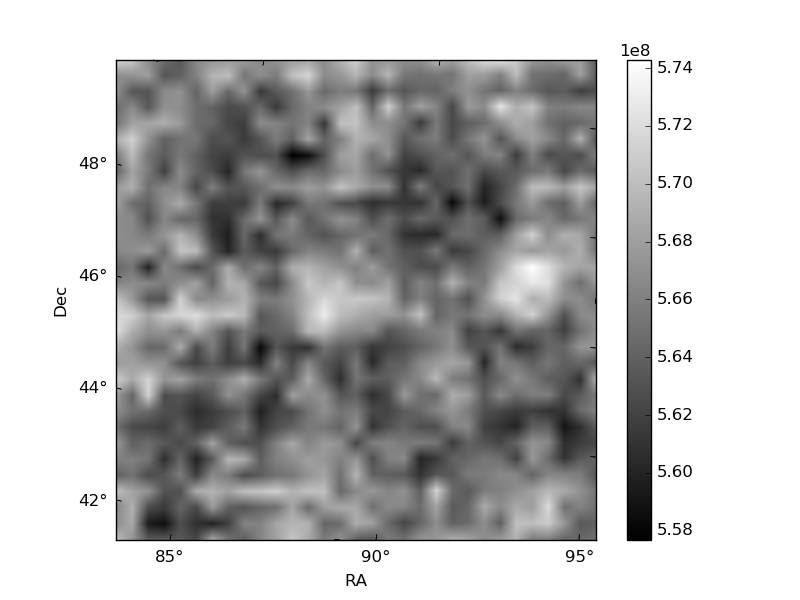
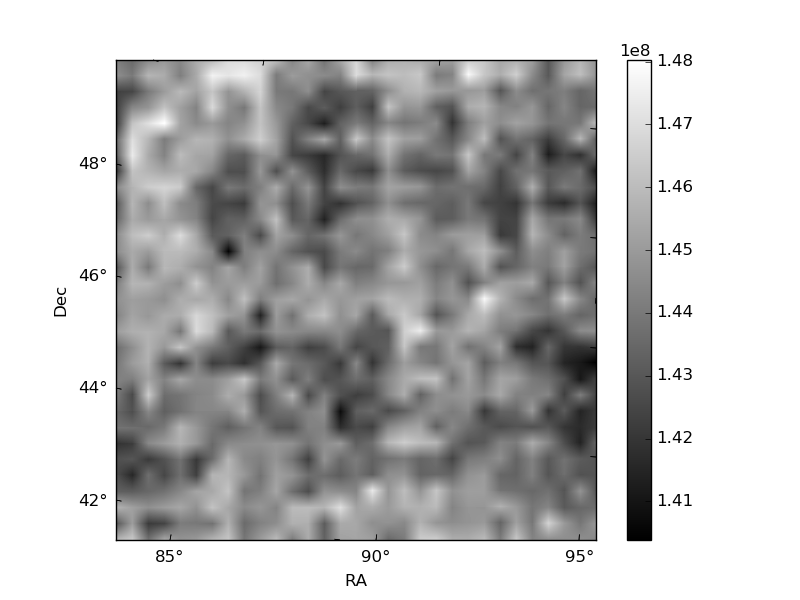
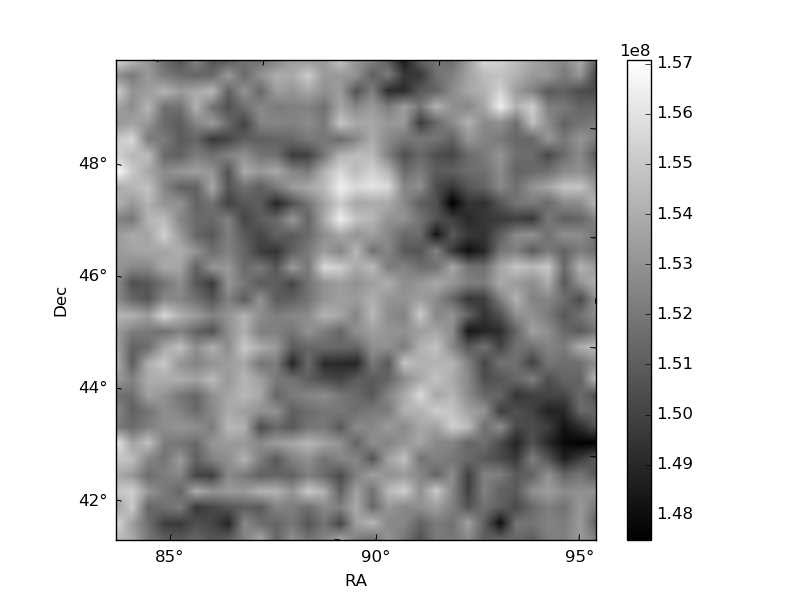
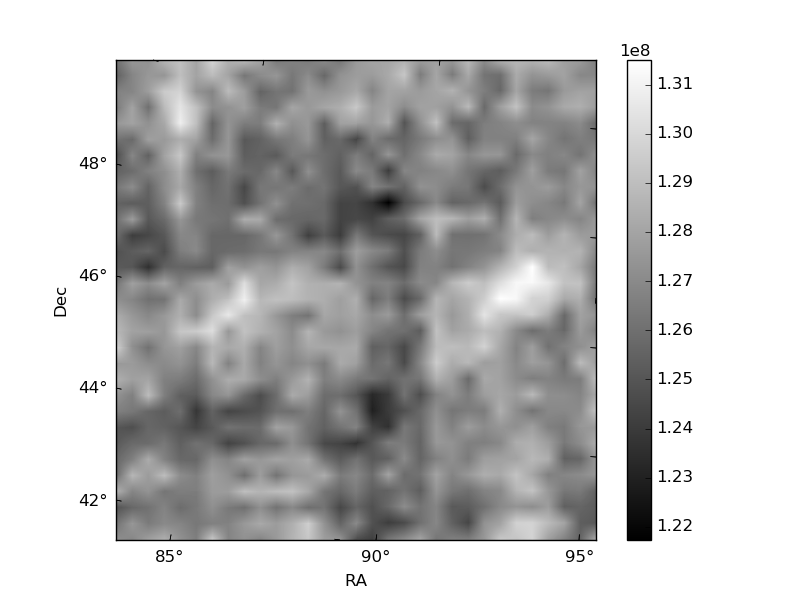
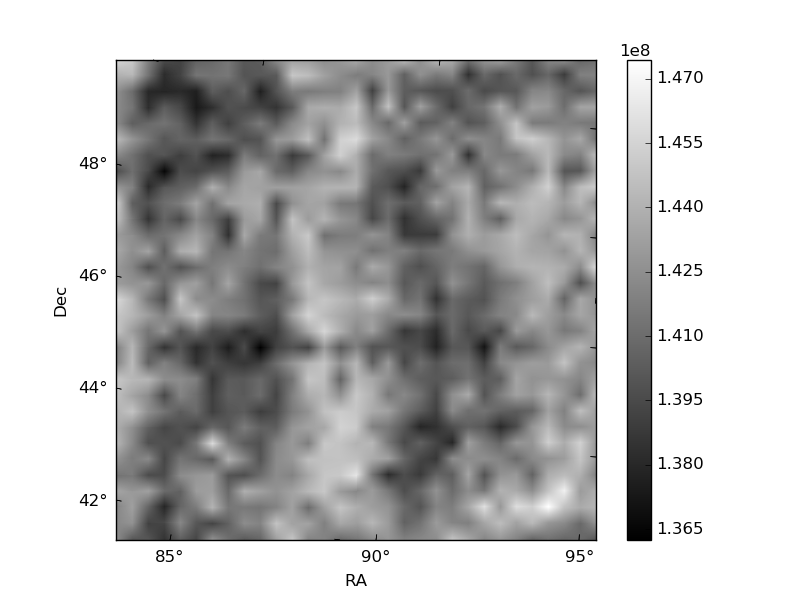
Histogram calculated using DETX and DETY for each event in the final _common_clean file
| Quadrant A | 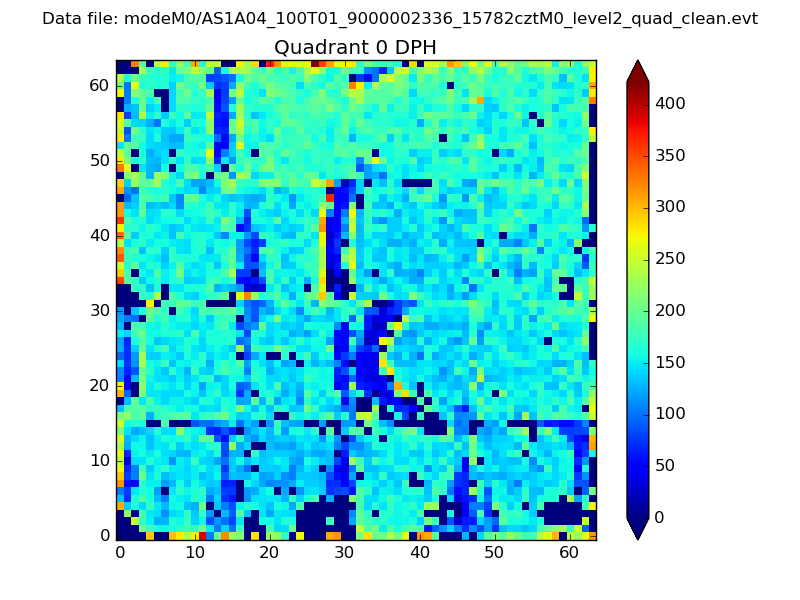 |
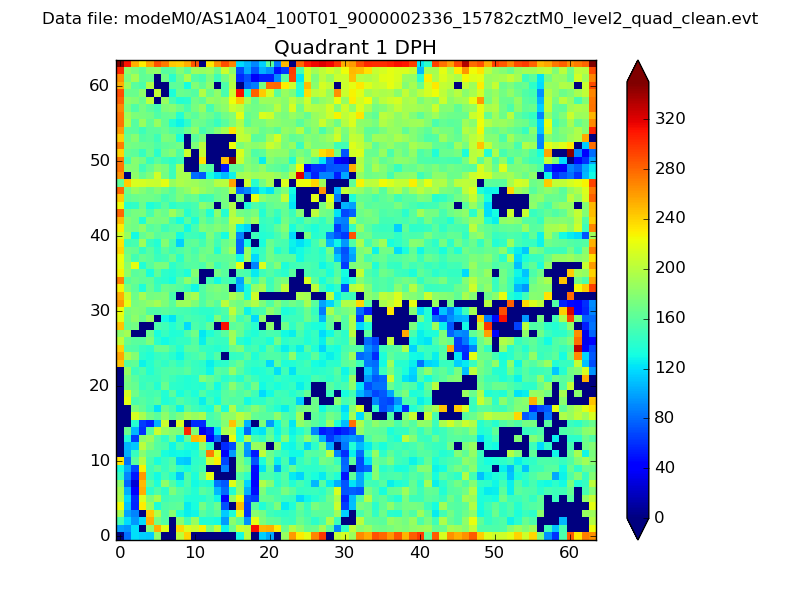 |
Quadrant B |
|---|---|---|---|
| Quadrant D | 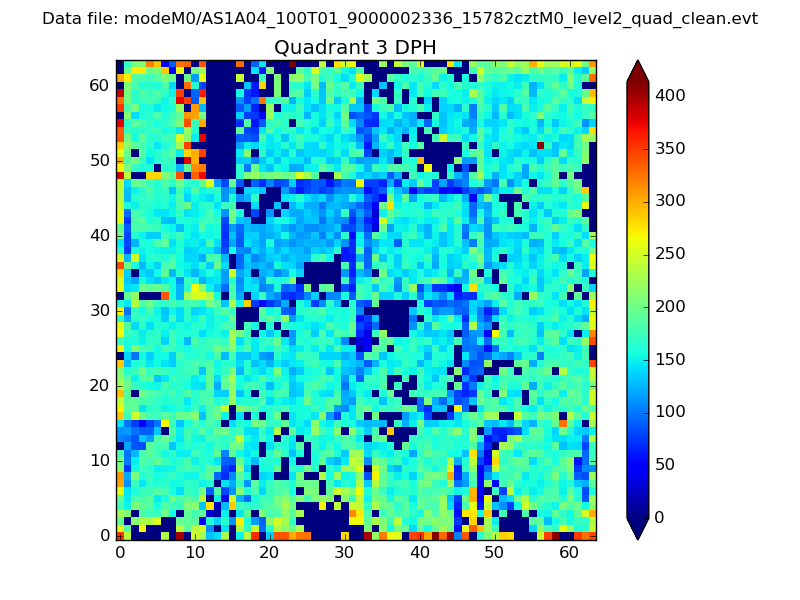 |
 |
Quadrant C |
| Plot type | Count rate plots | Images |
|---|---|---|
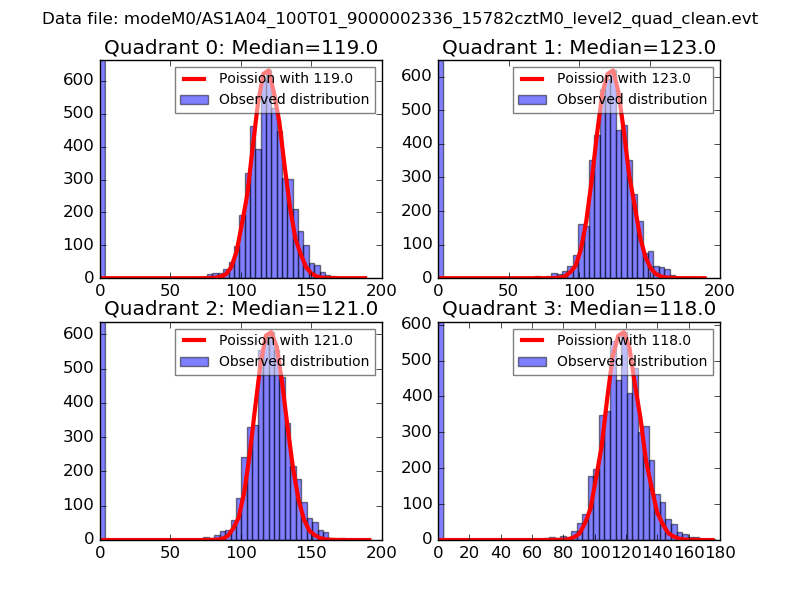
| Comparison with Poisson distribution Blue bars denote a histogram of data divided into 1 sec bins. Red curve is a Poisson curve with rate = median count rate of data. |
 |
 |
| Quadrant-wise count rates Data is divided into 100 sec bins |
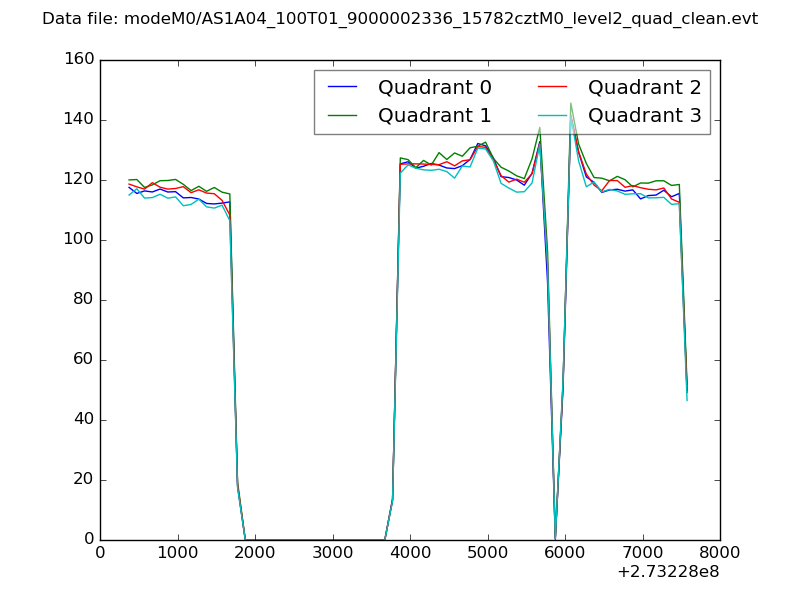 |
|
| Module-wise count rates for Quadrant A Data is divided into 100 sec bins |
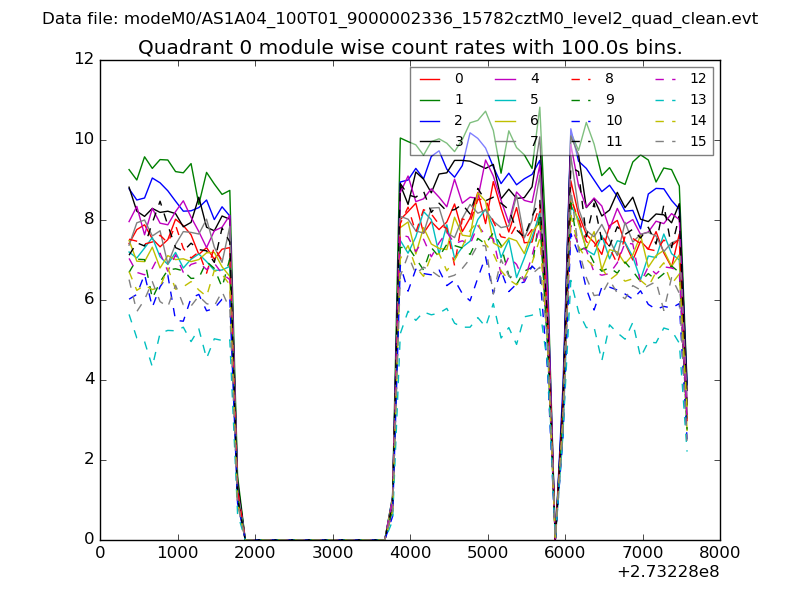 |
 |
| Module-wise count rates for Quadrant B Data is divided into 100 sec bins |
 |
 |
| Module-wise count rates for Quadrant C Data is divided into 100 sec bins |
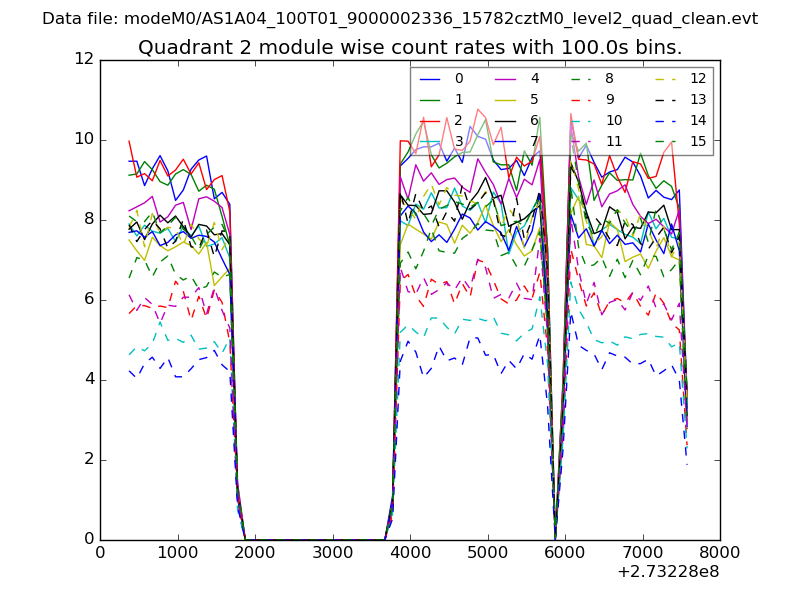 |
 |
| Module-wise count rates for Quadrant D Data is divided into 100 sec bins |
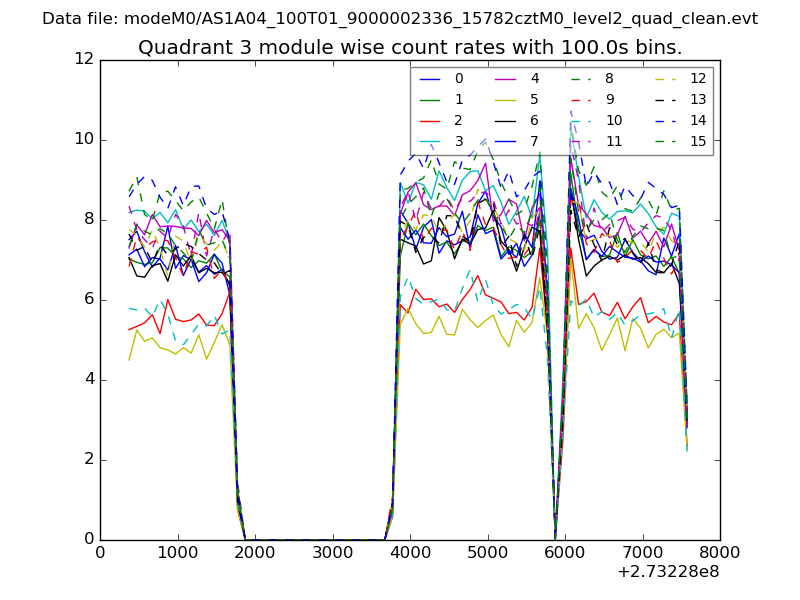 |
 |
| Parameter | Plot |
|---|---|
| CZT HV Monitor | 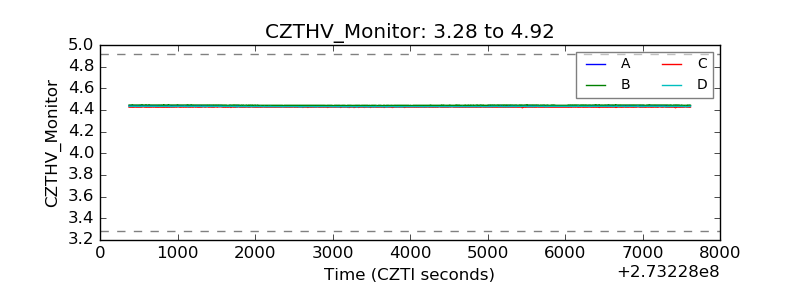 |
| D_VDD | 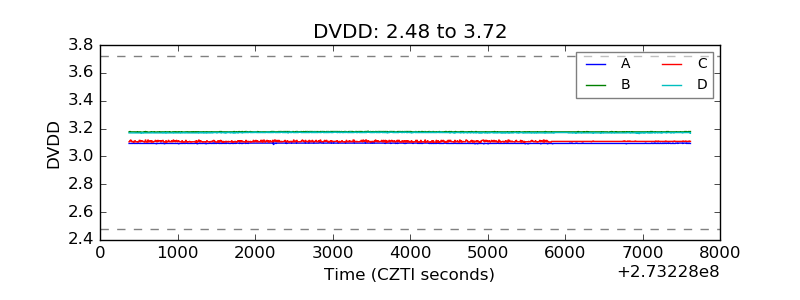 |
| Temperature 1 | 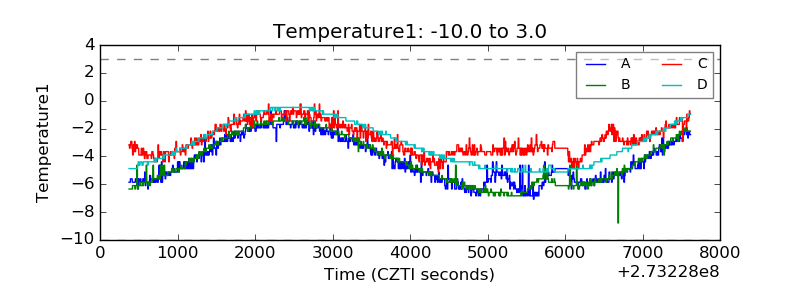 |
| Veto HV Monitor | 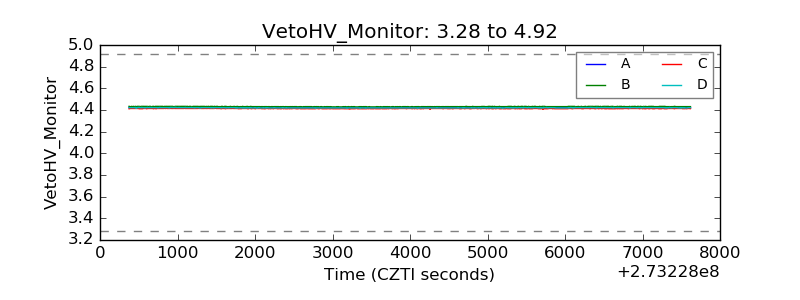 |
| Veto LLD | 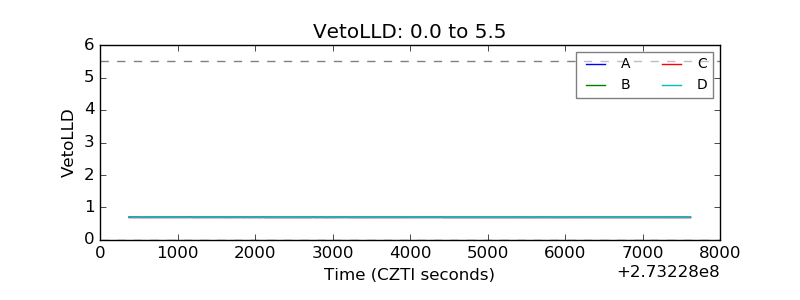 |
| Alpha Counter | 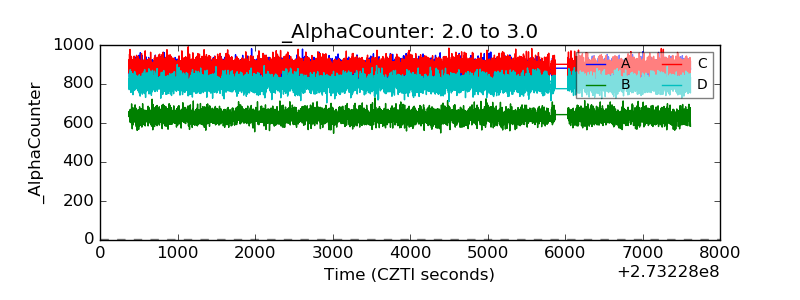 |
| _CPM_Rate | 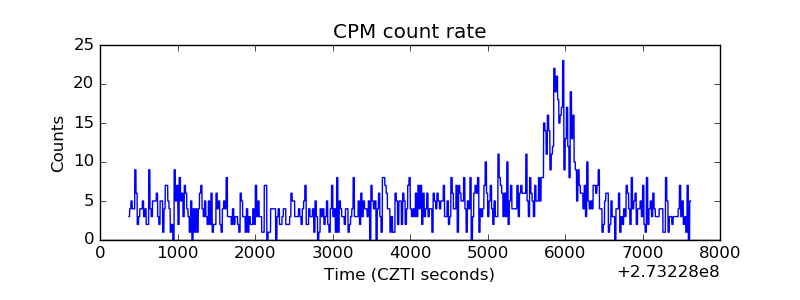 |
| CZT Counter |  |
| +2.5 Volts monitor | 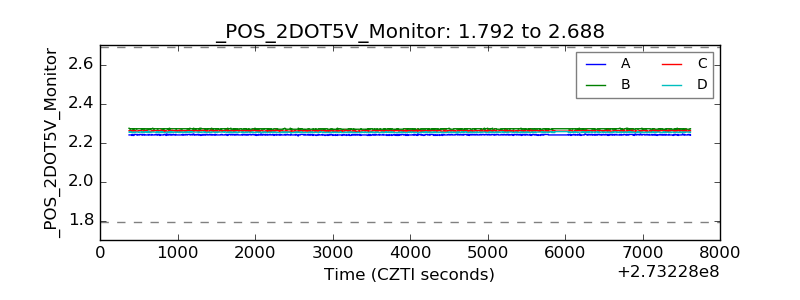 |
| +5 Volts monitor |  |
| _ROLL_ROT | 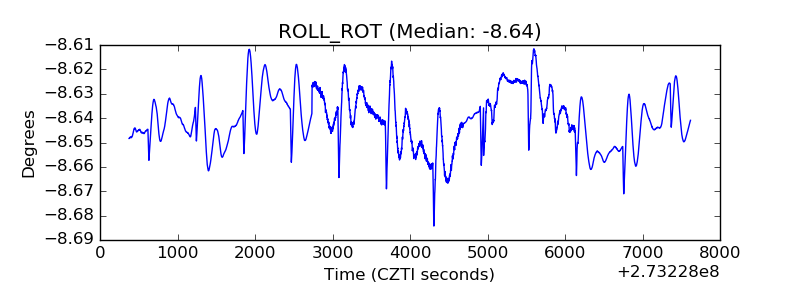 |
| _Roll_DEC | 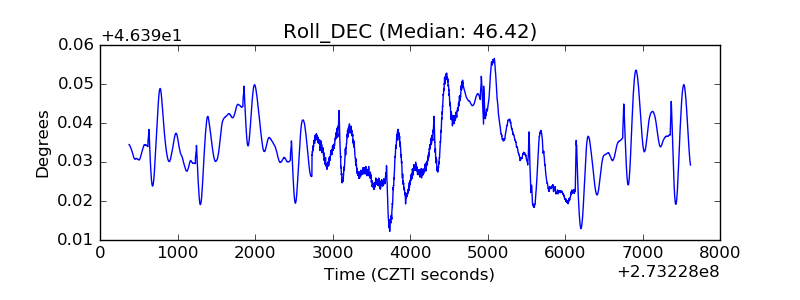 |
| _Roll_RA |  |
| Veto Counter | 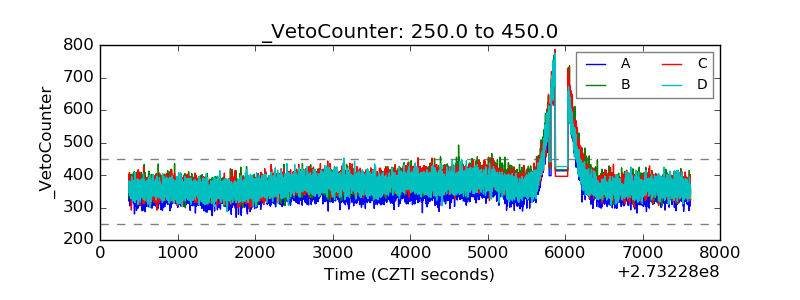 |