| Param | Original file | Final file |
|---|---|---|
| Filename | modeM0/AS1A04_100T01_9000002336_15785cztM0_level2.evt | modeM0/AS1A04_100T01_9000002336_15785cztM0_level2_quad_clean.evt |
| Size (bytes) | 1,191,182,400 | 211,806,720 |
| Size | 1.1 GB | 202.0 MB |
| Events in quadrant A | 8,520,719 | 1,288,215 |
| Events in quadrant B | 9,297,335 | 1,309,550 |
| Events in quadrant C | 8,478,639 | 1,289,503 |
| Events in quadrant D | 8,539,236 | 1,265,603 |
| Mode SS | |||
|---|---|---|---|
| Quadrant | BADHDUFLAG | Total packets | Discarded packets |
| A | 0 | 372 | 0 |
| B | 0 | 372 | 0 |
| C | 0 | 372 | 0 |
| D | 0 | 372 | 0 |
| Mode M0 | |||
|---|---|---|---|
| Quadrant | BADHDUFLAG | Total packets | Discarded packets |
| A | 0 | 37700 | 4 |
| B | 0 | 39174 | 3 |
| C | 0 | 37226 | 3 |
| D | 0 | 38003 | 3 |
| Mode M9 | |||
|---|---|---|---|
| Quadrant | BADHDUFLAG | Total packets | Discarded packets |
| A | 0 | 18 | 0 |
| B | 0 | 18 | 0 |
| C | 0 | 18 | 0 |
| D | 0 | 18 | 0 |
| Quadrant | Total seconds | Saturated seconds | Saturation percentage |
|---|---|---|---|
| A | 18308 | 270 | 1.474765% |
| B | 18308 | 319 | 1.742408% |
| C | 18308 | 310 | 1.693249% |
| D | 18308 | 240 | 1.310902% |
Noise dominated data is calculated using 1-second bins in cleaned event files. If a bin has >2000 counts, and if more than 50% of those come from <1% of pixels, then it is considered to be noise-dominated and hence unusable.
| Quadrant | # 1 sec bins | Bins with >0 counts | Bins with >2000 counts | High rate bins dominated by noise | Noise dominated (total time) | Noise dominated (detector-on time) | Marked lightcurve |
|---|---|---|---|---|---|---|---|
| A | 20109 | 18312 | 4 | 4 | 0.02% | 0.02% | 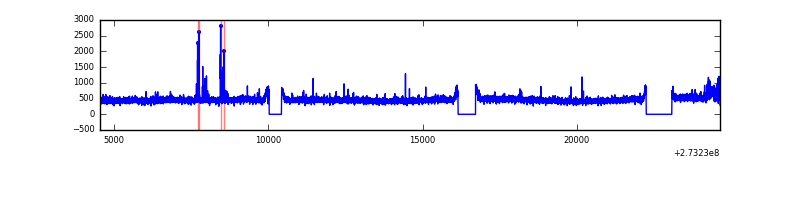 |
| B | 20109 | 18312 | 37 | 37 | 0.18% | 0.20% | 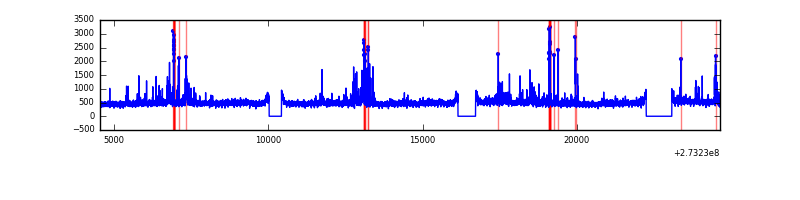 |
| C | 20109 | 18312 | 1 | 1 | 0.00% | 0.01% | 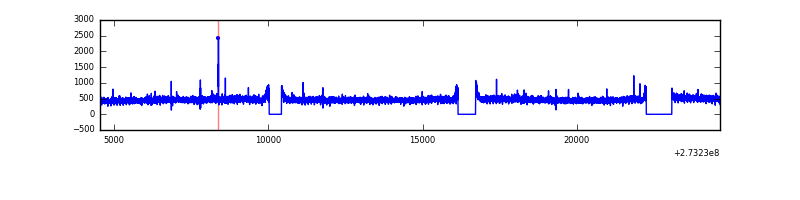 |
| D | 20109 | 18312 | 24 | 24 | 0.12% | 0.13% | 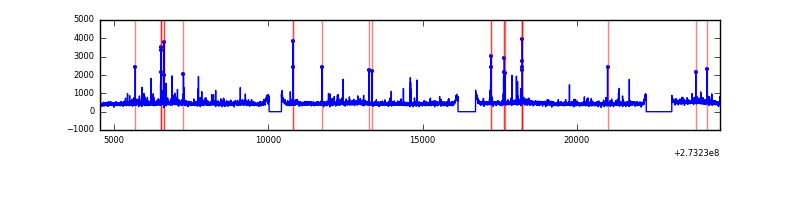 |
Top three noisy pixels from each quadrant. If the there are fewer than three noisy pixels in the level2.evt file, extra rows are filled as -1
| Pixel properties | Quadrant properties | ||||||
|---|---|---|---|---|---|---|---|
| Quadrant | DetID | PixID | Counts | Sigma | Mean | Median | Sigma |
| A | 15 | 239 | 178160 | 402.85 | 2163 | 2110 | 437.0 |
| A | 0 | 226 | 19296 | 39.33 | 2163 | 2110 | 437.0 |
| A | 12 | 194 | 16509 | 32.95 | 2163 | 2110 | 437.0 |
| B | 7 | 220 | 208327 | 500.13 | 2166 | 2111 | 412.3 |
| B | 3 | 209 | 131593 | 314.03 | 2166 | 2111 | 412.3 |
| B | 3 | 64 | 90745 | 214.96 | 2166 | 2111 | 412.3 |
| C | 14 | 238 | 318161 | 650.93 | 2078 | 2082 | 485.6 |
| C | 3 | 233 | 28741 | 54.9 | 2078 | 2082 | 485.6 |
| C | 10 | 22 | 22883 | 42.84 | 2078 | 2082 | 485.6 |
| D | 1 | 52 | 123418 | 231.84 | 2115 | 2043 | 523.5 |
| D | 10 | 70 | 103952 | 194.66 | 2115 | 2043 | 523.5 |
| D | 2 | 152 | 97160 | 181.69 | 2115 | 2043 | 523.5 |
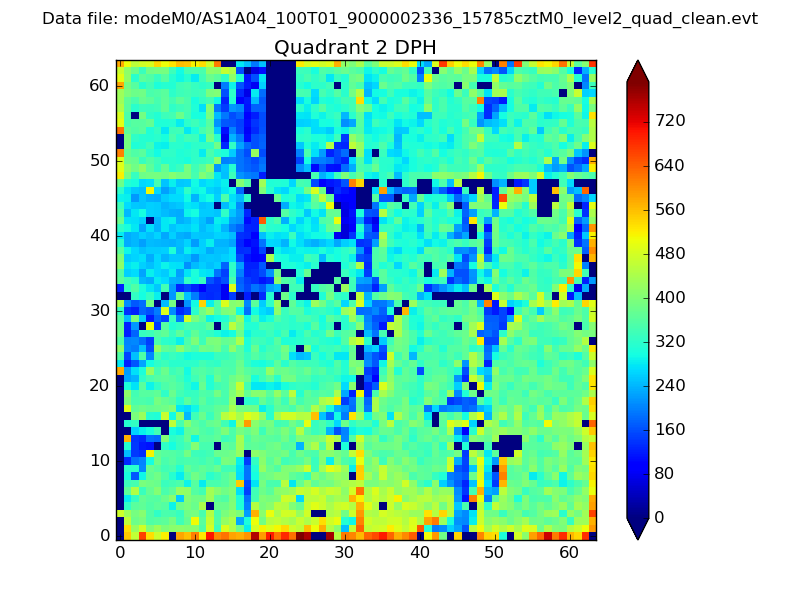
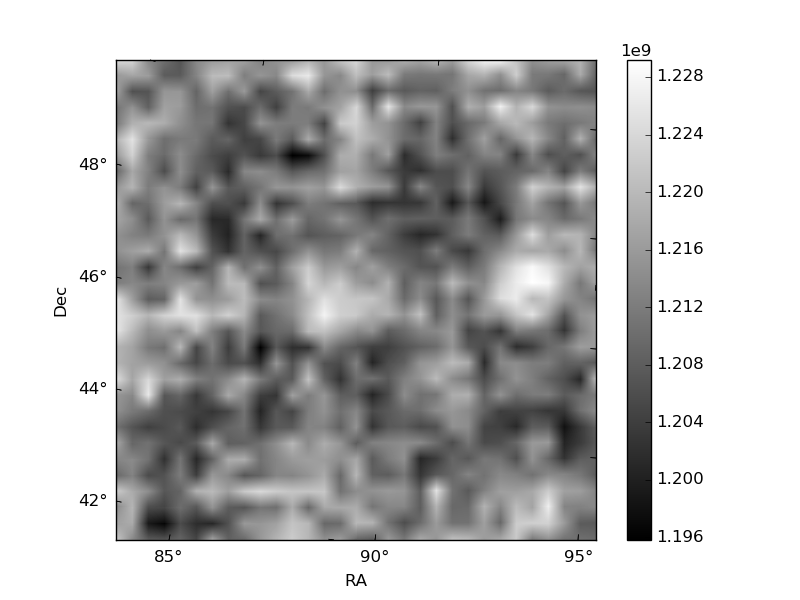
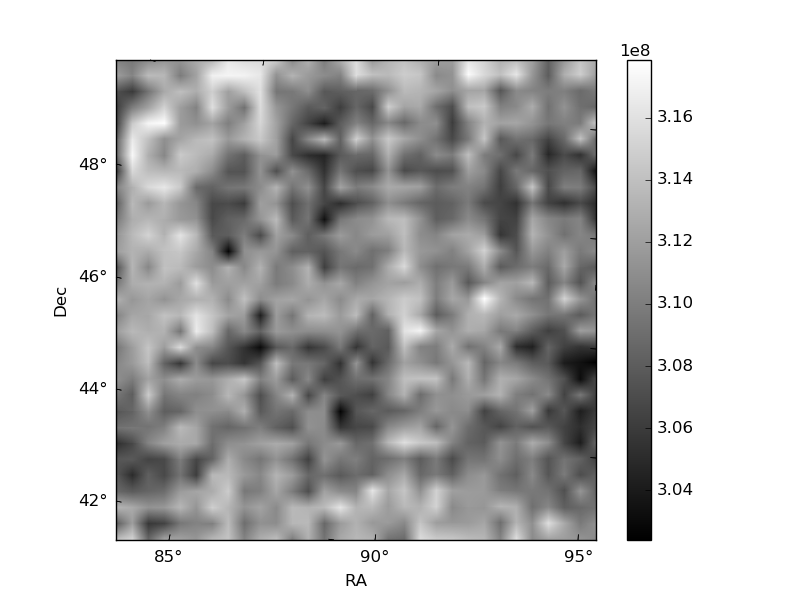
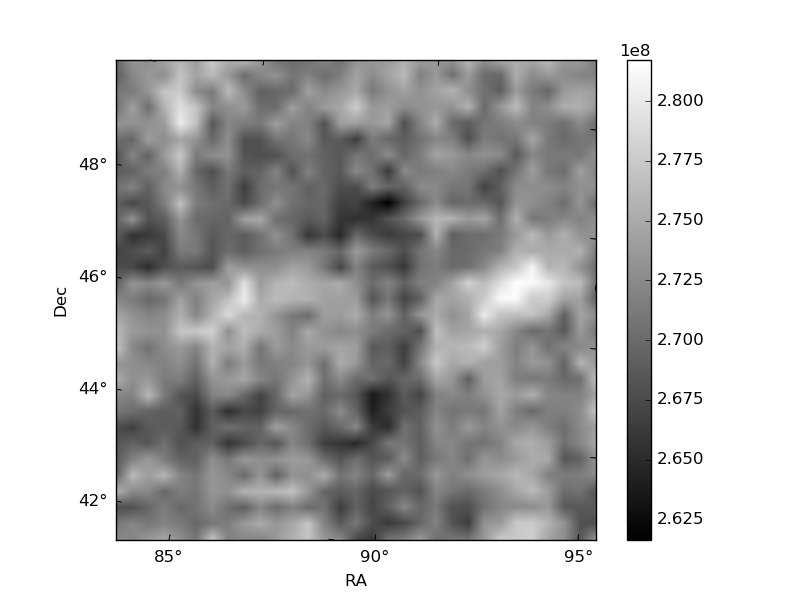
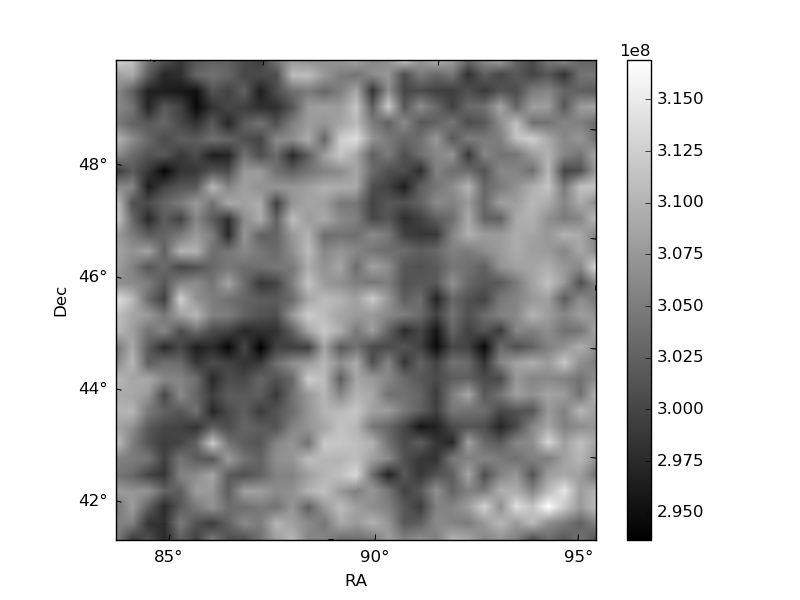
Histogram calculated using DETX and DETY for each event in the final _common_clean file
| Quadrant A | 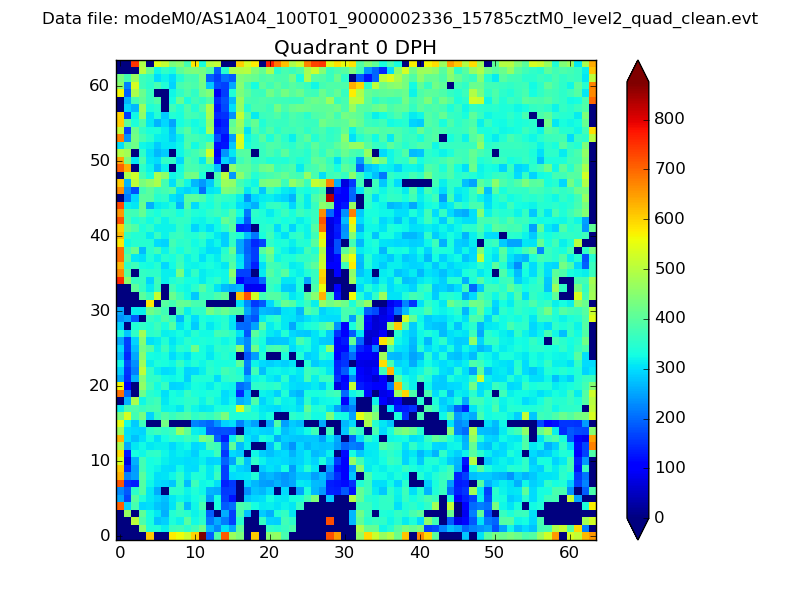 |
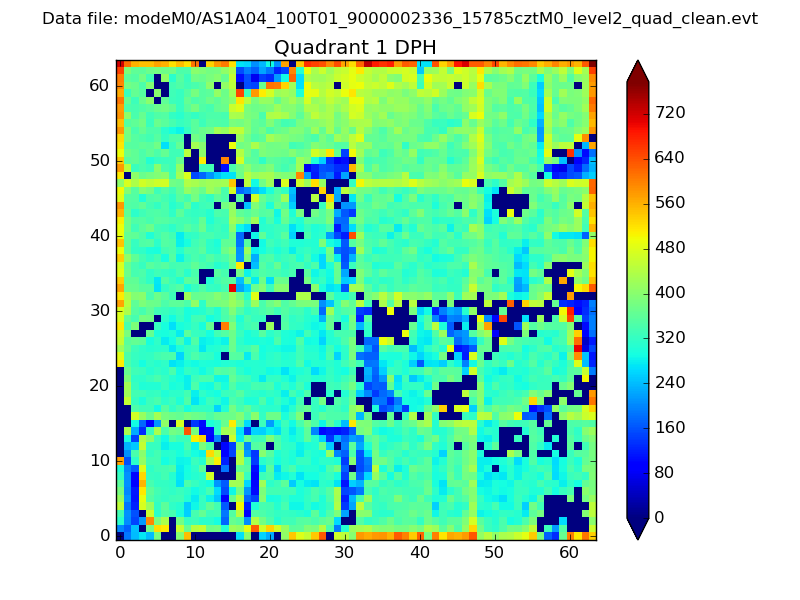 |
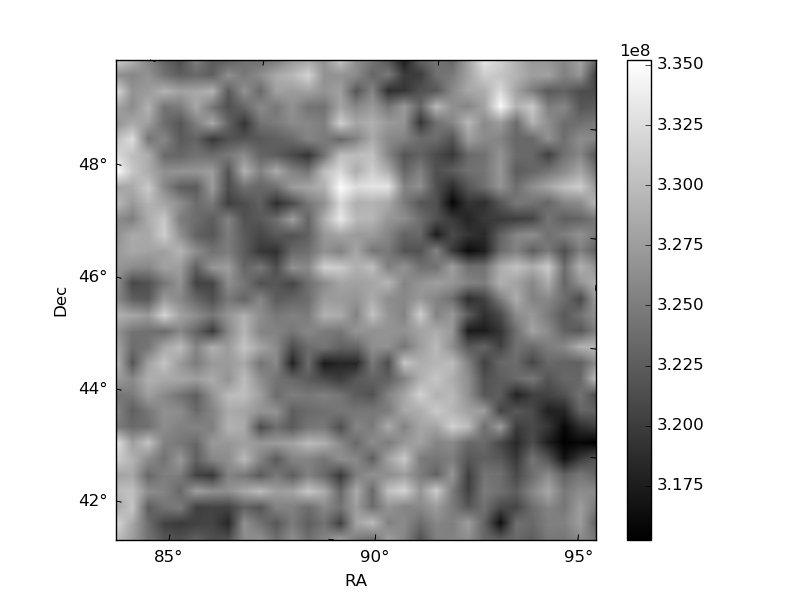
Quadrant B |
|---|---|---|---|
| Quadrant D | 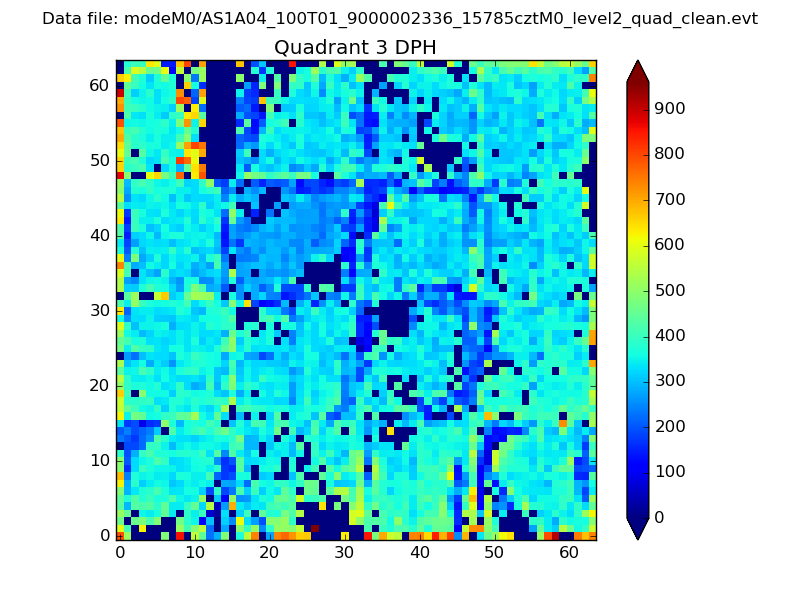 |
 |
Quadrant C |
| Plot type | Count rate plots | Images |
|---|---|---|
| Comparison with Poisson distribution Blue bars denote a histogram of data divided into 1 sec bins. Red curve is a Poisson curve with rate = median count rate of data. |
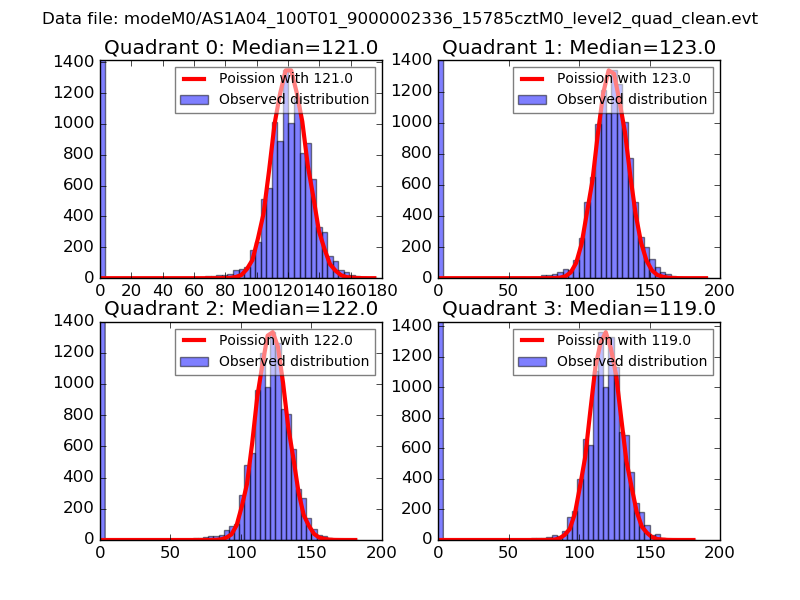 |
 |
| Quadrant-wise count rates Data is divided into 100 sec bins |
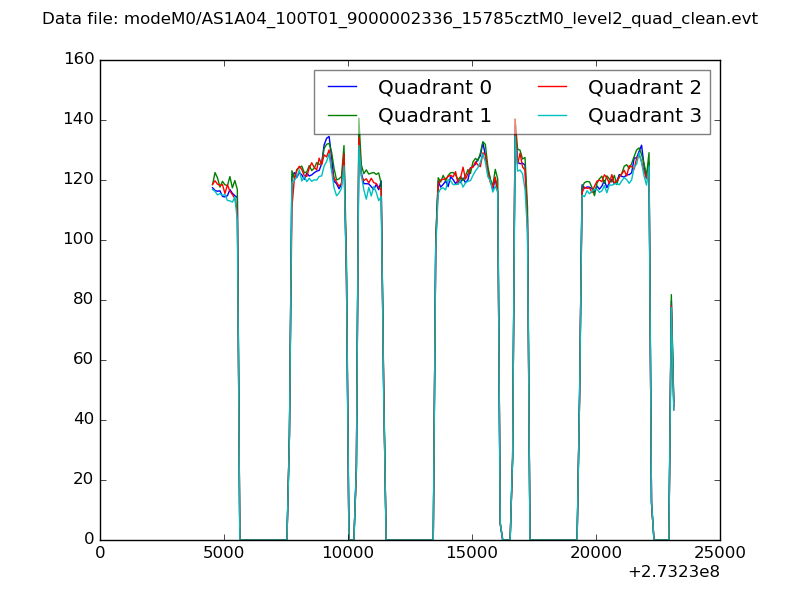 |
|
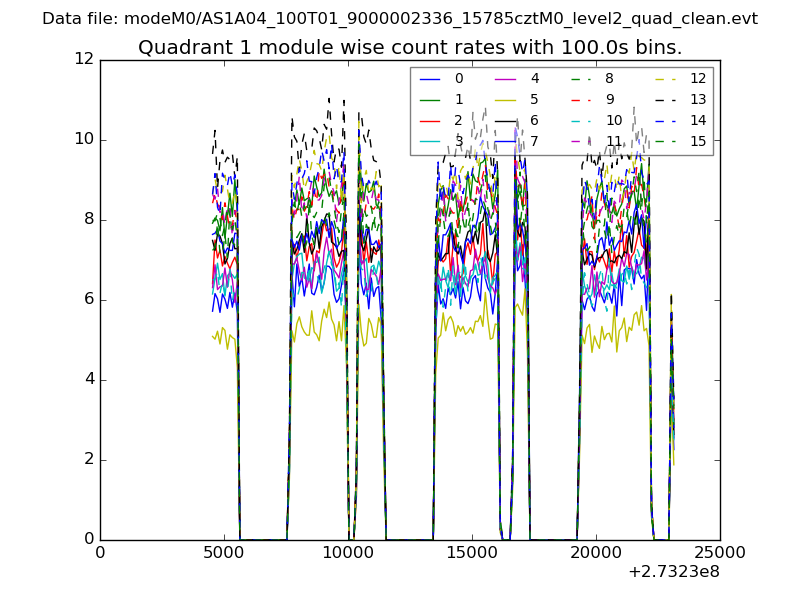
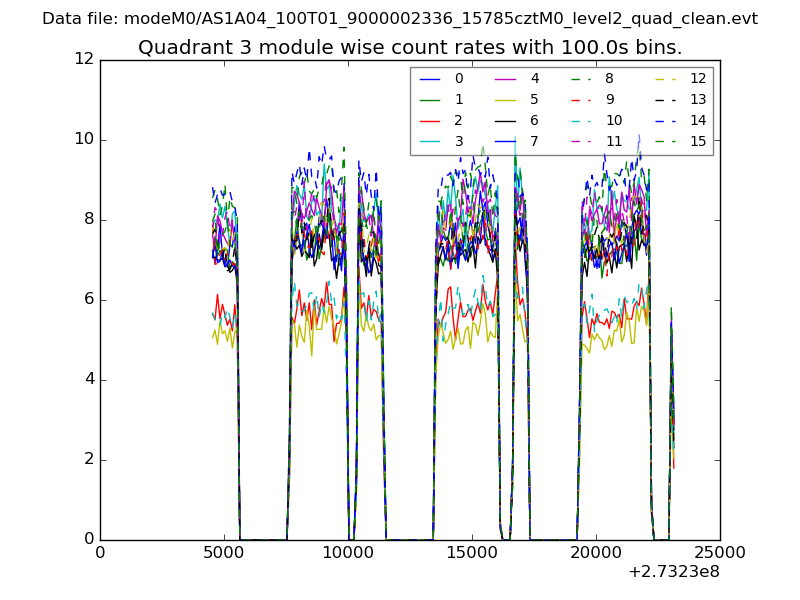
| Module-wise count rates for Quadrant A Data is divided into 100 sec bins |
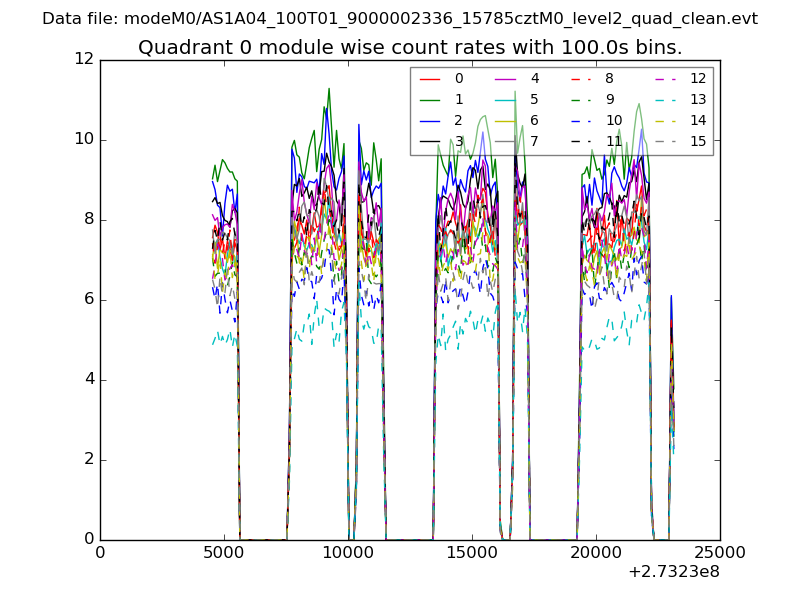 |
 |
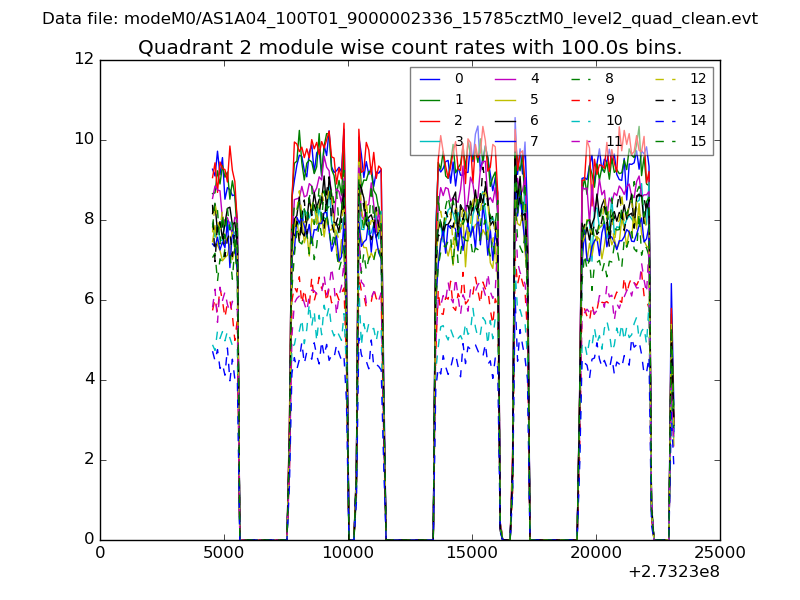
| Module-wise count rates for Quadrant B Data is divided into 100 sec bins |
 |
 |
| Module-wise count rates for Quadrant C Data is divided into 100 sec bins |
 |
 |
| Module-wise count rates for Quadrant D Data is divided into 100 sec bins |
 |
 |
| Parameter | Plot |
|---|---|
| CZT HV Monitor | 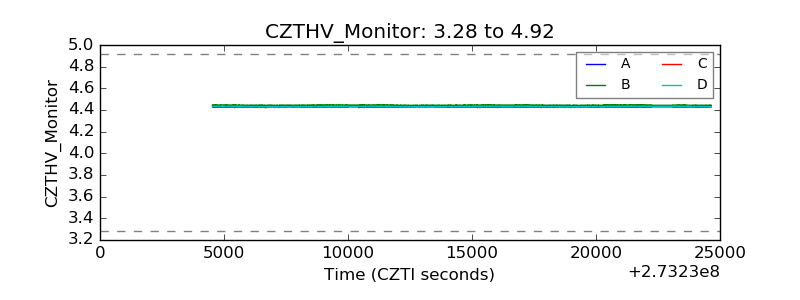 |
| D_VDD | 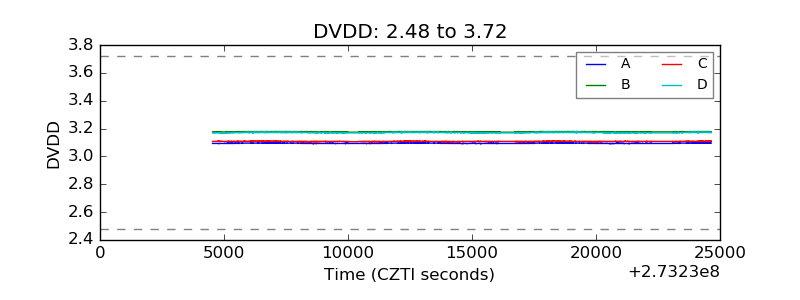 |
| Temperature 1 | 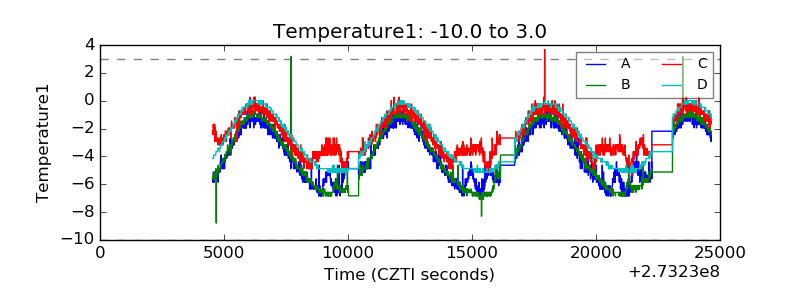 |
| Veto HV Monitor | 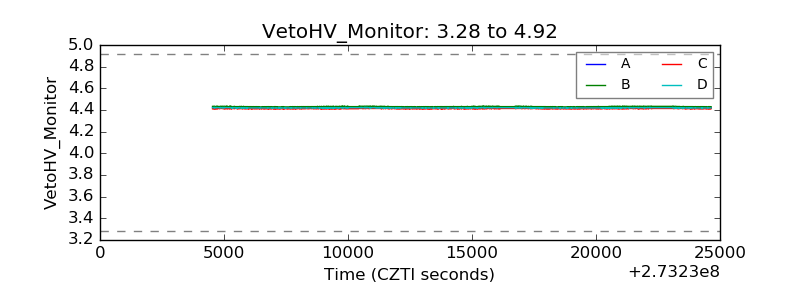 |
| Veto LLD | 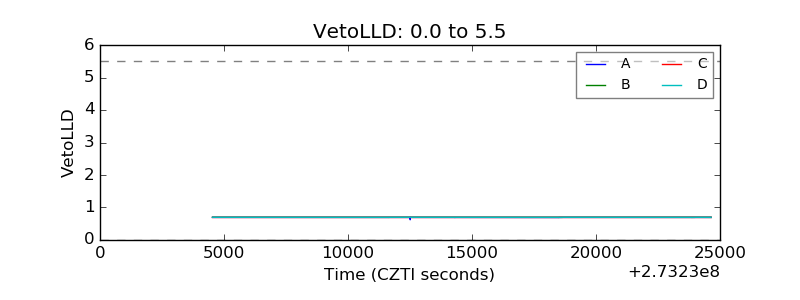 |
| Alpha Counter | 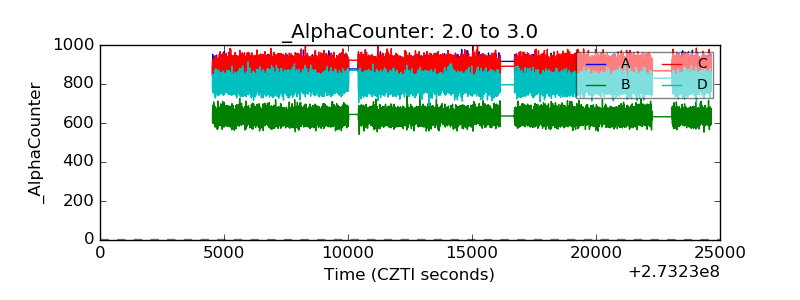 |
| _CPM_Rate | 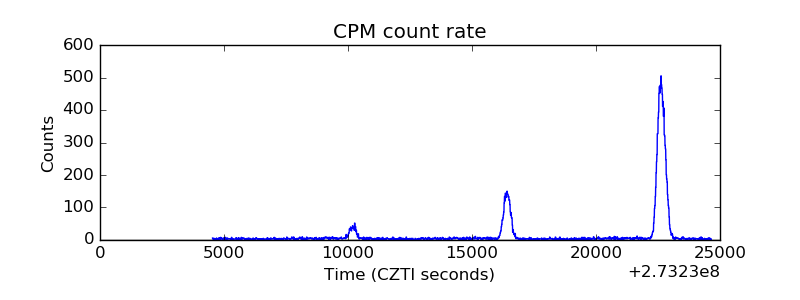 |
| CZT Counter | 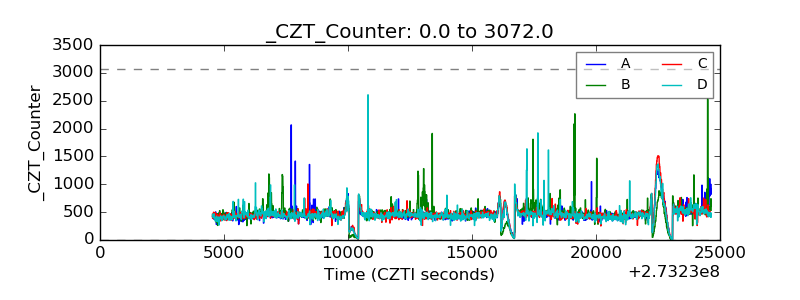 |
| +2.5 Volts monitor |  |
| +5 Volts monitor |  |
| _ROLL_ROT | 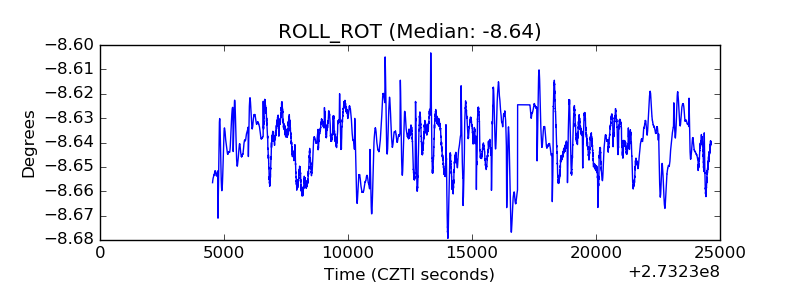 |
| _Roll_DEC | 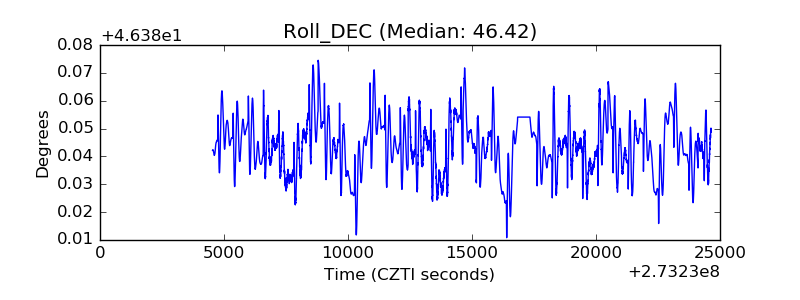 |
| _Roll_RA | 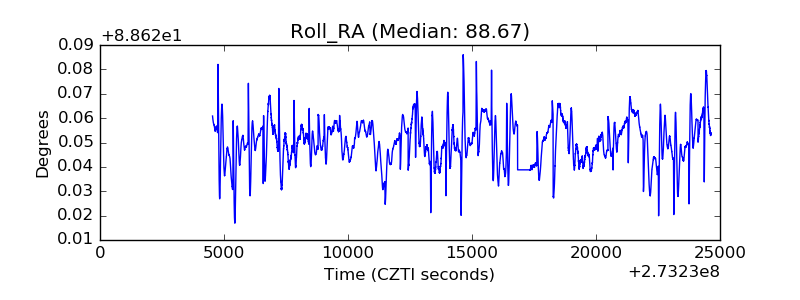 |
| Veto Counter | 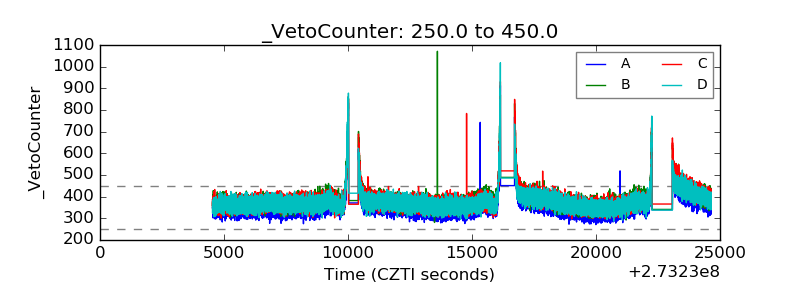 |