| Param | Original file | Final file |
|---|---|---|
| Filename | modeM0/AS1A04_100T01_9000002336_15786cztM0_level2.evt | modeM0/AS1A04_100T01_9000002336_15786cztM0_level2_quad_clean.evt |
| Size (bytes) | 473,071,680 | 67,023,360 |
| Size | 451.2 MB | 63.9 MB |
| Events in quadrant A | 3,517,330 | 388,899 |
| Events in quadrant B | 3,766,465 | 392,427 |
| Events in quadrant C | 3,259,181 | 391,554 |
| Events in quadrant D | 3,324,911 | 385,095 |
| Mode SS | |||
|---|---|---|---|
| Quadrant | BADHDUFLAG | Total packets | Discarded packets |
| A | 0 | 136 | 0 |
| B | 0 | 136 | 0 |
| C | 0 | 136 | 0 |
| D | 0 | 136 | 0 |
| Mode M0 | |||
|---|---|---|---|
| Quadrant | BADHDUFLAG | Total packets | Discarded packets |
| A | 0 | 14852 | 2 |
| B | 0 | 15523 | 1 |
| C | 0 | 13937 | 1 |
| D | 0 | 14374 | 1 |
| Mode M9 | |||
|---|---|---|---|
| Quadrant | BADHDUFLAG | Total packets | Discarded packets |
| A | 0 | 9 | 0 |
| B | 0 | 9 | 0 |
| C | 0 | 9 | 0 |
| D | 0 | 9 | 0 |
| Quadrant | Total seconds | Saturated seconds | Saturation percentage |
|---|---|---|---|
| A | 6759 | 98 | 1.449919% |
| B | 6759 | 93 | 1.375943% |
| C | 6759 | 88 | 1.301968% |
| D | 6759 | 49 | 0.724959% |
Noise dominated data is calculated using 1-second bins in cleaned event files. If a bin has >2000 counts, and if more than 50% of those come from <1% of pixels, then it is considered to be noise-dominated and hence unusable.
| Quadrant | # 1 sec bins | Bins with >0 counts | Bins with >2000 counts | High rate bins dominated by noise | Noise dominated (total time) | Noise dominated (detector-on time) | Marked lightcurve |
|---|---|---|---|---|---|---|---|
| A | 7715 | 6761 | 33 | 33 | 0.43% | 0.49% |  |
| B | 7715 | 6761 | 15 | 15 | 0.19% | 0.22% | 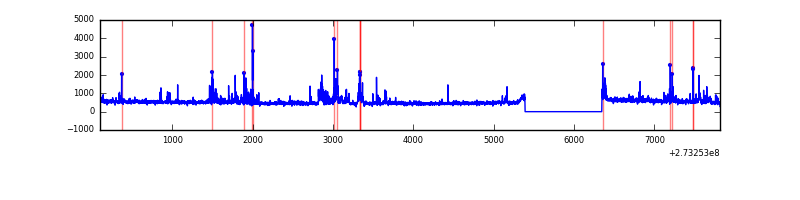 |
| C | 7715 | 6761 | 1 | 1 | 0.01% | 0.01% | 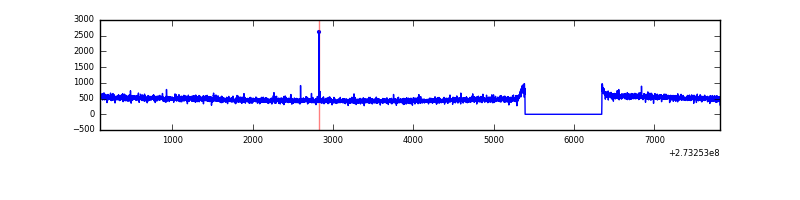 |
| D | 7715 | 6761 | 7 | 7 | 0.09% | 0.10% | 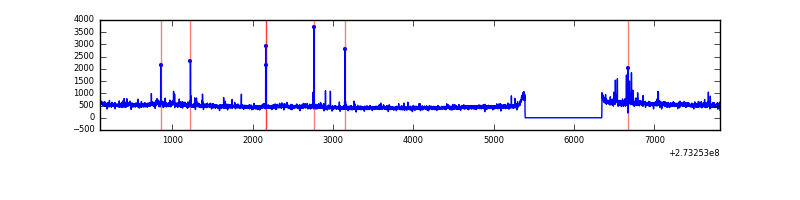 |
Top three noisy pixels from each quadrant. If the there are fewer than three noisy pixels in the level2.evt file, extra rows are filled as -1
| Pixel properties | Quadrant properties | ||||||
|---|---|---|---|---|---|---|---|
| Quadrant | DetID | PixID | Counts | Sigma | Mean | Median | Sigma |
| A | 15 | 239 | 323616 | 1918.47 | 826 | 806 | 168.3 |
| A | 15 | 157 | 12157 | 67.46 | 826 | 806 | 168.3 |
| A | 0 | 226 | 7304 | 38.61 | 826 | 806 | 168.3 |
| B | 3 | 209 | 209641 | 1332.24 | 826 | 808 | 156.8 |
| B | 7 | 220 | 73715 | 465.11 | 826 | 808 | 156.8 |
| B | 0 | 190 | 55552 | 349.24 | 826 | 808 | 156.8 |
| C | 14 | 238 | 122000 | 649.53 | 798 | 801 | 186.6 |
| C | 3 | 233 | 14352 | 72.62 | 798 | 801 | 186.6 |
| C | 10 | 22 | 6413 | 30.08 | 798 | 801 | 186.6 |
| D | 1 | 52 | 113185 | 563.14 | 812 | 786 | 199.6 |
| D | 2 | 152 | 39357 | 193.25 | 812 | 786 | 199.6 |
| D | 10 | 70 | 29920 | 145.97 | 812 | 786 | 199.6 |
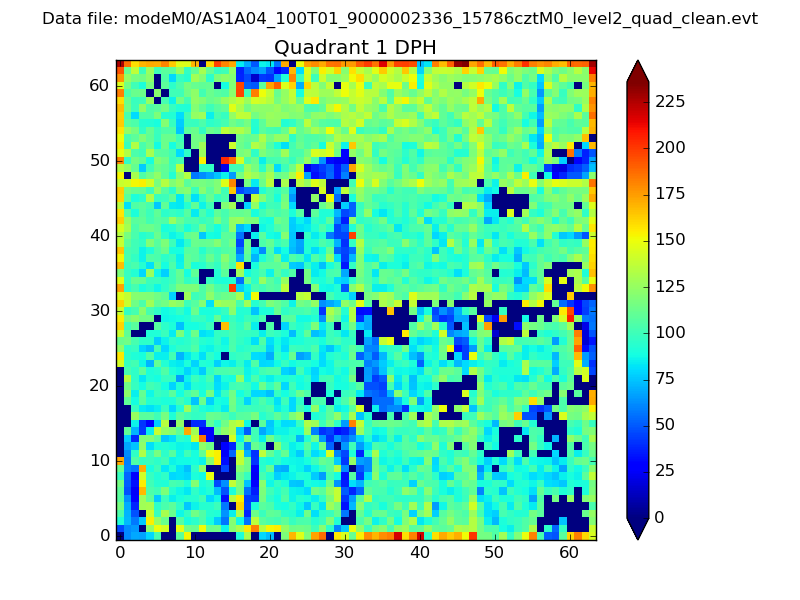
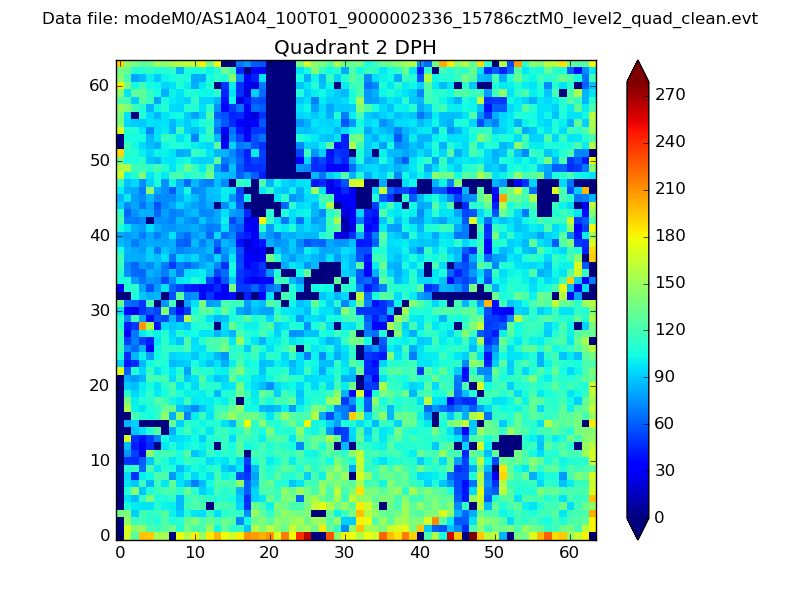
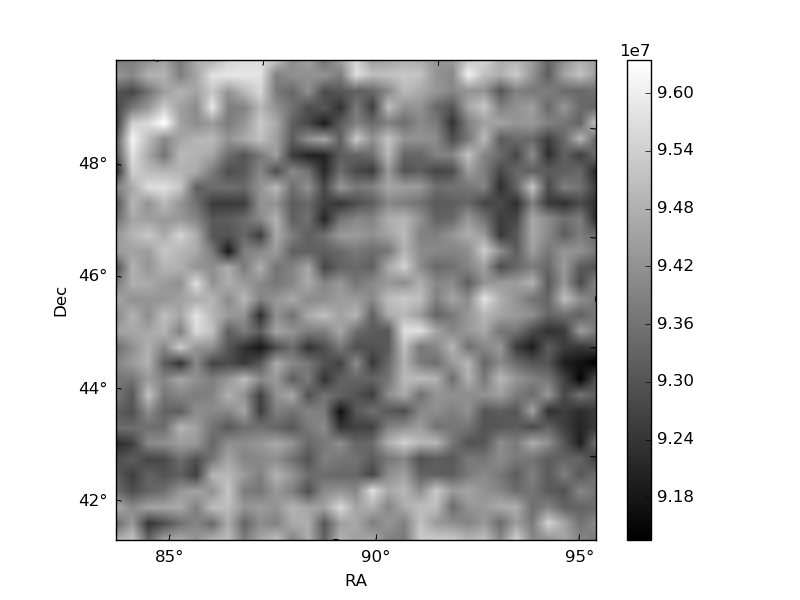
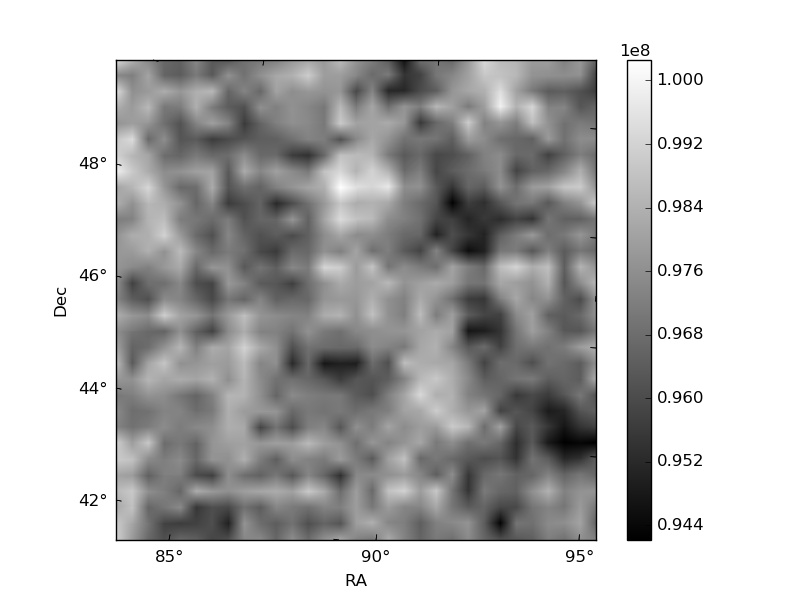
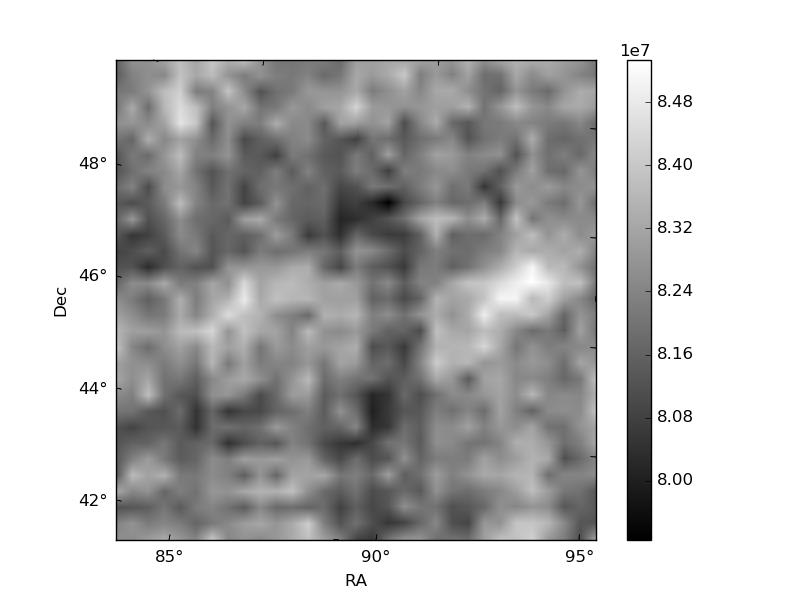
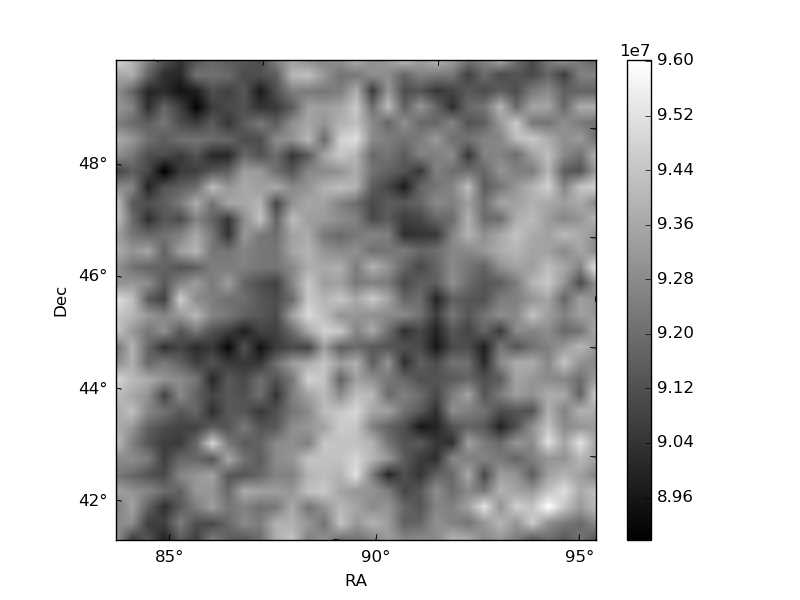
Histogram calculated using DETX and DETY for each event in the final _common_clean file
| Quadrant A |  |
 |
Quadrant B |
|---|---|---|---|
| Quadrant D | 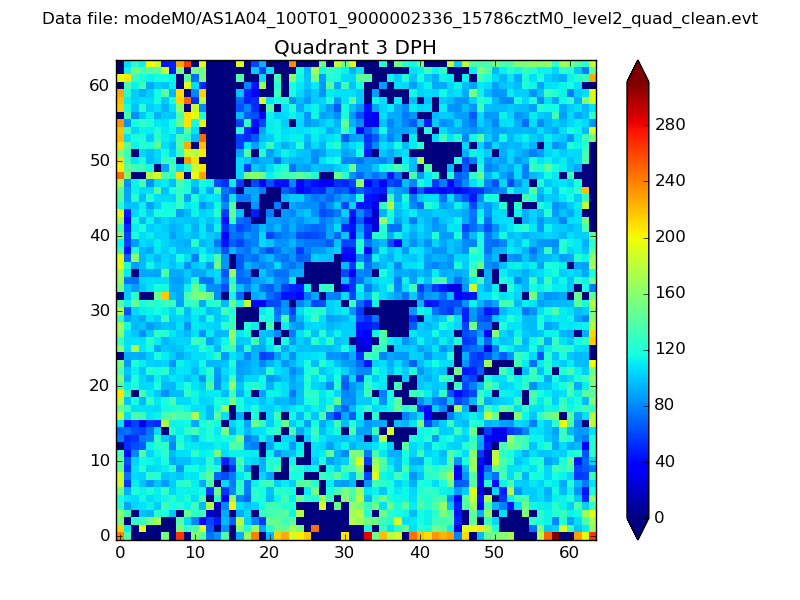 |
 |
Quadrant C |
| Plot type | Count rate plots | Images |
|---|---|---|
| Comparison with Poisson distribution Blue bars denote a histogram of data divided into 1 sec bins. Red curve is a Poisson curve with rate = median count rate of data. |
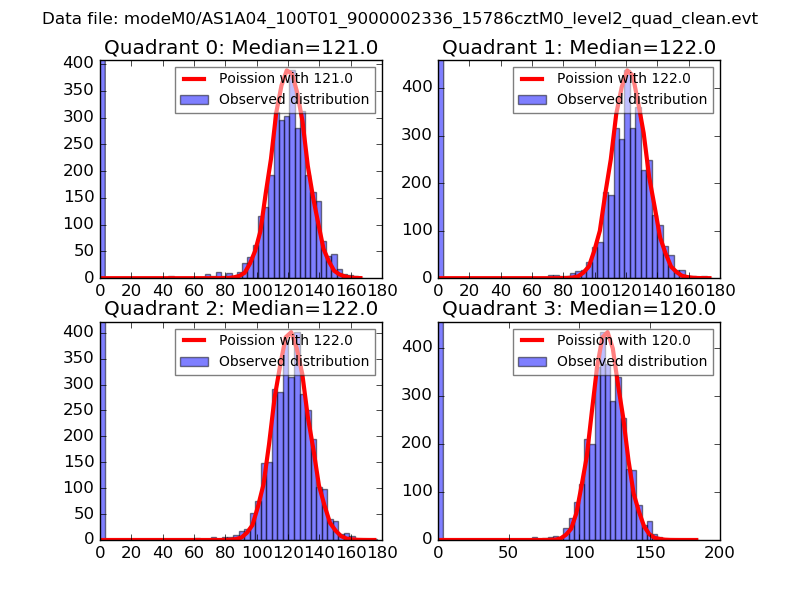 |
 |
| Quadrant-wise count rates Data is divided into 100 sec bins |
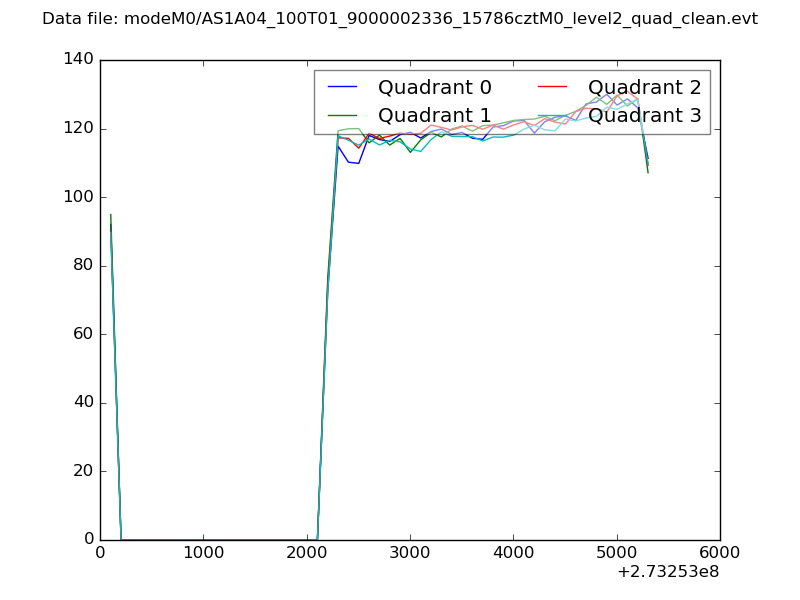 |
|
| Module-wise count rates for Quadrant A Data is divided into 100 sec bins |
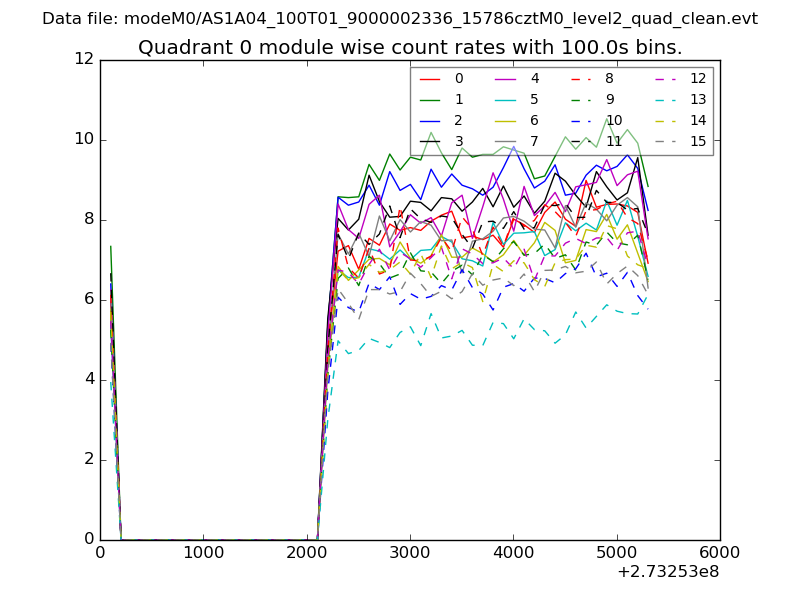 |
 |
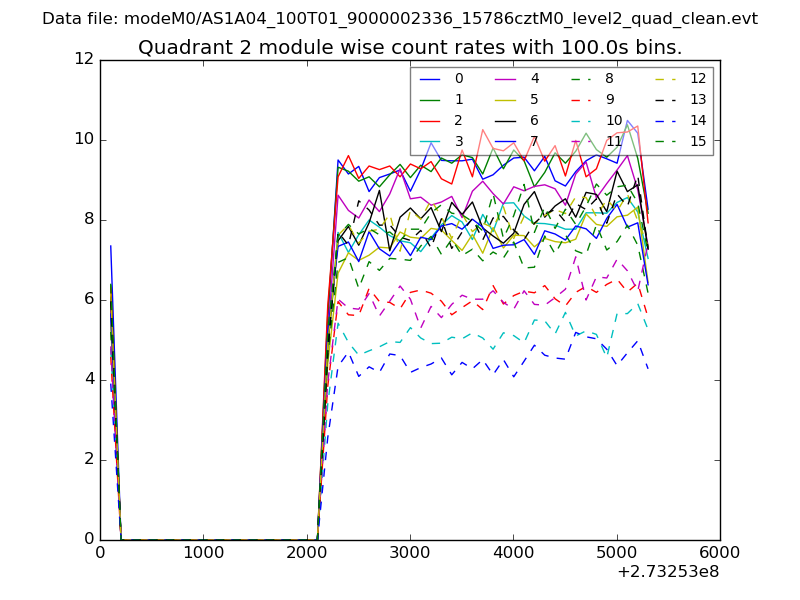
| Module-wise count rates for Quadrant B Data is divided into 100 sec bins |
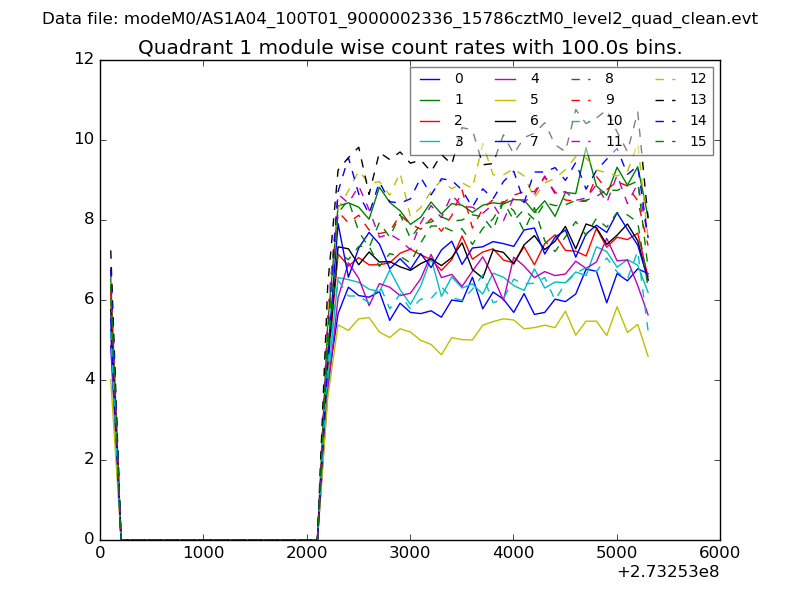 |
 |
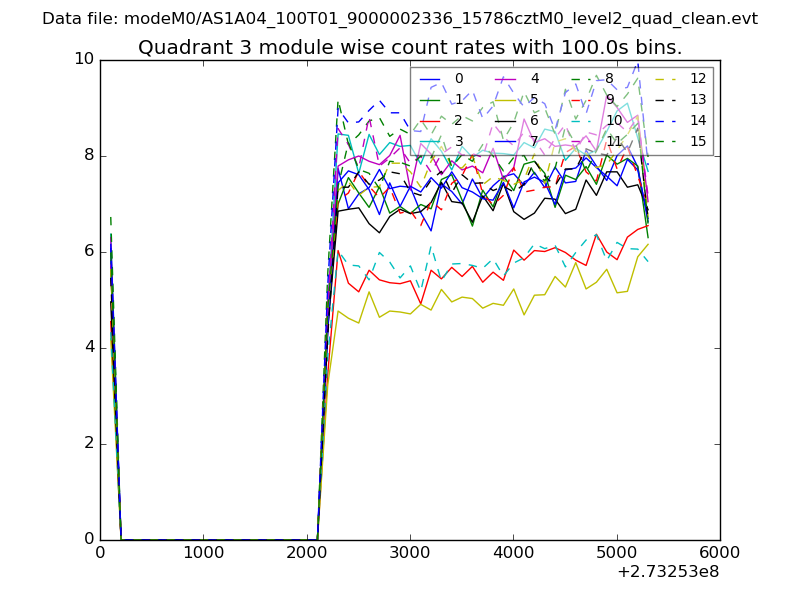
| Module-wise count rates for Quadrant C Data is divided into 100 sec bins |
 |
 |
| Module-wise count rates for Quadrant D Data is divided into 100 sec bins |
 |
 |
| Parameter | Plot |
|---|---|
| CZT HV Monitor | 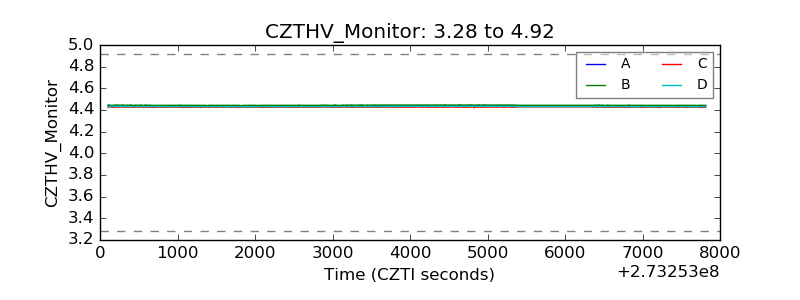 |
| D_VDD | 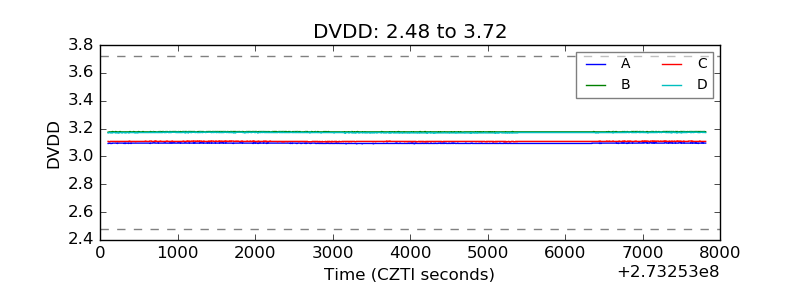 |
| Temperature 1 | 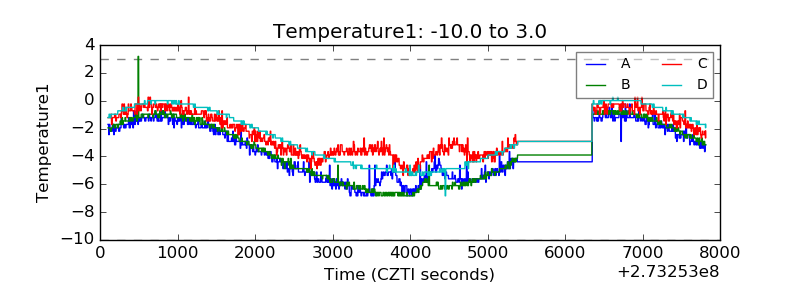 |
| Veto HV Monitor | 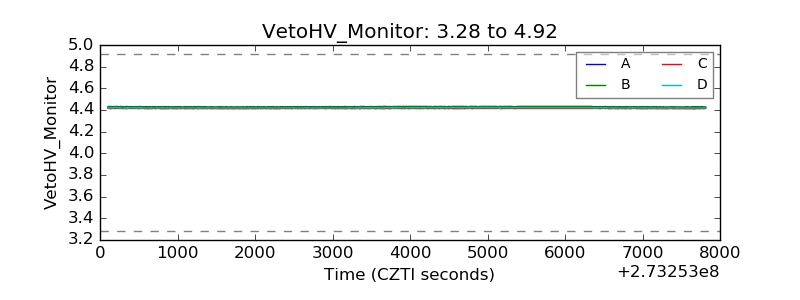 |
| Veto LLD | 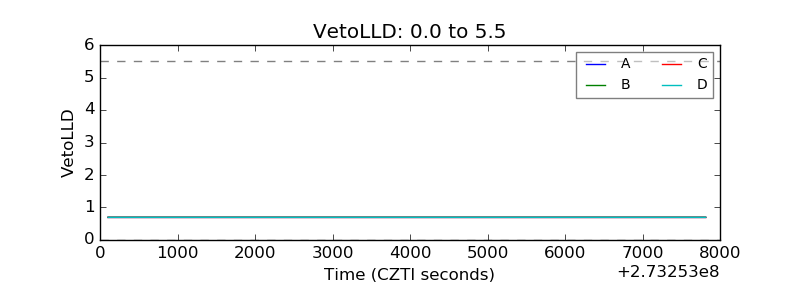 |
| Alpha Counter |  |
| _CPM_Rate | 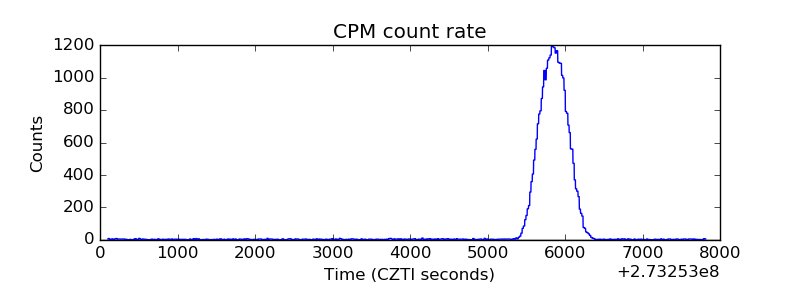 |
| CZT Counter | 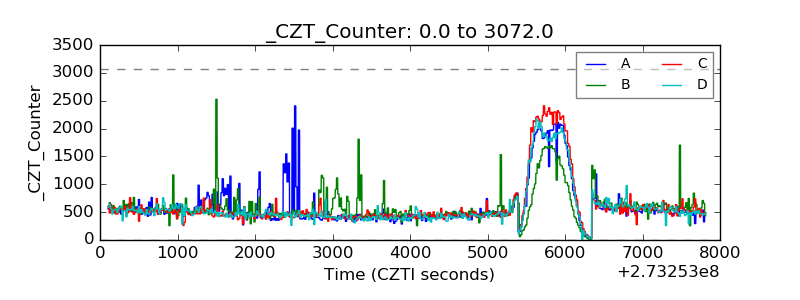 |
| +2.5 Volts monitor |  |
| +5 Volts monitor |  |
| _ROLL_ROT | 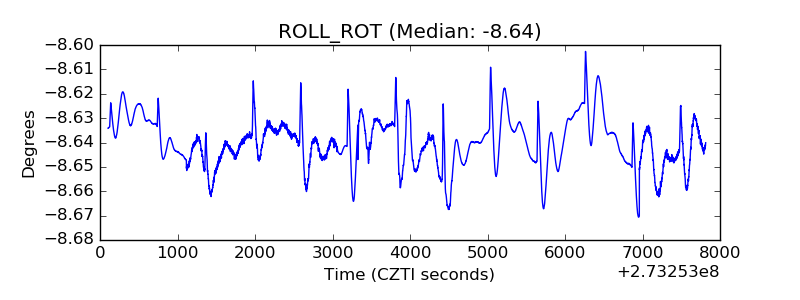 |
| _Roll_DEC | 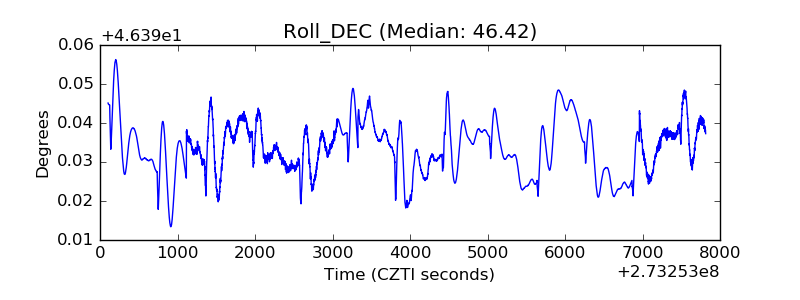 |
| _Roll_RA | 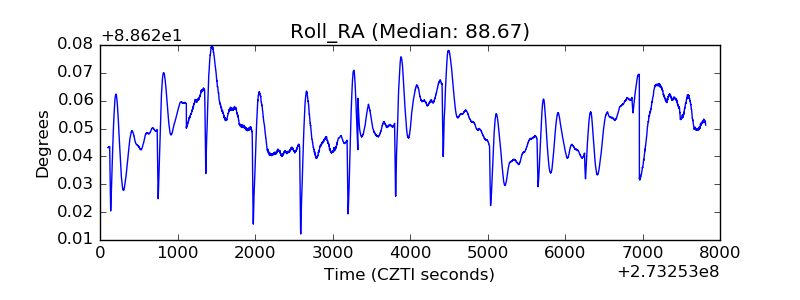 |
| Veto Counter | 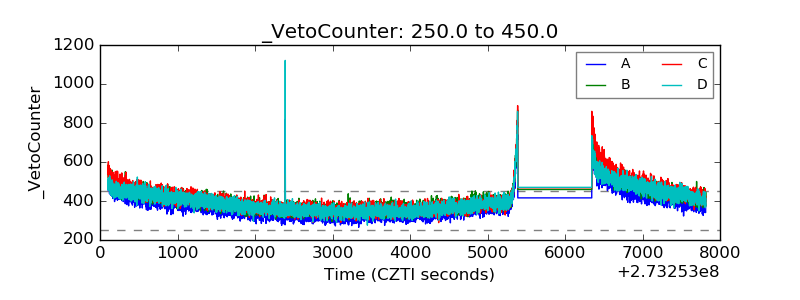 |