| Param | Original file | Final file |
|---|---|---|
| Filename | modeM0/AS1A04_100T01_9000002336_15788cztM0_level2.evt | modeM0/AS1A04_100T01_9000002336_15788cztM0_level2_quad_clean.evt |
| Size (bytes) | 413,519,040 | 69,563,520 |
| Size | 394.4 MB | 66.3 MB |
| Events in quadrant A | 2,847,891 | 421,070 |
| Events in quadrant B | 3,319,937 | 427,316 |
| Events in quadrant C | 2,955,037 | 424,815 |
| Events in quadrant D | 2,993,458 | 414,911 |
| Mode SS | |||
|---|---|---|---|
| Quadrant | BADHDUFLAG | Total packets | Discarded packets |
| A | 0 | 122 | 0 |
| B | 0 | 122 | 0 |
| C | 0 | 122 | 0 |
| D | 0 | 122 | 0 |
| Mode M0 | |||
|---|---|---|---|
| Quadrant | BADHDUFLAG | Total packets | Discarded packets |
| A | 0 | 12492 | 2 |
| B | 0 | 13950 | 1 |
| C | 0 | 12680 | 1 |
| D | 0 | 12962 | 1 |
| Mode M9 | |||
|---|---|---|---|
| Quadrant | BADHDUFLAG | Total packets | Discarded packets |
| A | 0 | 11 | 0 |
| B | 0 | 11 | 0 |
| C | 0 | 11 | 0 |
| D | 0 | 11 | 0 |
| Quadrant | Total seconds | Saturated seconds | Saturation percentage |
|---|---|---|---|
| A | 5985 | 37 | 0.618212% |
| B | 5985 | 74 | 1.236424% |
| C | 5985 | 74 | 1.236424% |
| D | 5985 | 32 | 0.534670% |
Noise dominated data is calculated using 1-second bins in cleaned event files. If a bin has >2000 counts, and if more than 50% of those come from <1% of pixels, then it is considered to be noise-dominated and hence unusable.
| Quadrant | # 1 sec bins | Bins with >0 counts | Bins with >2000 counts | High rate bins dominated by noise | Noise dominated (total time) | Noise dominated (detector-on time) | Marked lightcurve |
|---|---|---|---|---|---|---|---|
| A | 7096 | 5987 | 0 | 0 | 0.00% | 0.00% | 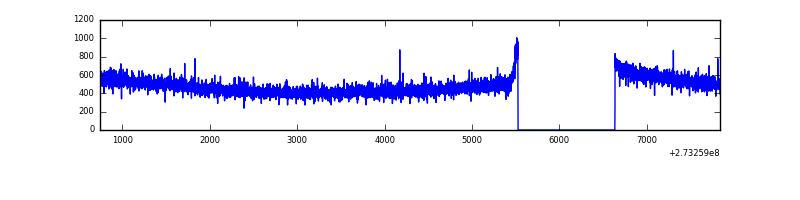 |
| B | 7096 | 5987 | 13 | 13 | 0.18% | 0.22% | 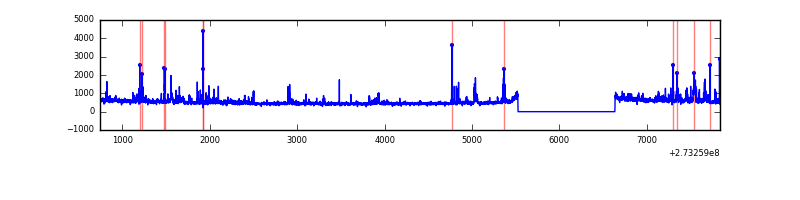 |
| C | 7096 | 5987 | 0 | 0 | 0.00% | 0.00% | 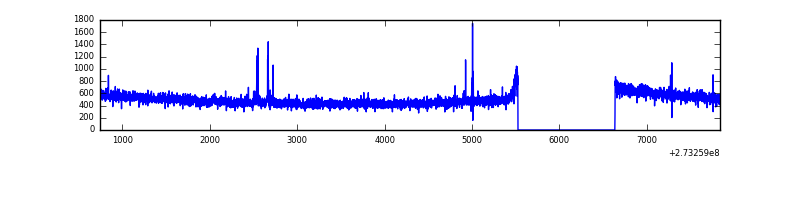 |
| D | 7096 | 5987 | 7 | 7 | 0.10% | 0.12% | 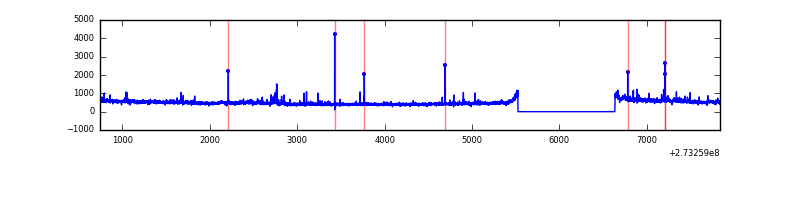 |
Top three noisy pixels from each quadrant. If the there are fewer than three noisy pixels in the level2.evt file, extra rows are filled as -1
| Pixel properties | Quadrant properties | ||||||
|---|---|---|---|---|---|---|---|
| Quadrant | DetID | PixID | Counts | Sigma | Mean | Median | Sigma |
| A | 0 | 226 | 6757 | 40.11 | 739 | 724 | 150.4 |
| A | 15 | 239 | 6742 | 40.01 | 739 | 724 | 150.4 |
| A | 12 | 194 | 5561 | 32.15 | 739 | 724 | 150.4 |
| B | 7 | 220 | 99907 | 709.69 | 742 | 724 | 139.8 |
| B | 4 | 173 | 88985 | 631.54 | 742 | 724 | 139.8 |
| B | 5 | 65 | 55395 | 391.19 | 742 | 724 | 139.8 |
| C | 14 | 238 | 111082 | 659.66 | 718 | 724 | 167.3 |
| C | 10 | 22 | 29418 | 171.52 | 718 | 724 | 167.3 |
| C | 3 | 233 | 6953 | 37.23 | 718 | 724 | 167.3 |
| D | 1 | 52 | 91557 | 510.6 | 726 | 705 | 177.9 |
| D | 2 | 152 | 58677 | 325.81 | 726 | 705 | 177.9 |
| D | 2 | 234 | 25409 | 138.84 | 726 | 705 | 177.9 |
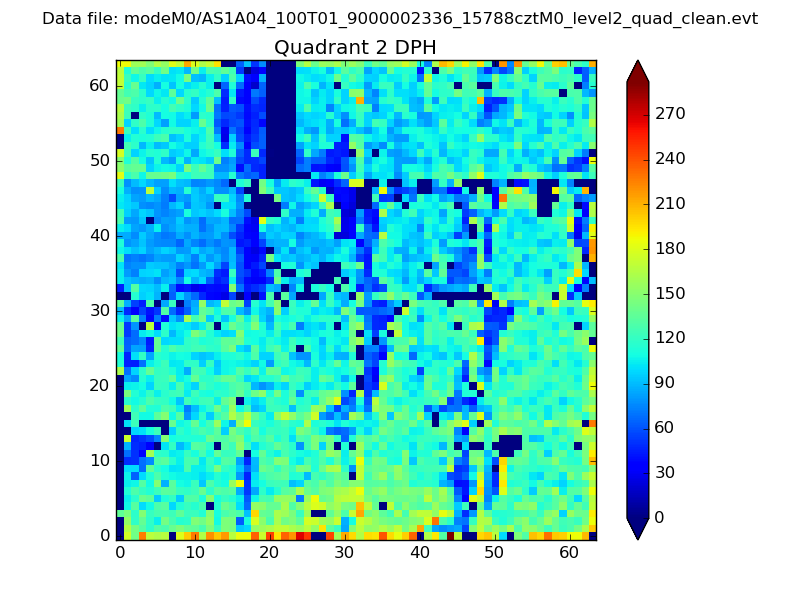
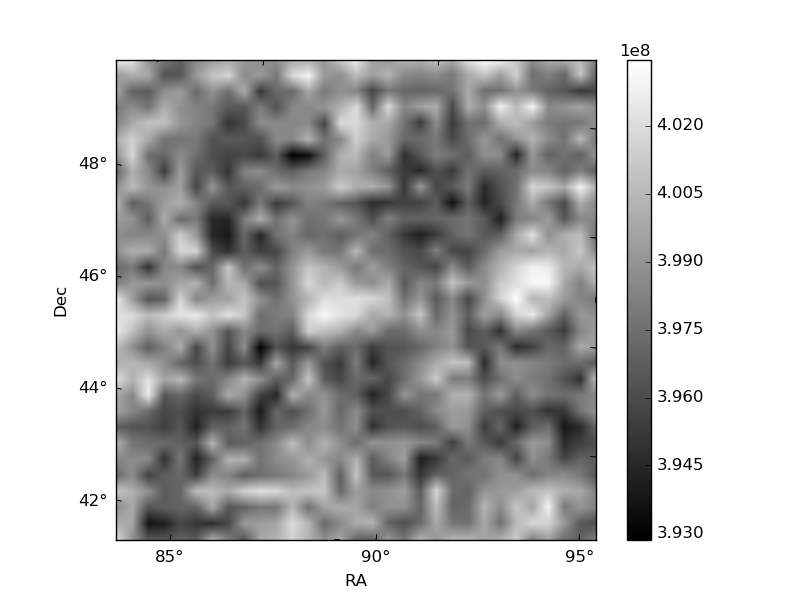
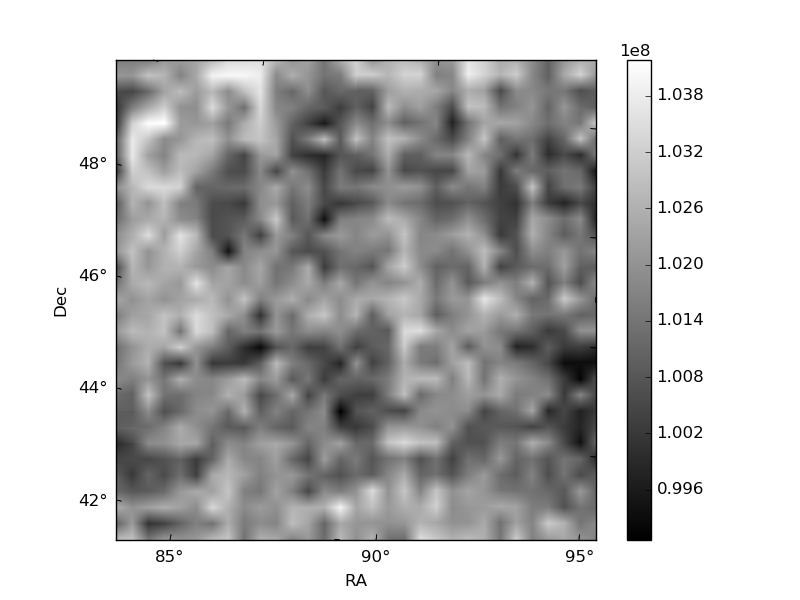
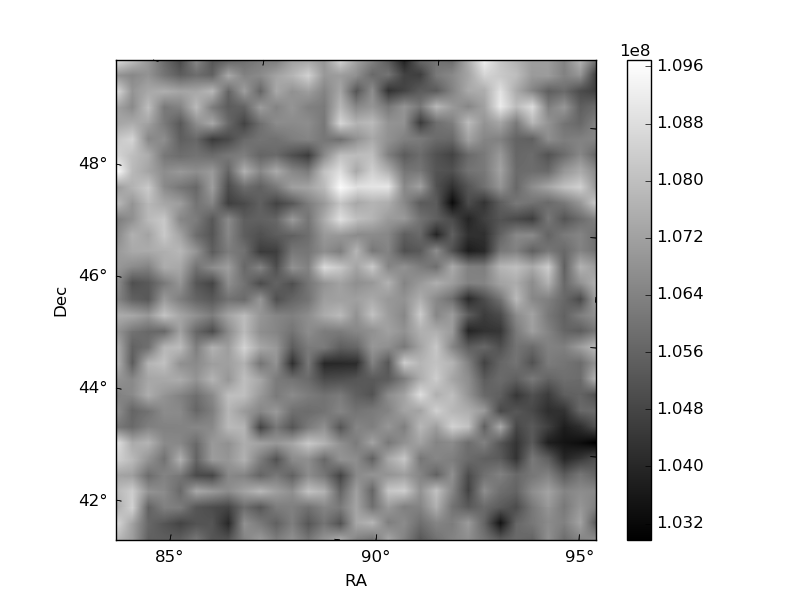
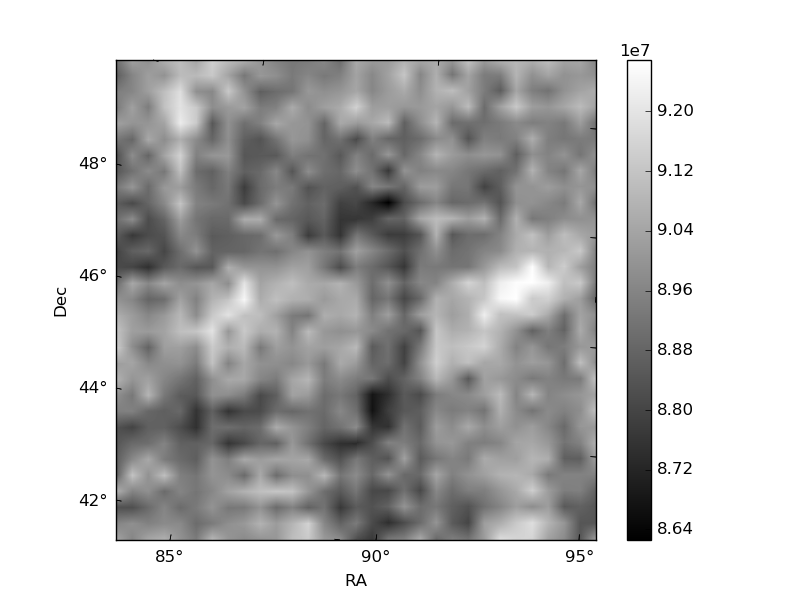
Histogram calculated using DETX and DETY for each event in the final _common_clean file
| Quadrant A | 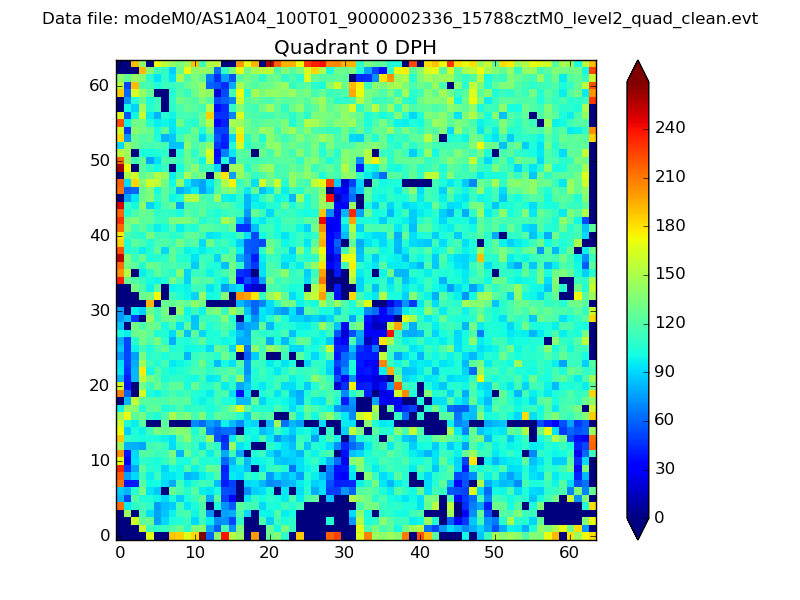 |
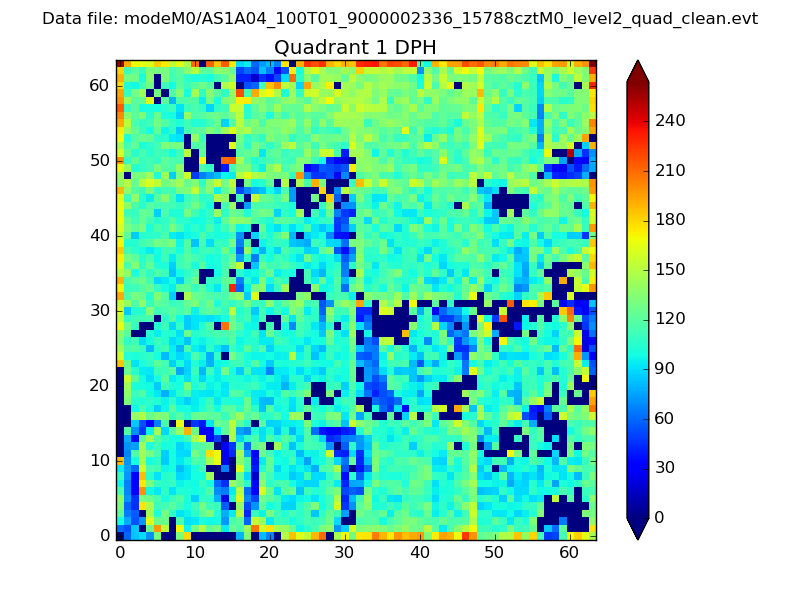 |
Quadrant B |
|---|---|---|---|
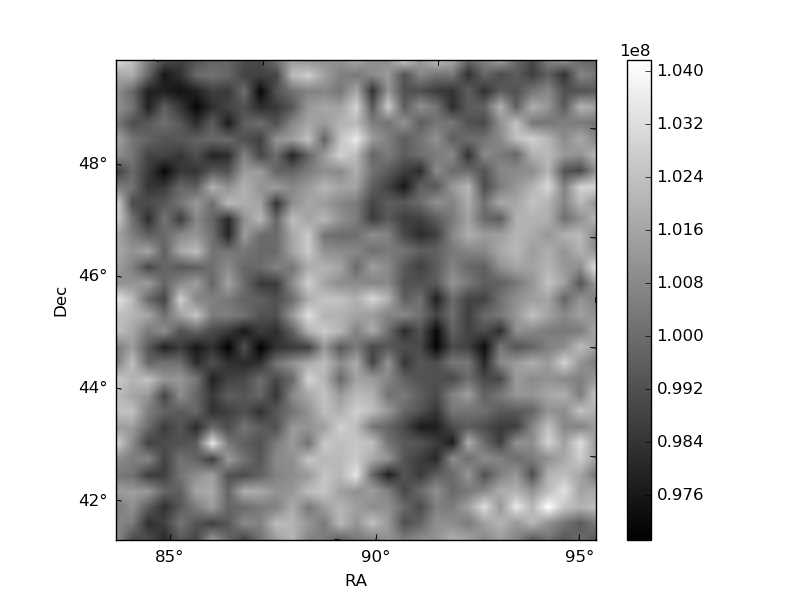
| Quadrant D | 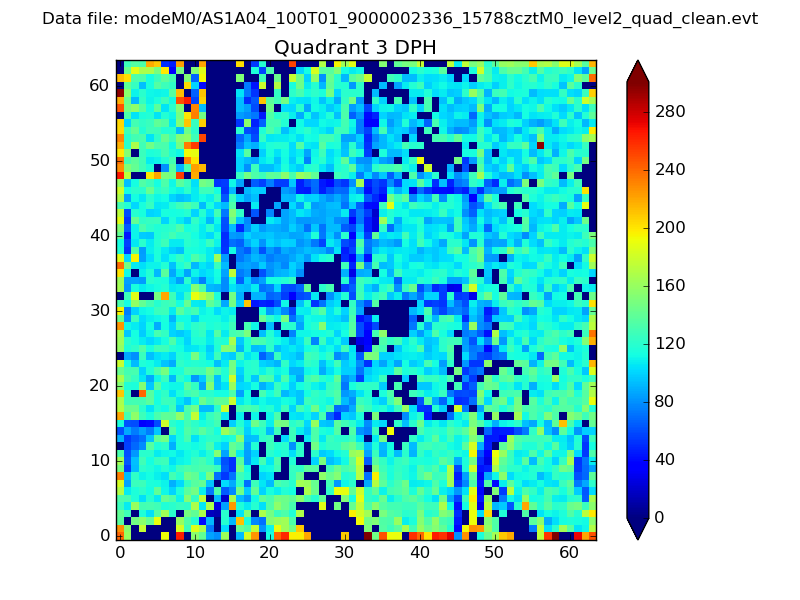 |
 |
Quadrant C |
| Plot type | Count rate plots | Images |
|---|---|---|
| Comparison with Poisson distribution Blue bars denote a histogram of data divided into 1 sec bins. Red curve is a Poisson curve with rate = median count rate of data. |
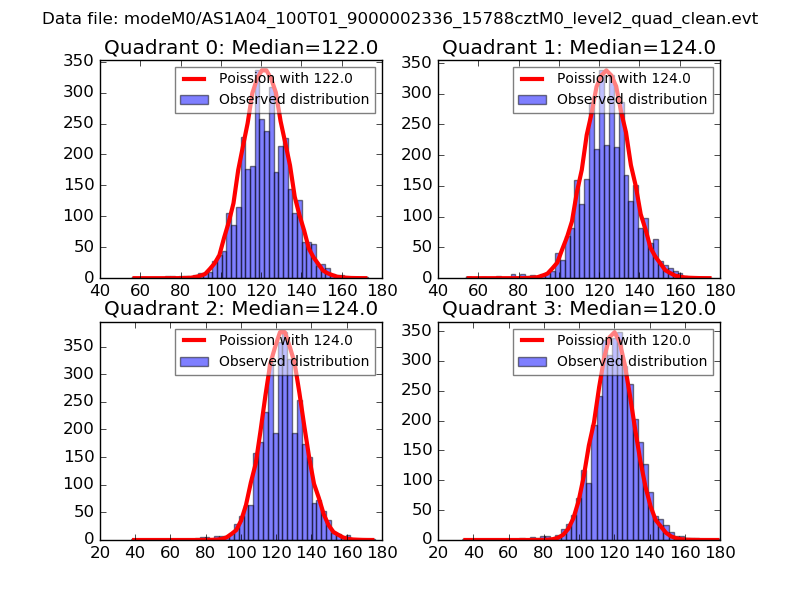 |
 |
| Quadrant-wise count rates Data is divided into 100 sec bins |
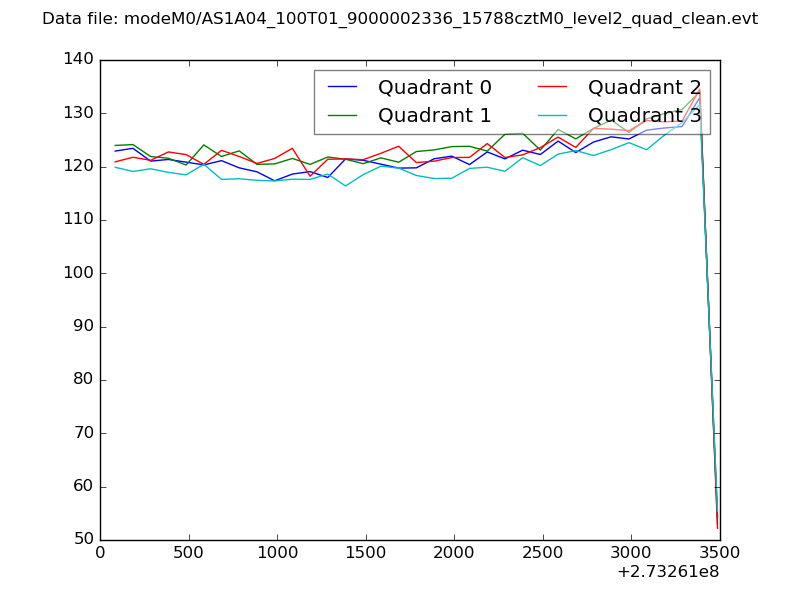 |
|
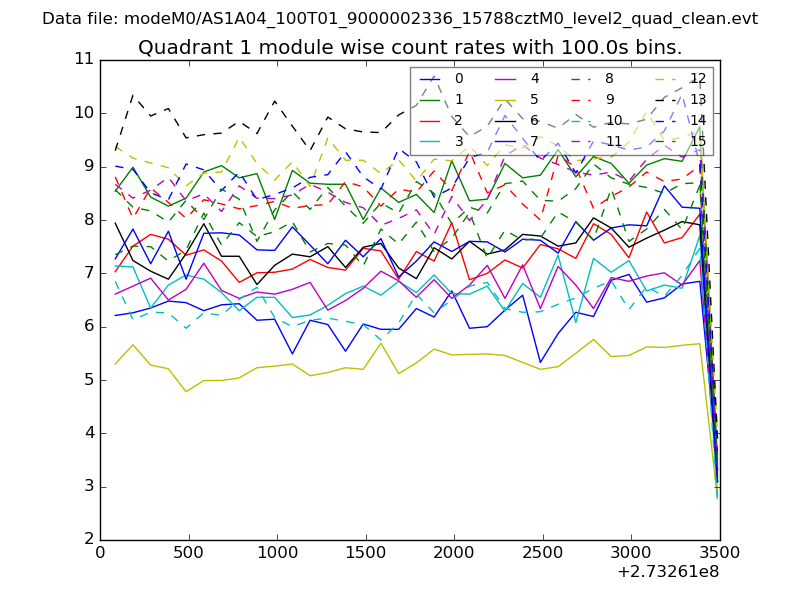
| Module-wise count rates for Quadrant A Data is divided into 100 sec bins |
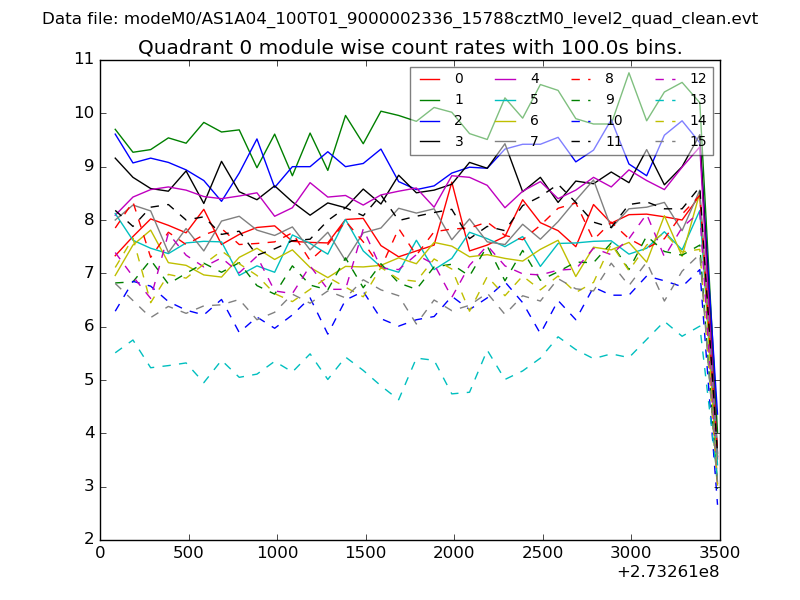 |
 |
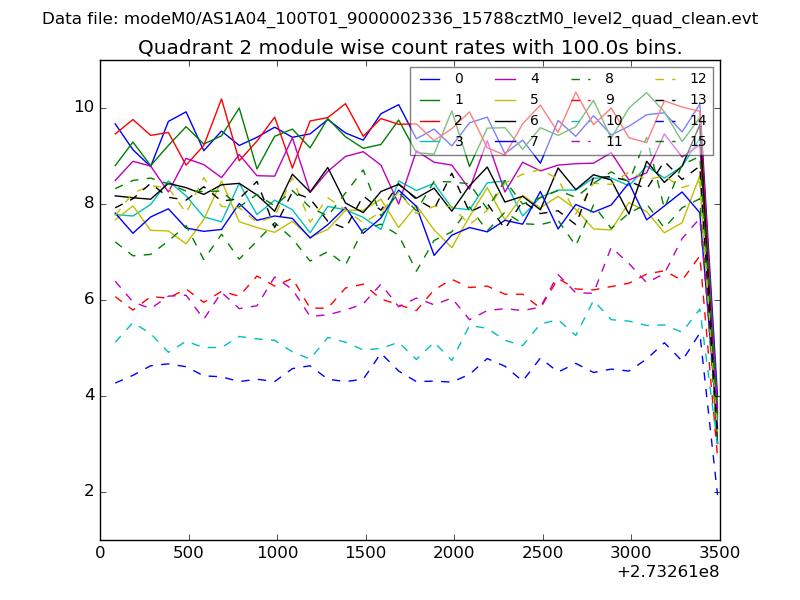
| Module-wise count rates for Quadrant B Data is divided into 100 sec bins |
 |
 |
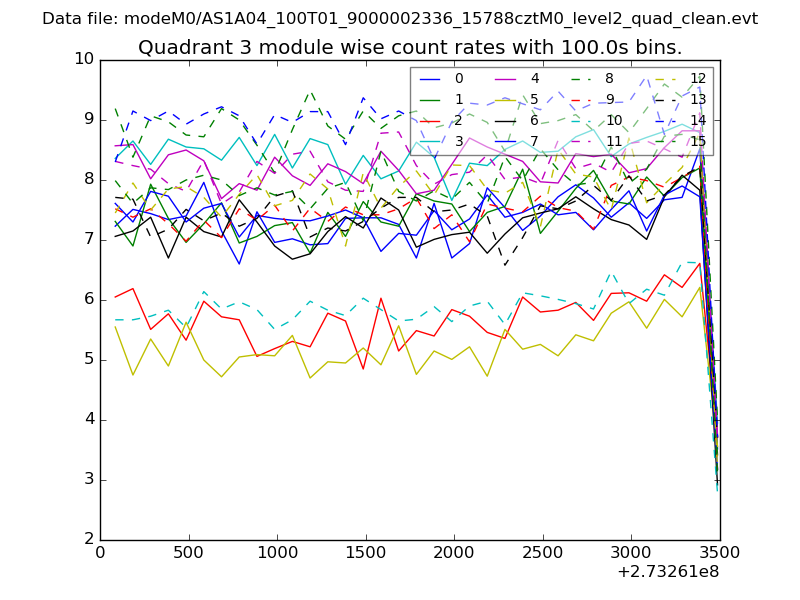
| Module-wise count rates for Quadrant C Data is divided into 100 sec bins |
 |
 |
| Module-wise count rates for Quadrant D Data is divided into 100 sec bins |
 |
 |
| Parameter | Plot |
|---|---|
| CZT HV Monitor |  |
| D_VDD | 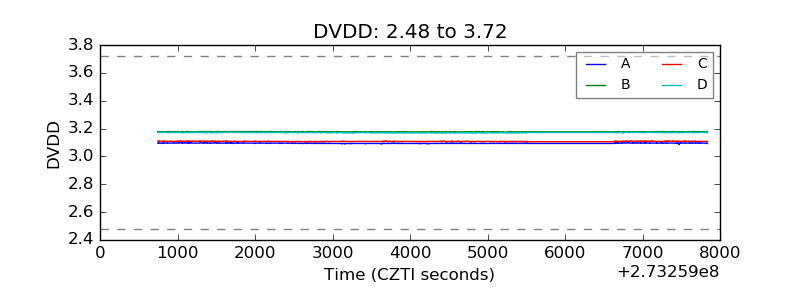 |
| Temperature 1 | 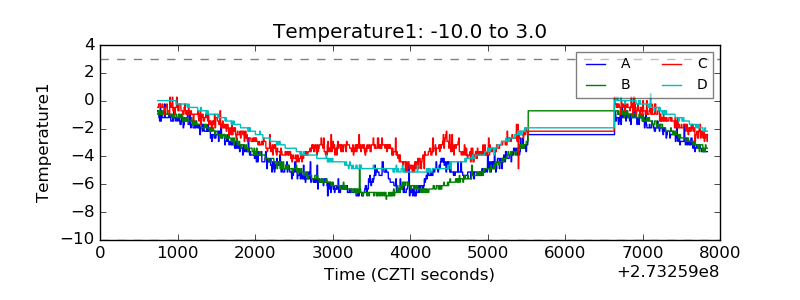 |
| Veto HV Monitor | 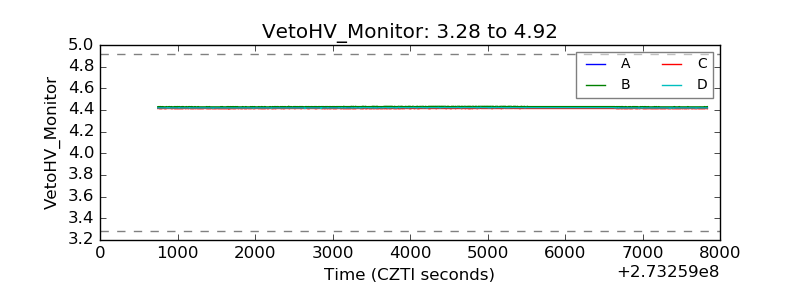 |
| Veto LLD | 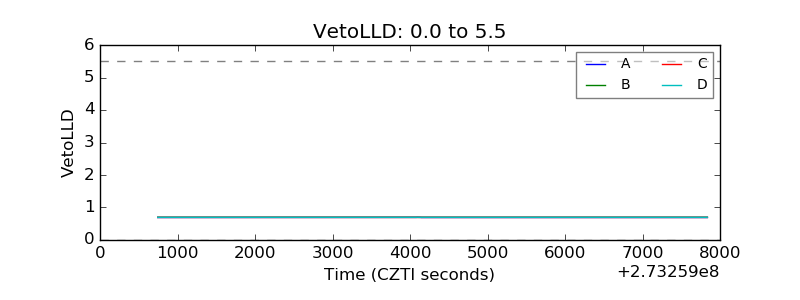 |
| Alpha Counter | 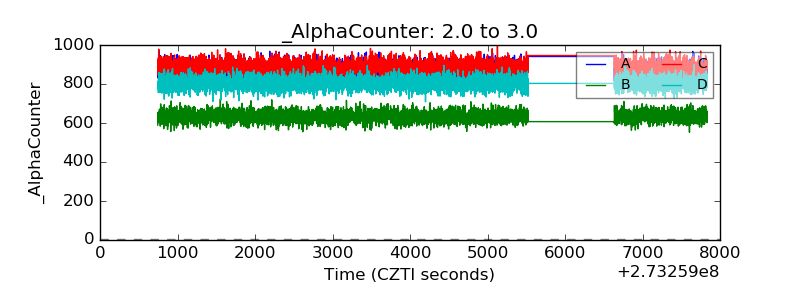 |
| _CPM_Rate | 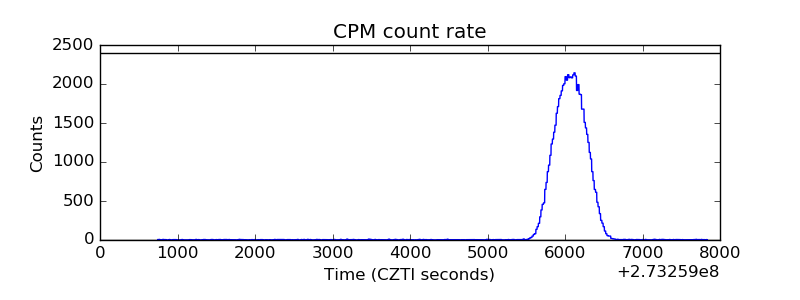 |
| CZT Counter | 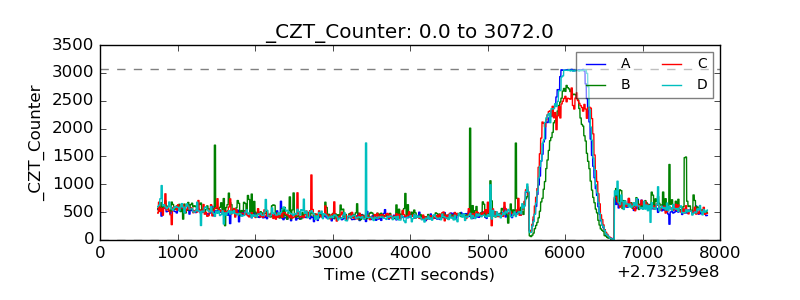 |
| +2.5 Volts monitor |  |
| +5 Volts monitor |  |
| _ROLL_ROT | 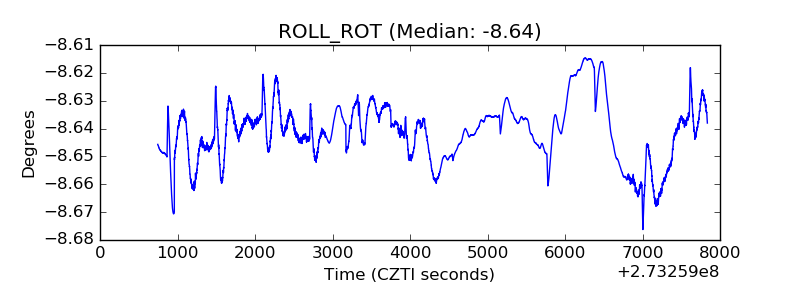 |
| _Roll_DEC |  |
| _Roll_RA | 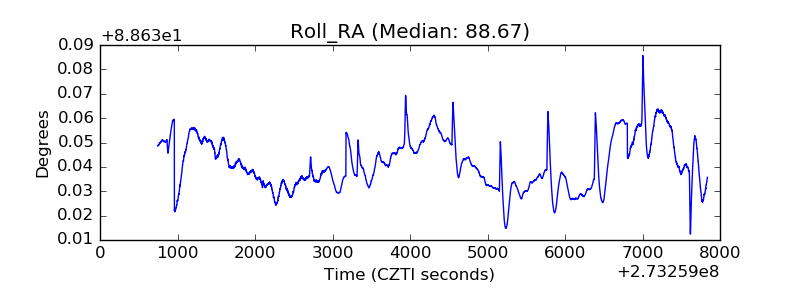 |
| Veto Counter |  |