| Param | Original file | Final file |
|---|---|---|
| Filename | modeM0/AS1A04_100T01_9000002336_15789cztM0_level2.evt | modeM0/AS1A04_100T01_9000002336_15789cztM0_level2_quad_clean.evt |
| Size (bytes) | 464,794,560 | 83,396,160 |
| Size | 443.3 MB | 79.5 MB |
| Events in quadrant A | 3,091,150 | 517,999 |
| Events in quadrant B | 3,925,062 | 528,102 |
| Events in quadrant C | 3,298,022 | 526,953 |
| Events in quadrant D | 3,338,681 | 516,969 |
| Mode SS | |||
|---|---|---|---|
| Quadrant | BADHDUFLAG | Total packets | Discarded packets |
| A | 0 | 126 | 0 |
| B | 0 | 126 | 0 |
| C | 0 | 126 | 0 |
| D | 0 | 126 | 0 |
| Mode M0 | |||
|---|---|---|---|
| Quadrant | BADHDUFLAG | Total packets | Discarded packets |
| A | 0 | 13437 | 3 |
| B | 0 | 15872 | 2 |
| C | 0 | 14070 | 2 |
| D | 0 | 14177 | 2 |
| Mode M9 | |||
|---|---|---|---|
| Quadrant | BADHDUFLAG | Total packets | Discarded packets |
| A | 0 | 21 | 0 |
| B | 0 | 21 | 0 |
| C | 0 | 21 | 0 |
| D | 0 | 22 | 0 |
| Quadrant | Total seconds | Saturated seconds | Saturation percentage |
|---|---|---|---|
| A | 6240 | 42 | 0.673077% |
| B | 6240 | 185 | 2.964744% |
| C | 6240 | 101 | 1.618590% |
| D | 6240 | 57 | 0.913462% |
Noise dominated data is calculated using 1-second bins in cleaned event files. If a bin has >2000 counts, and if more than 50% of those come from <1% of pixels, then it is considered to be noise-dominated and hence unusable.
| Quadrant | # 1 sec bins | Bins with >0 counts | Bins with >2000 counts | High rate bins dominated by noise | Noise dominated (total time) | Noise dominated (detector-on time) | Marked lightcurve |
|---|---|---|---|---|---|---|---|
| A | 7436 | 6242 | 4 | 4 | 0.05% | 0.06% | 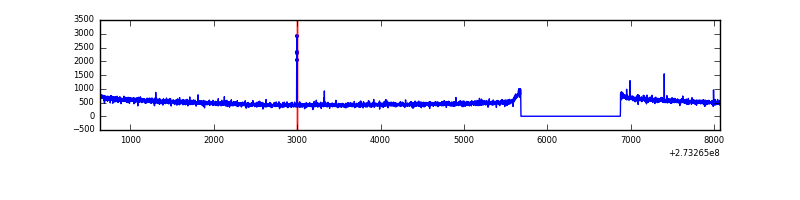 |
| B | 7436 | 6242 | 66 | 66 | 0.89% | 1.06% | 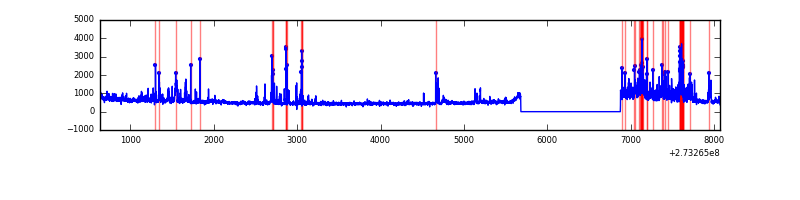 |
| C | 7436 | 6242 | 0 | 0 | 0.00% | 0.00% | 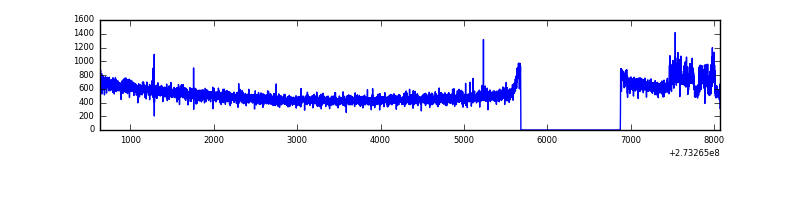 |
| D | 7436 | 6242 | 7 | 7 | 0.09% | 0.11% | 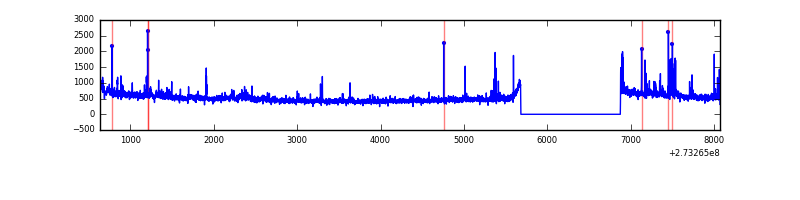 |
Top three noisy pixels from each quadrant. If the there are fewer than three noisy pixels in the level2.evt file, extra rows are filled as -1
| Pixel properties | Quadrant properties | ||||||
|---|---|---|---|---|---|---|---|
| Quadrant | DetID | PixID | Counts | Sigma | Mean | Median | Sigma |
| A | 15 | 69 | 11225 | 64.67 | 798 | 783 | 161.5 |
| A | 15 | 239 | 10109 | 57.76 | 798 | 783 | 161.5 |
| A | 0 | 226 | 7362 | 40.75 | 798 | 783 | 161.5 |
| B | 10 | 245 | 251632 | 1691.94 | 799 | 780 | 148.3 |
| B | 4 | 251 | 194628 | 1307.46 | 799 | 780 | 148.3 |
| B | 7 | 220 | 144661 | 970.45 | 799 | 780 | 148.3 |
| C | 14 | 238 | 120706 | 659.71 | 782 | 788 | 181.8 |
| C | 7 | 247 | 118556 | 647.89 | 782 | 788 | 181.8 |
| C | 13 | 61 | 5529 | 26.08 | 782 | 788 | 181.8 |
| D | 1 | 52 | 162617 | 778.5 | 783 | 768 | 207.9 |
| D | 2 | 152 | 72658 | 345.79 | 783 | 768 | 207.9 |
| D | 10 | 40 | 61107 | 290.23 | 783 | 768 | 207.9 |
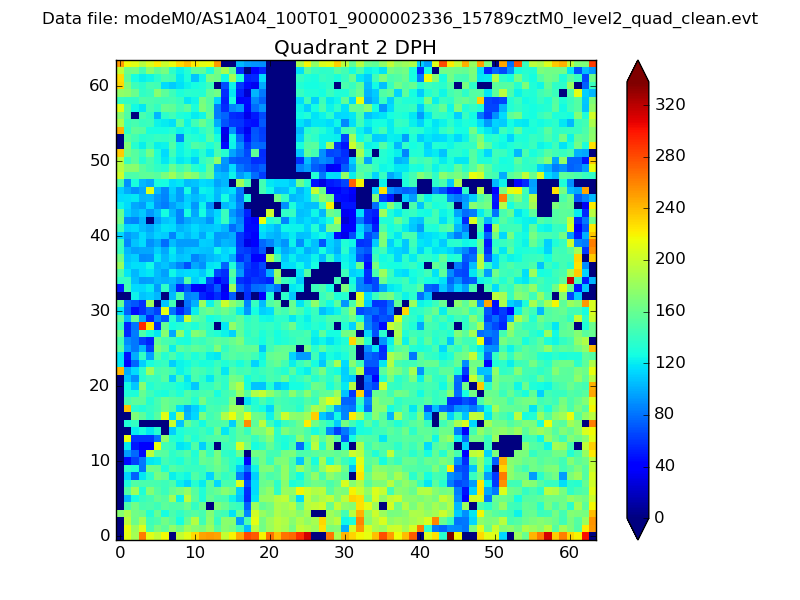
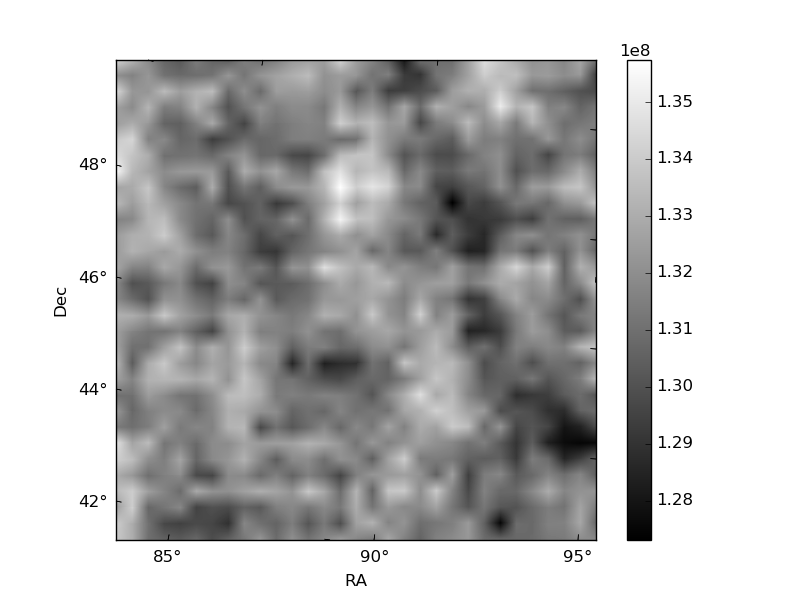
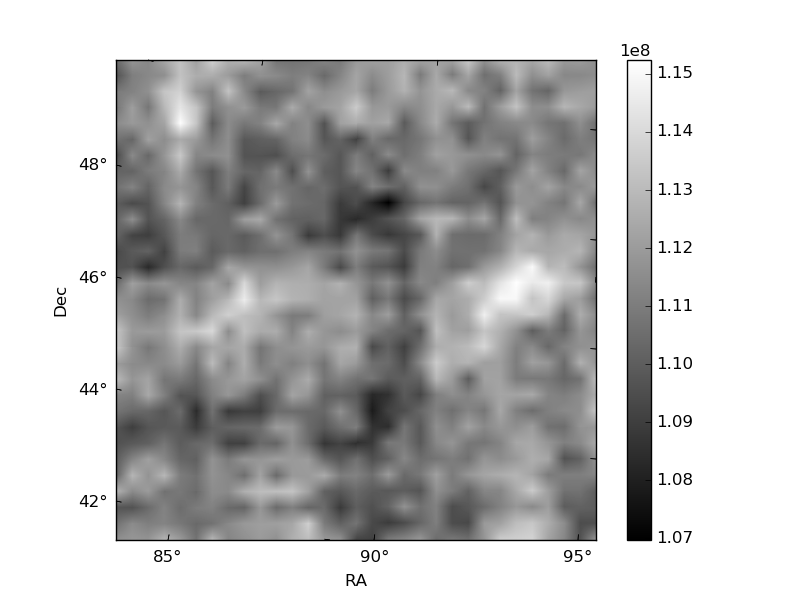
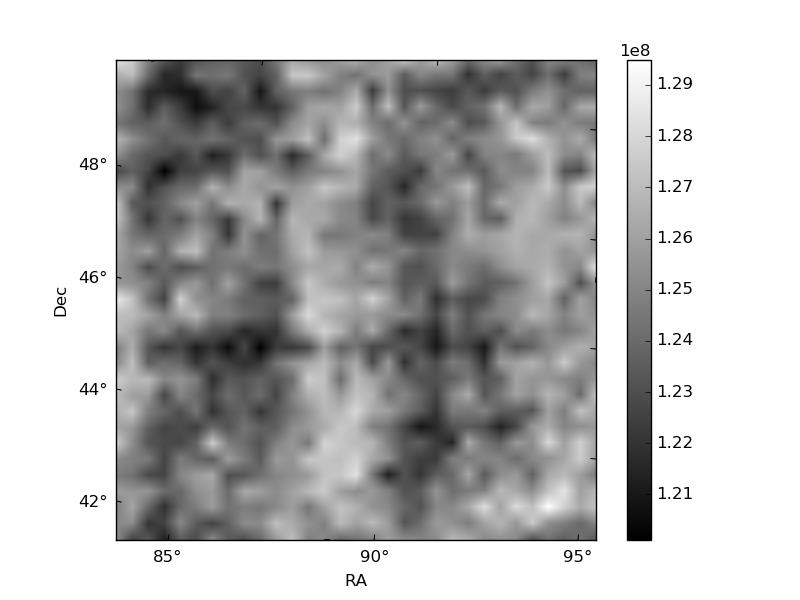
Histogram calculated using DETX and DETY for each event in the final _common_clean file
| Quadrant A | 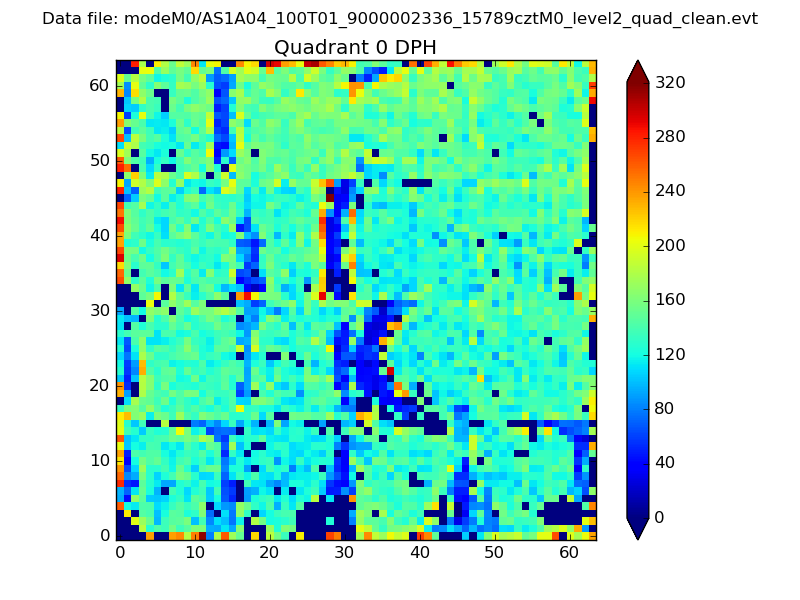 |
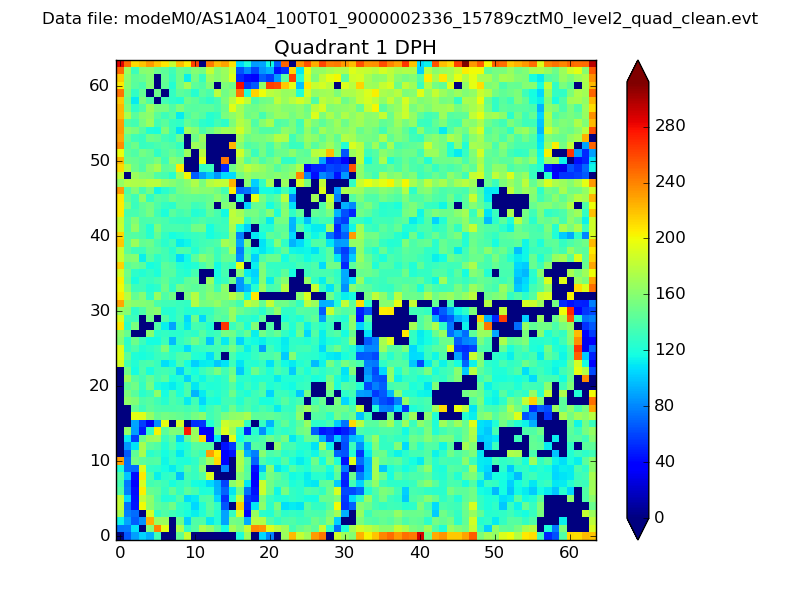 |
Quadrant B |
|---|---|---|---|
| Quadrant D | 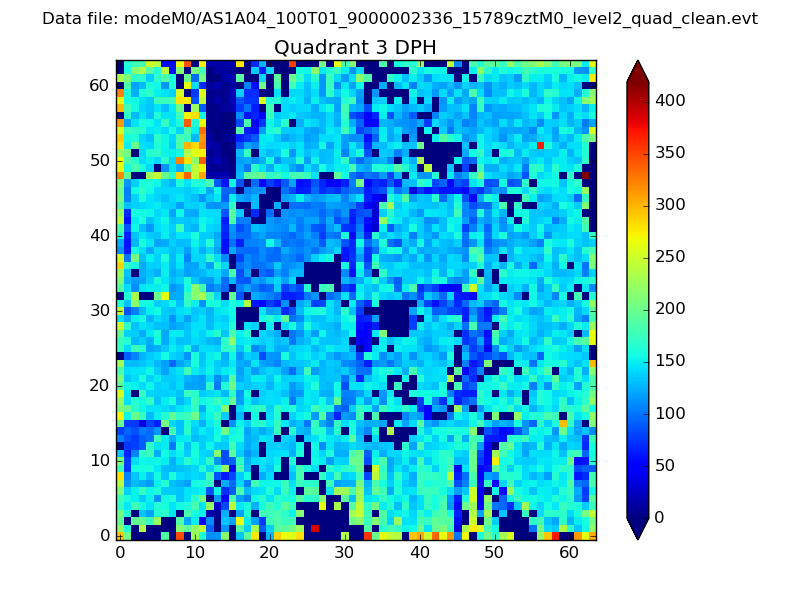 |
 |
Quadrant C |
| Plot type | Count rate plots | Images |
|---|---|---|
| Comparison with Poisson distribution Blue bars denote a histogram of data divided into 1 sec bins. Red curve is a Poisson curve with rate = median count rate of data. |
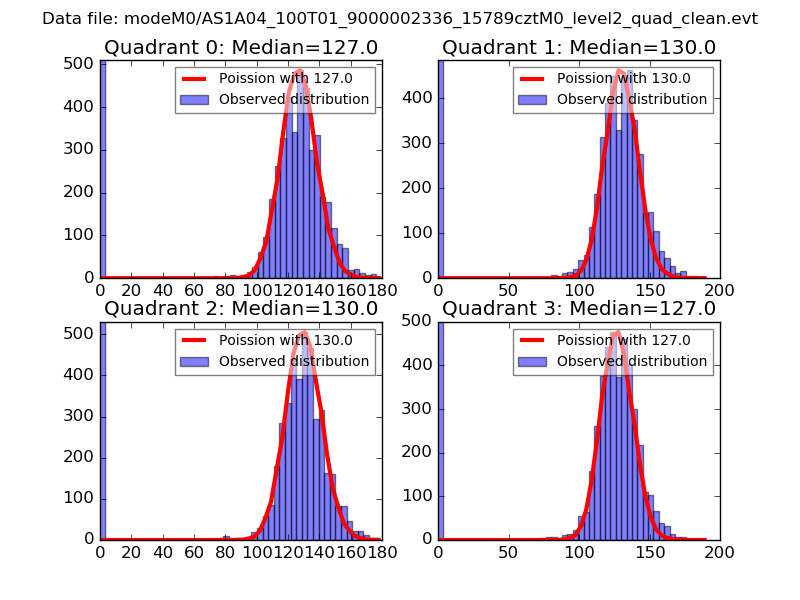 |
 |
| Quadrant-wise count rates Data is divided into 100 sec bins |
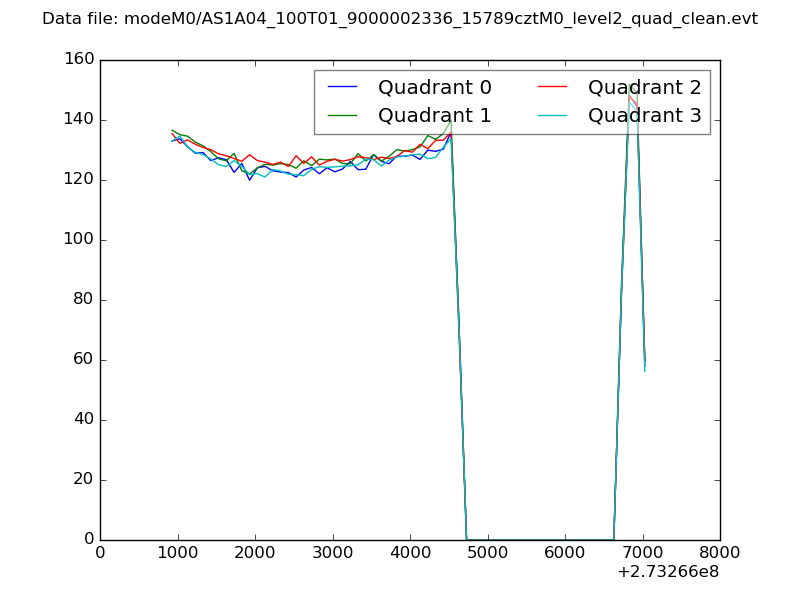 |
|
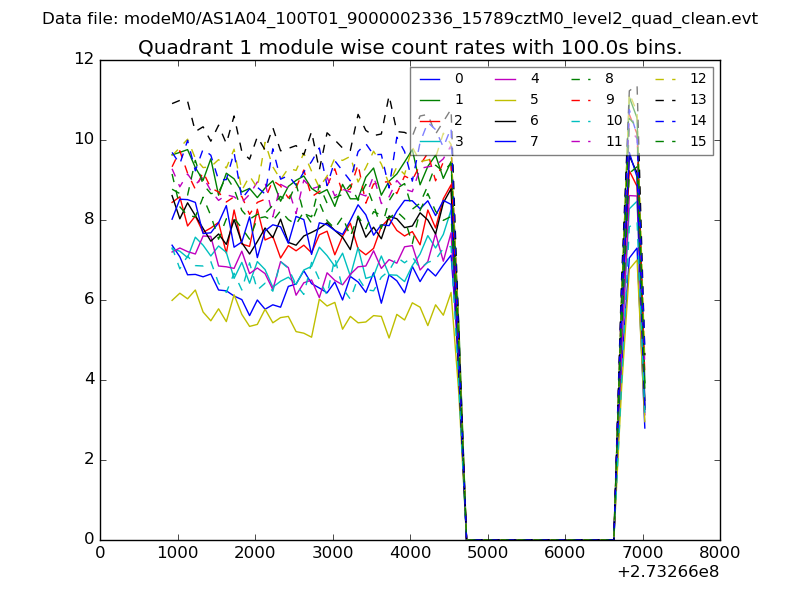
| Module-wise count rates for Quadrant A Data is divided into 100 sec bins |
 |
 |
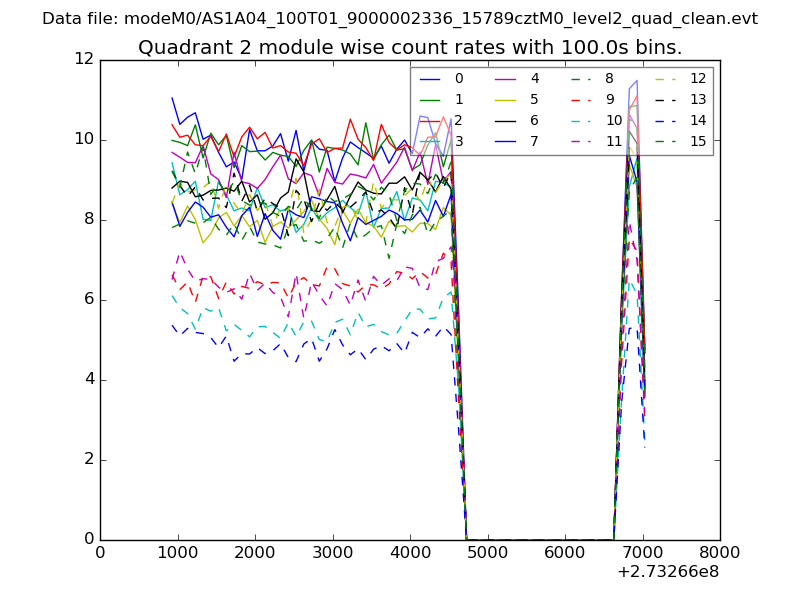
| Module-wise count rates for Quadrant B Data is divided into 100 sec bins |
 |
 |
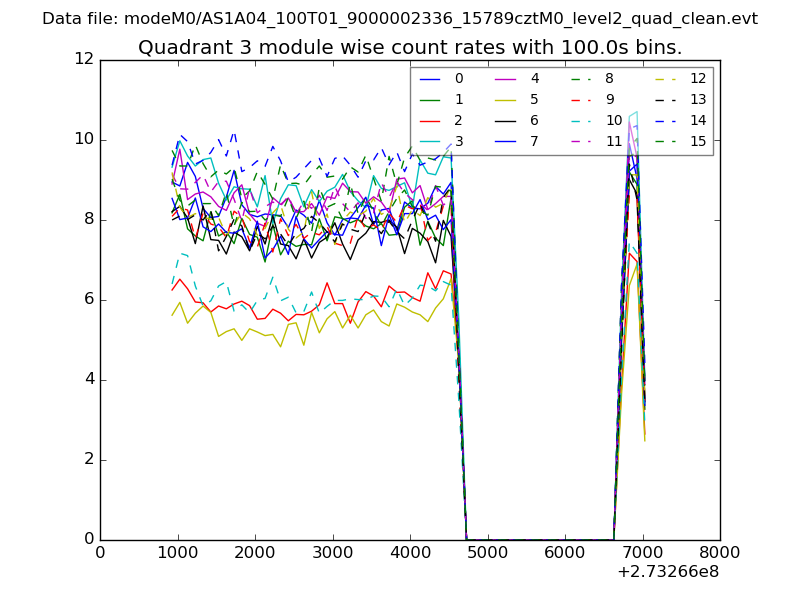
| Module-wise count rates for Quadrant C Data is divided into 100 sec bins |
 |
 |
| Module-wise count rates for Quadrant D Data is divided into 100 sec bins |
 |
 |
| Parameter | Plot |
|---|---|
| CZT HV Monitor | 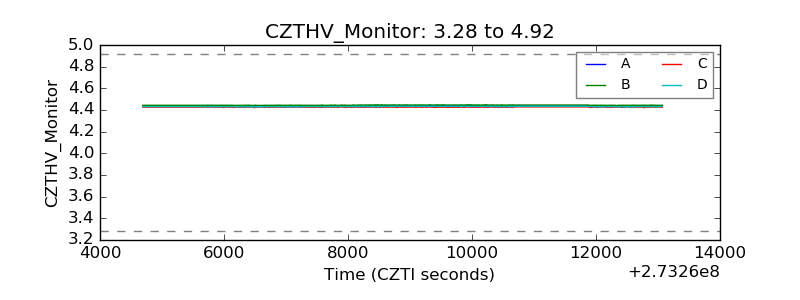 |
| D_VDD | 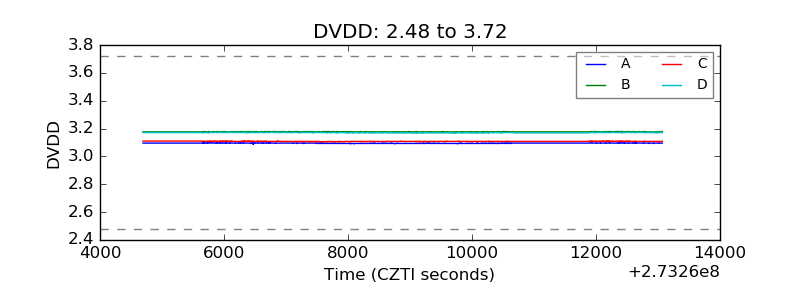 |
| Temperature 1 | 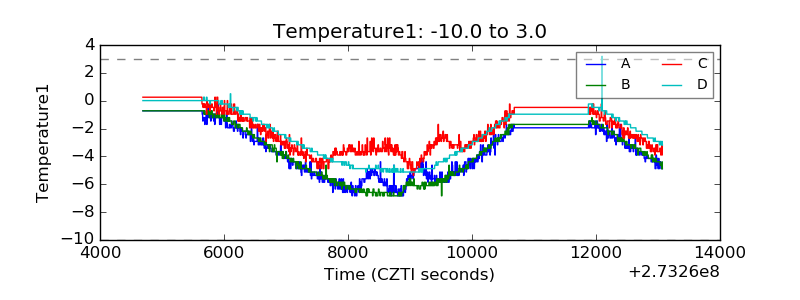 |
| Veto HV Monitor | 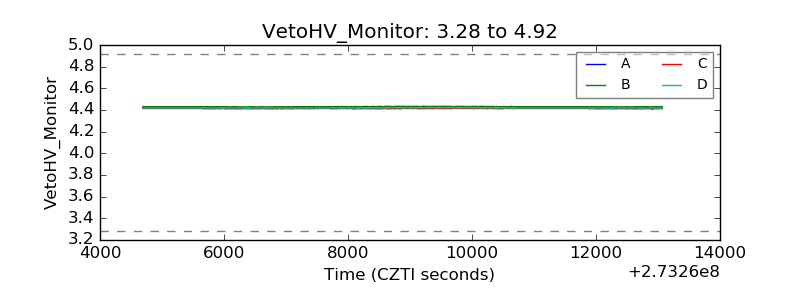 |
| Veto LLD | 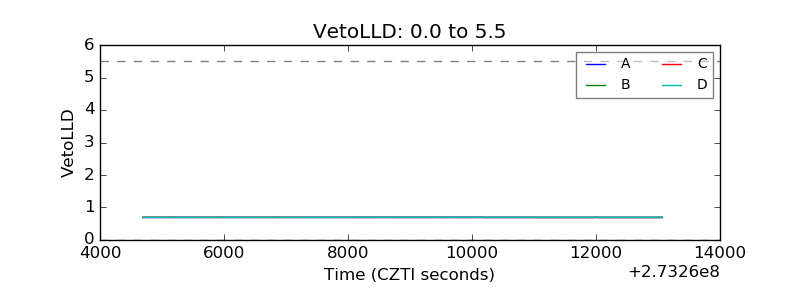 |
| Alpha Counter | 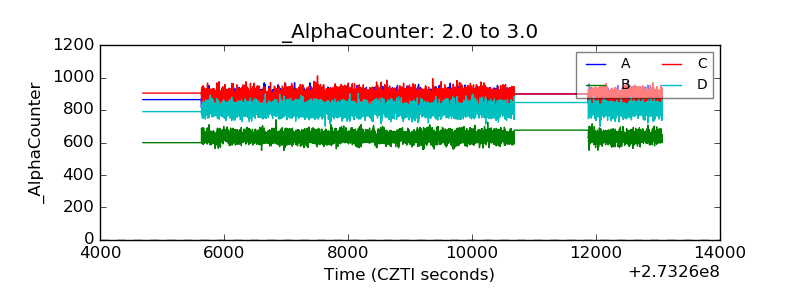 |
| _CPM_Rate | 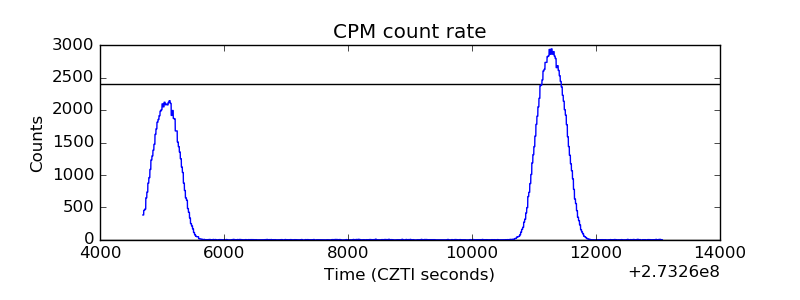 |
| CZT Counter | 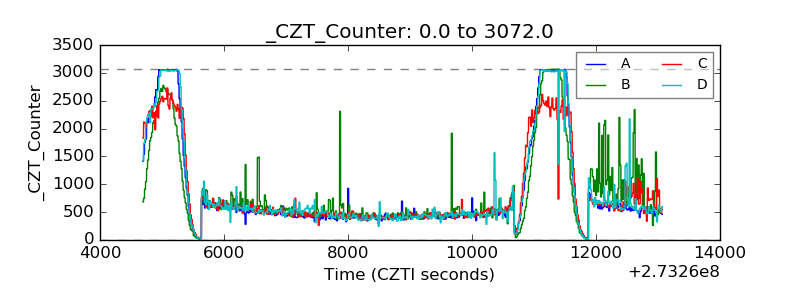 |
| +2.5 Volts monitor |  |
| +5 Volts monitor |  |
| _ROLL_ROT |  |
| _Roll_DEC | 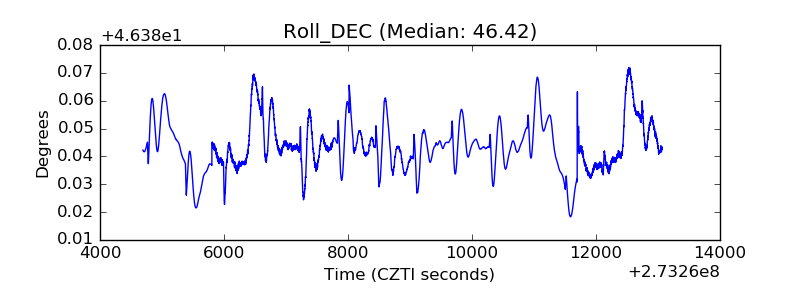 |
| _Roll_RA | 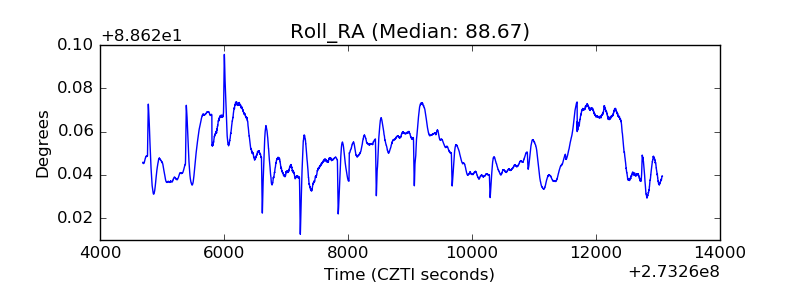 |
| Veto Counter | 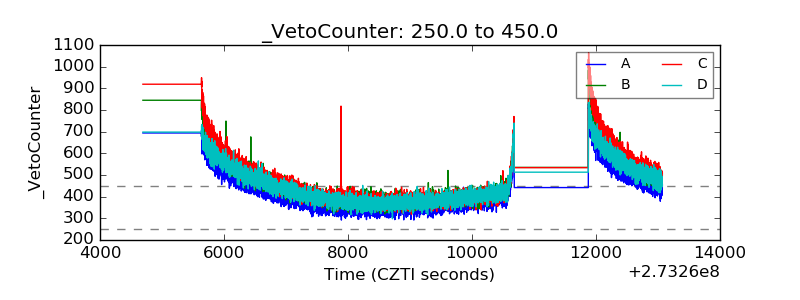 |