| Param | Original file | Final file |
|---|---|---|
| Filename | modeM0/AS1A04_100T01_9000002336_15790cztM0_level2.evt | modeM0/AS1A04_100T01_9000002336_15790cztM0_level2_quad_clean.evt |
| Size (bytes) | 475,320,960 | 96,768,000 |
| Size | 453.3 MB | 92.3 MB |
| Events in quadrant A | 3,184,846 | 616,391 |
| Events in quadrant B | 4,020,486 | 633,019 |
| Events in quadrant C | 3,438,345 | 629,840 |
| Events in quadrant D | 3,326,635 | 614,714 |
| Mode SS | |||
|---|---|---|---|
| Quadrant | BADHDUFLAG | Total packets | Discarded packets |
| A | 0 | 128 | 0 |
| B | 0 | 128 | 0 |
| C | 0 | 128 | 0 |
| D | 0 | 128 | 0 |
| Mode M0 | |||
|---|---|---|---|
| Quadrant | BADHDUFLAG | Total packets | Discarded packets |
| A | 0 | 13611 | 3 |
| B | 0 | 16045 | 2 |
| C | 0 | 14433 | 2 |
| D | 0 | 14138 | 2 |
| Mode M9 | |||
|---|---|---|---|
| Quadrant | BADHDUFLAG | Total packets | Discarded packets |
| A | 0 | 19 | 0 |
| B | 0 | 19 | 0 |
| C | 0 | 19 | 0 |
| D | 0 | 20 | 0 |
| Quadrant | Total seconds | Saturated seconds | Saturation percentage |
|---|---|---|---|
| A | 6253 | 53 | 0.847593% |
| B | 6253 | 207 | 3.310411% |
| C | 6253 | 113 | 1.807133% |
| D | 6253 | 98 | 1.567248% |
Noise dominated data is calculated using 1-second bins in cleaned event files. If a bin has >2000 counts, and if more than 50% of those come from <1% of pixels, then it is considered to be noise-dominated and hence unusable.
| Quadrant | # 1 sec bins | Bins with >0 counts | Bins with >2000 counts | High rate bins dominated by noise | Noise dominated (total time) | Noise dominated (detector-on time) | Marked lightcurve |
|---|---|---|---|---|---|---|---|
| A | 7549 | 6255 | 2 | 2 | 0.03% | 0.03% | 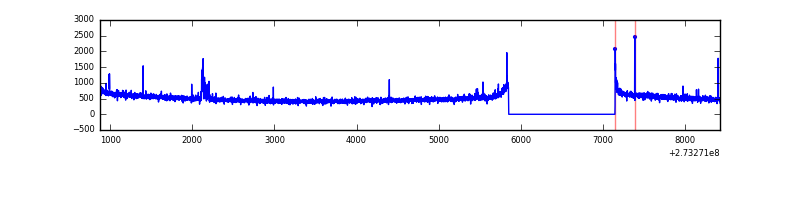 |
| B | 7549 | 6255 | 67 | 67 | 0.89% | 1.07% | 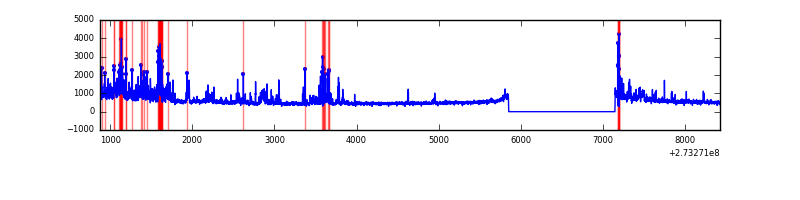 |
| C | 7549 | 6255 | 0 | 0 | 0.00% | 0.00% | 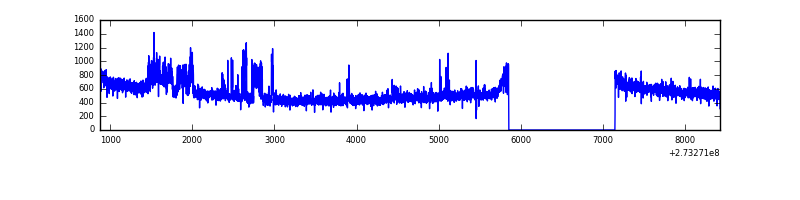 |
| D | 7549 | 6255 | 24 | 24 | 0.32% | 0.38% | 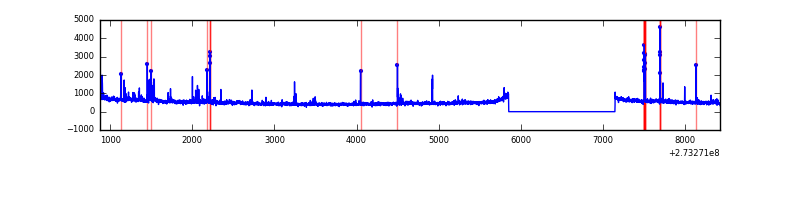 |
Top three noisy pixels from each quadrant. If the there are fewer than three noisy pixels in the level2.evt file, extra rows are filled as -1
| Pixel properties | Quadrant properties | ||||||
|---|---|---|---|---|---|---|---|
| Quadrant | DetID | PixID | Counts | Sigma | Mean | Median | Sigma |
| A | 15 | 239 | 48940 | 298.57 | 804 | 789 | 161.3 |
| A | 14 | 254 | 32983 | 199.63 | 804 | 789 | 161.3 |
| A | 0 | 226 | 7309 | 40.43 | 804 | 789 | 161.3 |
| B | 10 | 245 | 392518 | 2626.73 | 809 | 791 | 149.1 |
| B | 4 | 251 | 190786 | 1274.02 | 809 | 791 | 149.1 |
| B | 7 | 220 | 113292 | 754.38 | 809 | 791 | 149.1 |
| C | 7 | 247 | 205978 | 1121.45 | 793 | 800 | 183.0 |
| C | 14 | 238 | 123599 | 671.19 | 793 | 800 | 183.0 |
| C | 10 | 22 | 12781 | 65.49 | 793 | 800 | 183.0 |
| D | 1 | 52 | 155771 | 783.81 | 791 | 774 | 197.7 |
| D | 2 | 152 | 57232 | 285.5 | 791 | 774 | 197.7 |
| D | 10 | 40 | 51814 | 258.11 | 791 | 774 | 197.7 |
Histogram calculated using DETX and DETY for each event in the final _common_clean file
| Quadrant A | 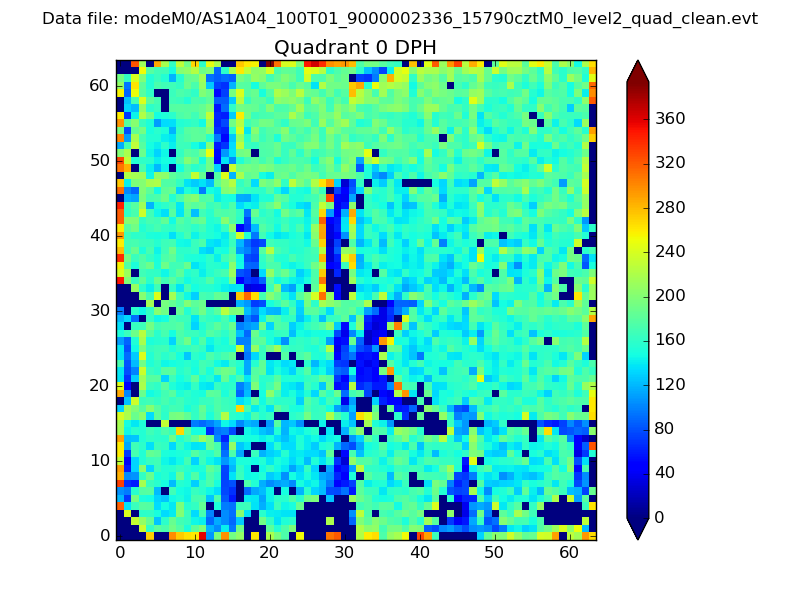 |
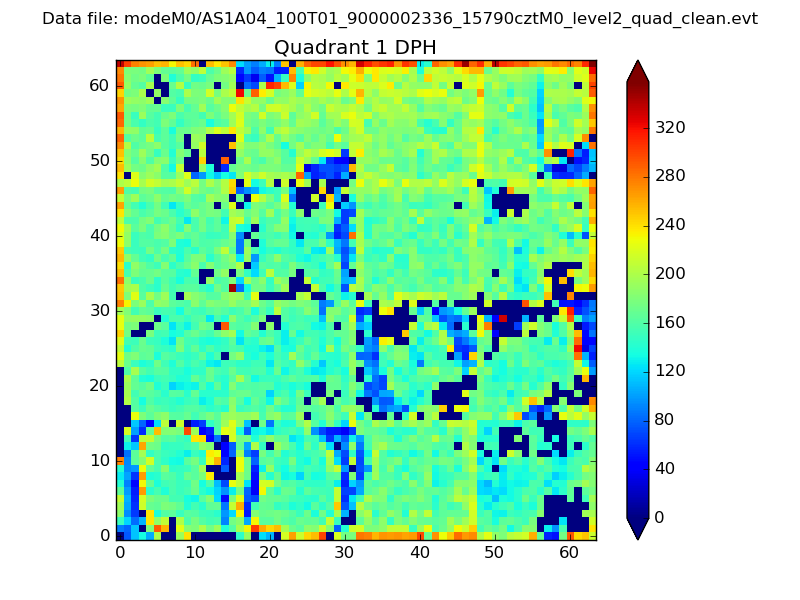 |
Quadrant B |
|---|---|---|---|
| Quadrant D | 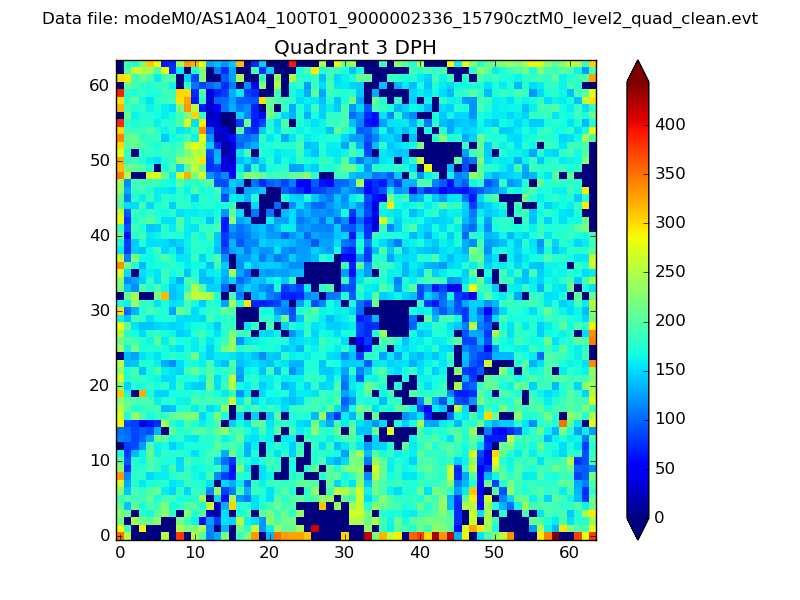 |
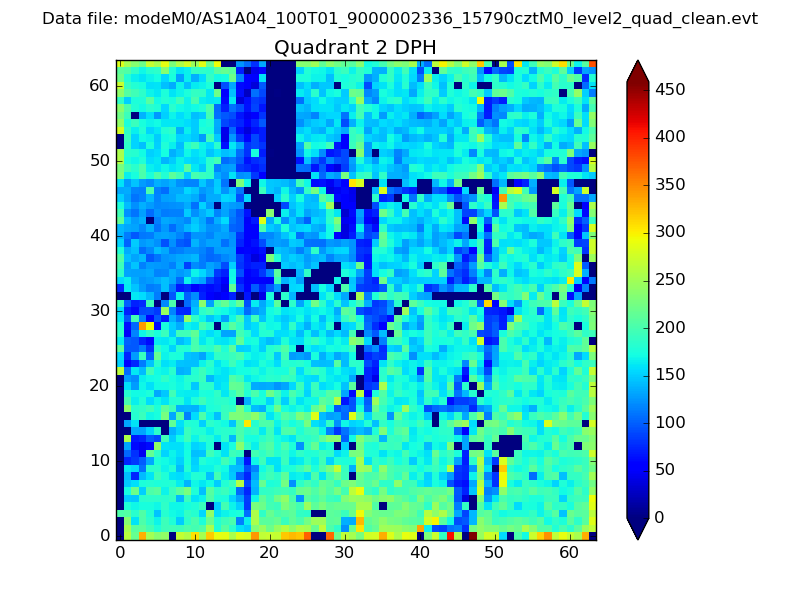 |
Quadrant C |
| Plot type | Count rate plots | Images |
|---|---|---|
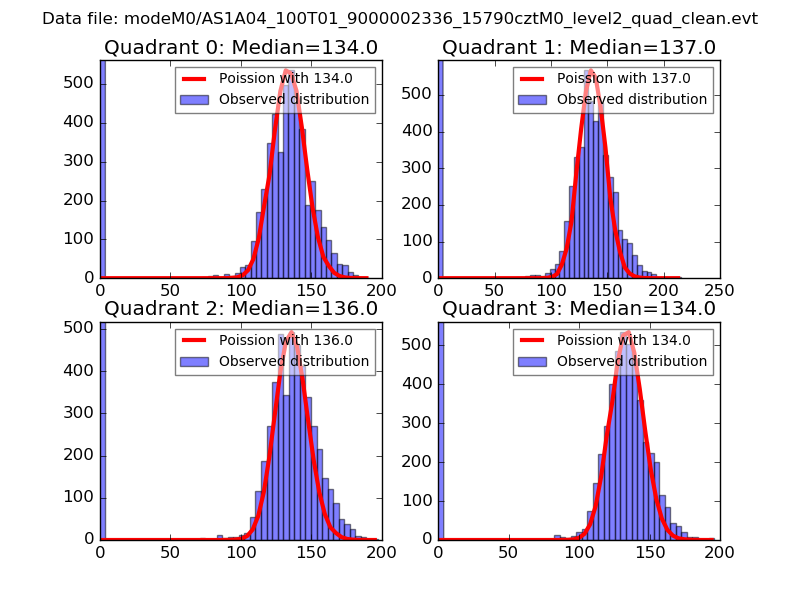
| Comparison with Poisson distribution Blue bars denote a histogram of data divided into 1 sec bins. Red curve is a Poisson curve with rate = median count rate of data. |
 |
 |
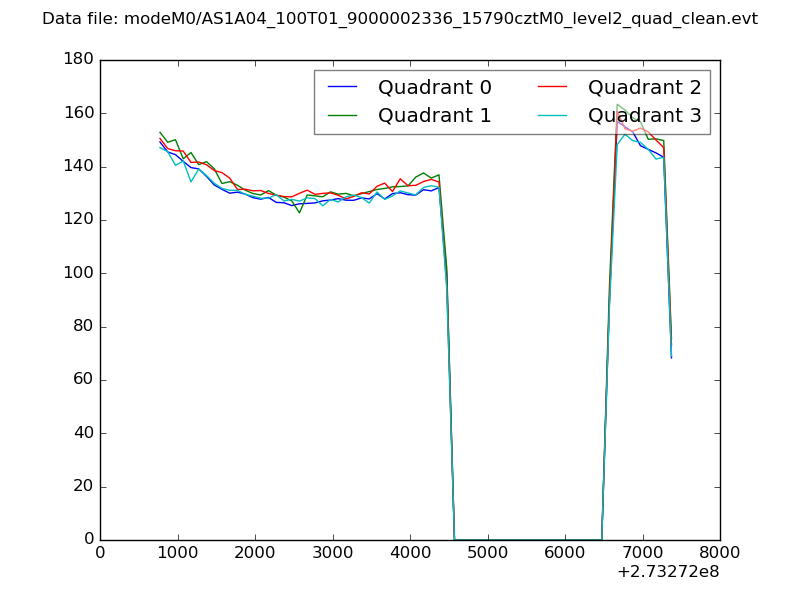
| Quadrant-wise count rates Data is divided into 100 sec bins |
 |
|
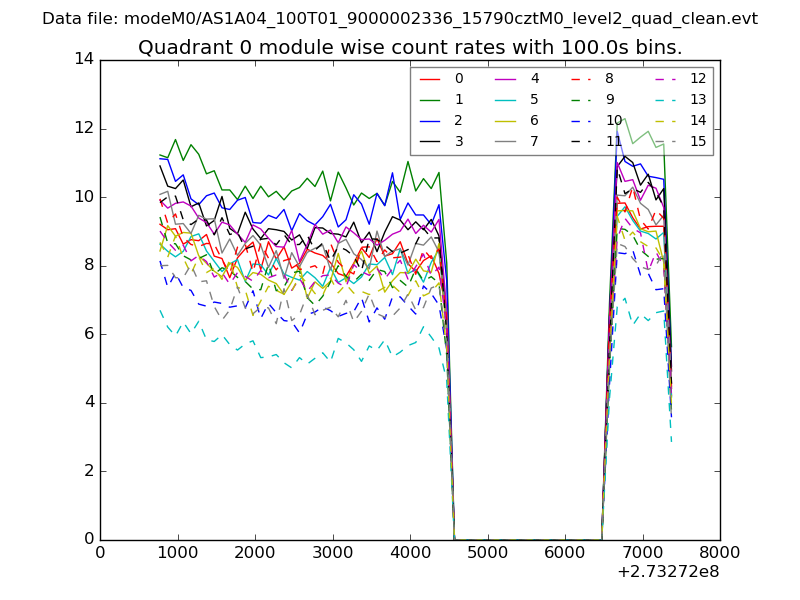
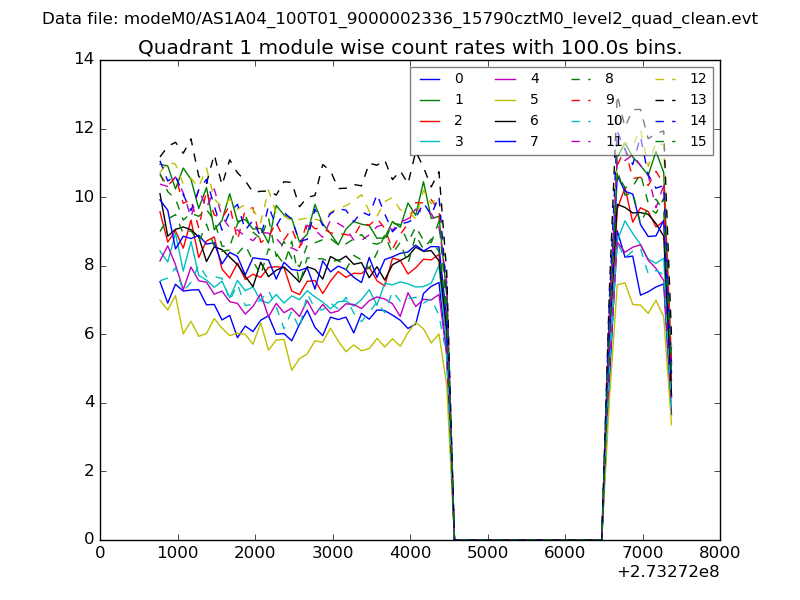
| Module-wise count rates for Quadrant A Data is divided into 100 sec bins |
 |
 |
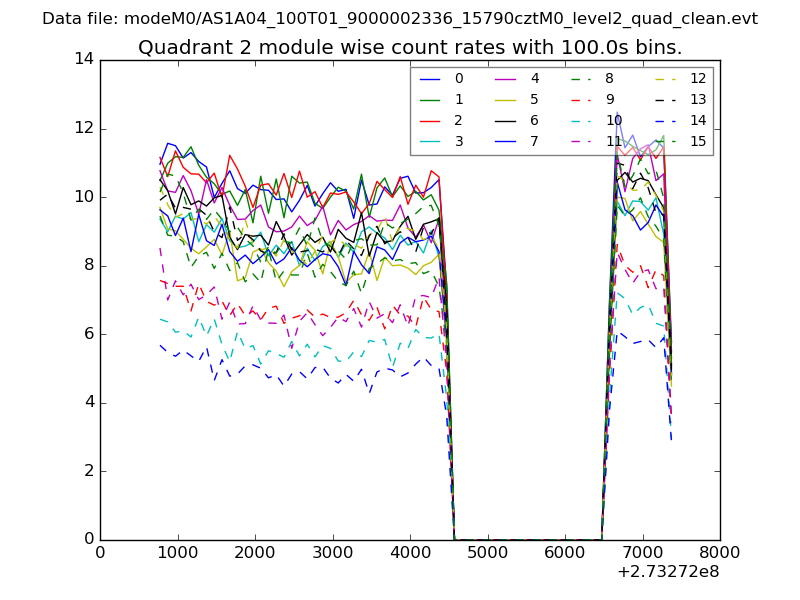
| Module-wise count rates for Quadrant B Data is divided into 100 sec bins |
 |
 |
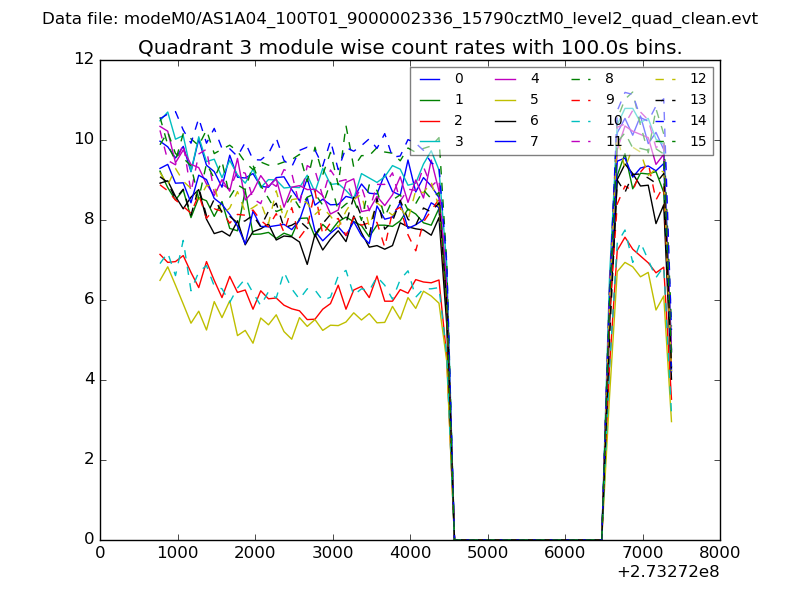
| Module-wise count rates for Quadrant C Data is divided into 100 sec bins |
 |
 |
| Module-wise count rates for Quadrant D Data is divided into 100 sec bins |
 |
 |
| Parameter | Plot |
|---|---|
| CZT HV Monitor | 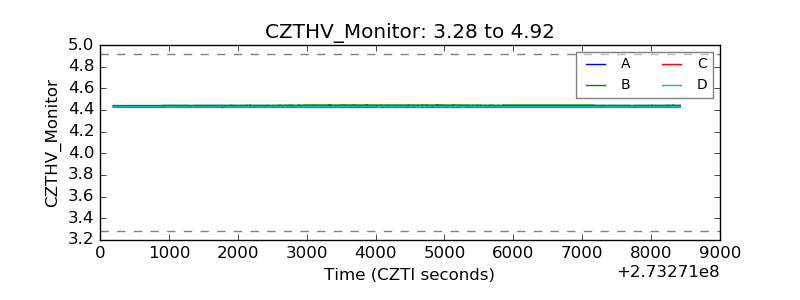 |
| D_VDD | 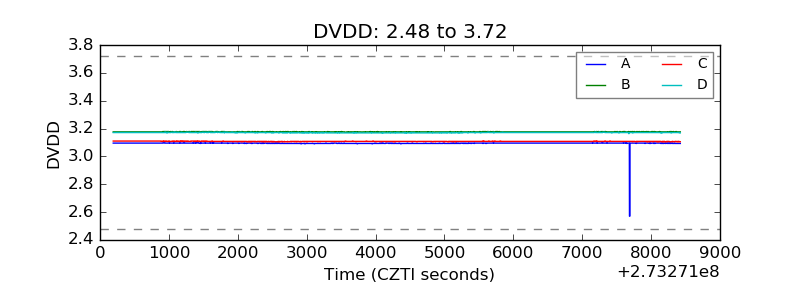 |
| Temperature 1 | 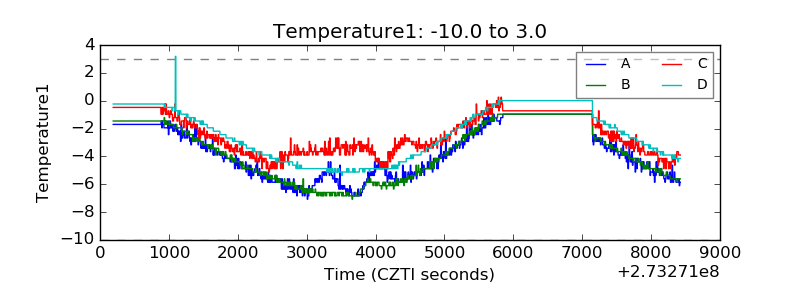 |
| Veto HV Monitor |  |
| Veto LLD | 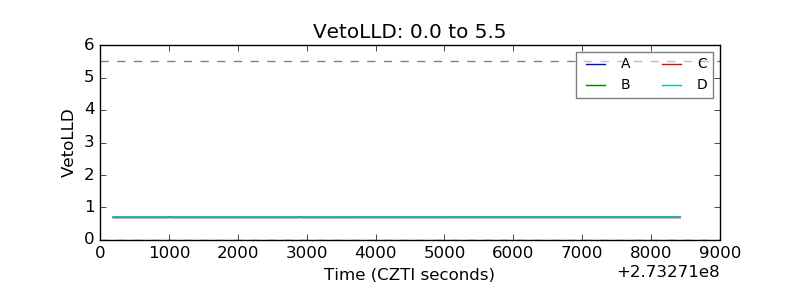 |
| Alpha Counter | 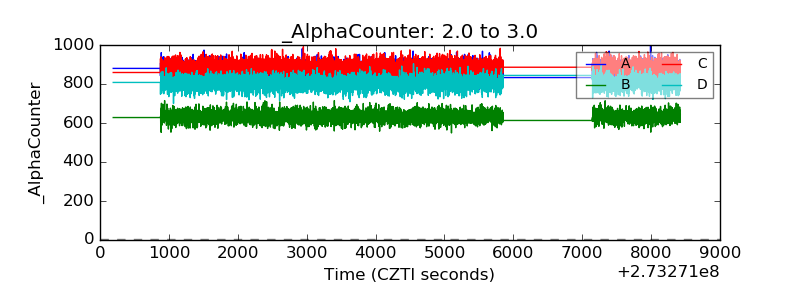 |
| _CPM_Rate | 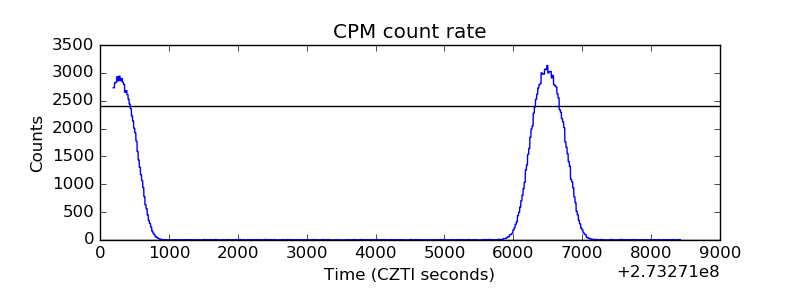 |
| CZT Counter | 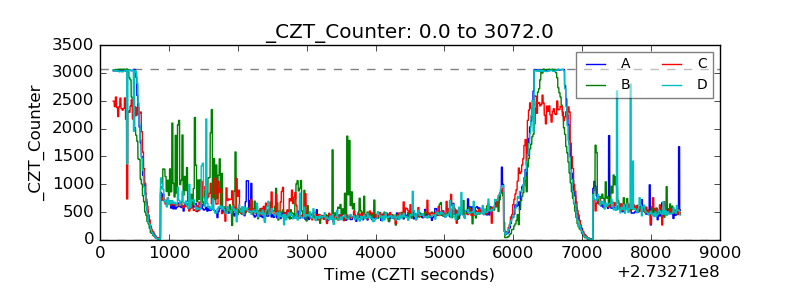 |
| +2.5 Volts monitor |  |
| +5 Volts monitor |  |
| _ROLL_ROT | 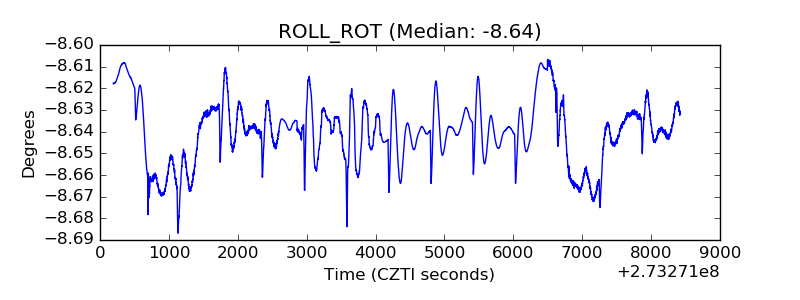 |
| _Roll_DEC | 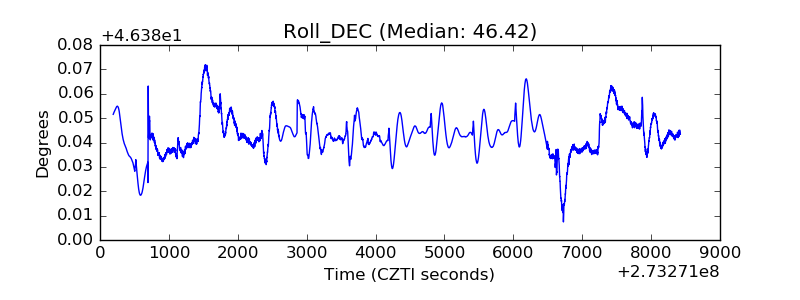 |
| _Roll_RA | 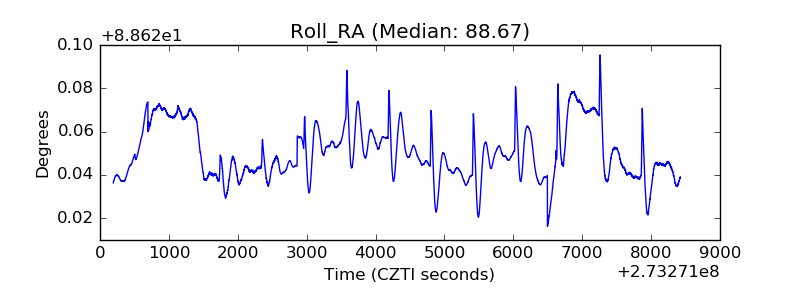 |
| Veto Counter | 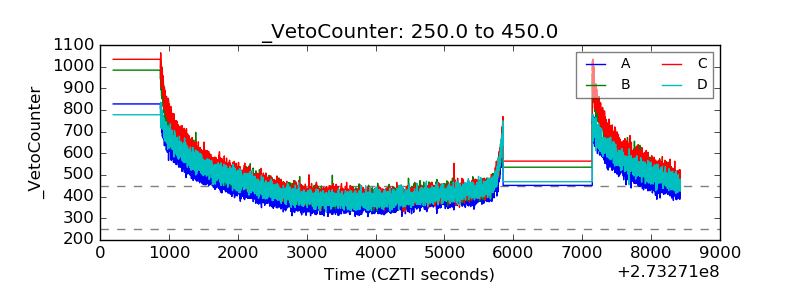 |