| Param | Original file | Final file |
|---|---|---|
| Filename | modeM0/AS1A04_100T01_9000002336_15792cztM0_level2.evt | modeM0/AS1A04_100T01_9000002336_15792cztM0_level2_quad_clean.evt |
| Size (bytes) | 471,726,720 | 112,296,960 |
| Size | 449.9 MB | 107.1 MB |
| Events in quadrant A | 3,415,748 | 726,894 |
| Events in quadrant B | 3,992,111 | 747,082 |
| Events in quadrant C | 3,372,559 | 746,355 |
| Events in quadrant D | 3,057,833 | 720,804 |
| Mode SS | |||
|---|---|---|---|
| Quadrant | BADHDUFLAG | Total packets | Discarded packets |
| A | 0 | 134 | 0 |
| B | 0 | 134 | 0 |
| C | 0 | 134 | 0 |
| D | 0 | 134 | 0 |
| Mode M0 | |||
|---|---|---|---|
| Quadrant | BADHDUFLAG | Total packets | Discarded packets |
| A | 0 | 14567 | 3 |
| B | 0 | 16276 | 2 |
| C | 0 | 14383 | 2 |
| D | 0 | 13761 | 2 |
| Mode M9 | |||
|---|---|---|---|
| Quadrant | BADHDUFLAG | Total packets | Discarded packets |
| A | 0 | 18 | 0 |
| B | 0 | 18 | 0 |
| C | 0 | 18 | 0 |
| D | 0 | 19 | 0 |
| Quadrant | Total seconds | Saturated seconds | Saturation percentage |
|---|---|---|---|
| A | 6597 | 83 | 1.258148% |
| B | 6597 | 208 | 3.152948% |
| C | 6597 | 102 | 1.546157% |
| D | 6597 | 24 | 0.363802% |
Noise dominated data is calculated using 1-second bins in cleaned event files. If a bin has >2000 counts, and if more than 50% of those come from <1% of pixels, then it is considered to be noise-dominated and hence unusable.
| Quadrant | # 1 sec bins | Bins with >0 counts | Bins with >2000 counts | High rate bins dominated by noise | Noise dominated (total time) | Noise dominated (detector-on time) | Marked lightcurve |
|---|---|---|---|---|---|---|---|
| A | 7883 | 6599 | 37 | 37 | 0.47% | 0.56% | 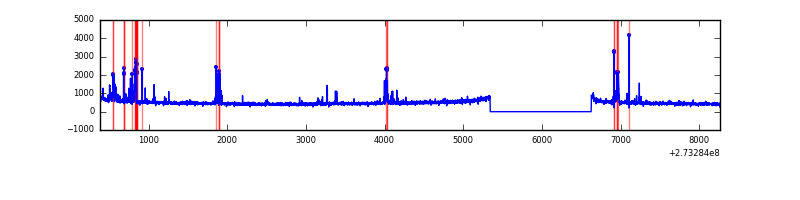 |
| B | 7883 | 6599 | 91 | 91 | 1.15% | 1.38% | 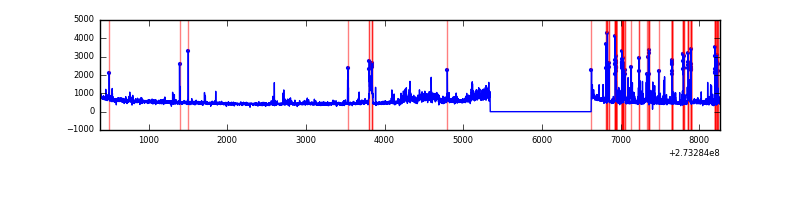 |
| C | 7883 | 6599 | 0 | 0 | 0.00% | 0.00% | 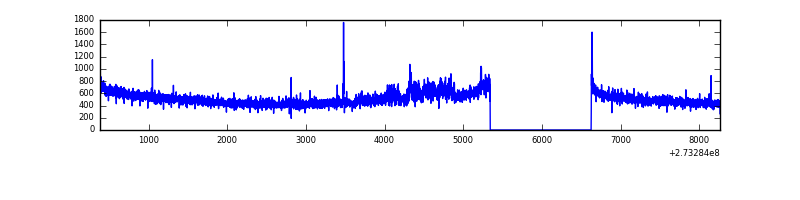 |
| D | 7883 | 6599 | 2 | 2 | 0.03% | 0.03% | 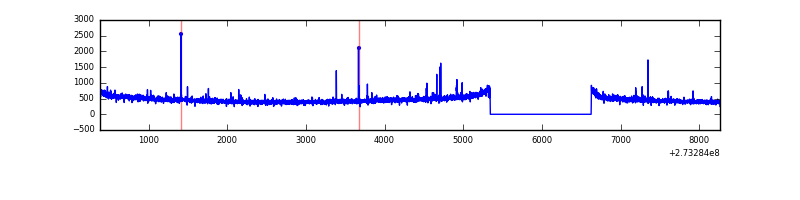 |
Top three noisy pixels from each quadrant. If the there are fewer than three noisy pixels in the level2.evt file, extra rows are filled as -1
| Pixel properties | Quadrant properties | ||||||
|---|---|---|---|---|---|---|---|
| Quadrant | DetID | PixID | Counts | Sigma | Mean | Median | Sigma |
| A | 15 | 239 | 182806 | 1122.1 | 809 | 792 | 162.2 |
| A | 15 | 174 | 63959 | 389.42 | 809 | 792 | 162.2 |
| A | 14 | 254 | 58129 | 353.48 | 809 | 792 | 162.2 |
| B | 5 | 65 | 452492 | 2977.3 | 815 | 798 | 151.7 |
| B | 10 | 245 | 148934 | 976.43 | 815 | 798 | 151.7 |
| B | 4 | 173 | 55887 | 363.11 | 815 | 798 | 151.7 |
| C | 14 | 238 | 122965 | 663.74 | 795 | 802 | 184.1 |
| C | 7 | 247 | 122065 | 658.85 | 795 | 802 | 184.1 |
| C | 3 | 233 | 10483 | 52.6 | 795 | 802 | 184.1 |
| D | 2 | 234 | 26509 | 122.25 | 786 | 771 | 210.5 |
| D | 2 | 152 | 12844 | 57.34 | 786 | 771 | 210.5 |
| D | 2 | 120 | 11621 | 51.53 | 786 | 771 | 210.5 |
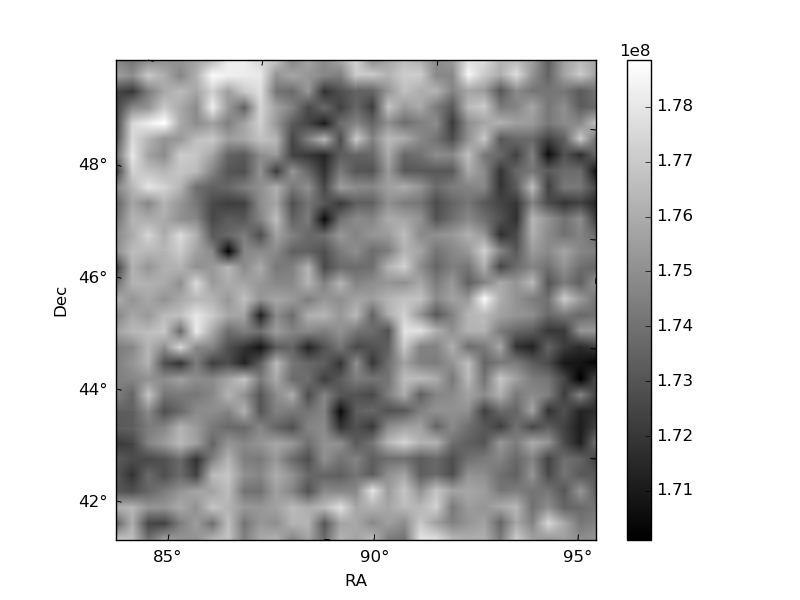
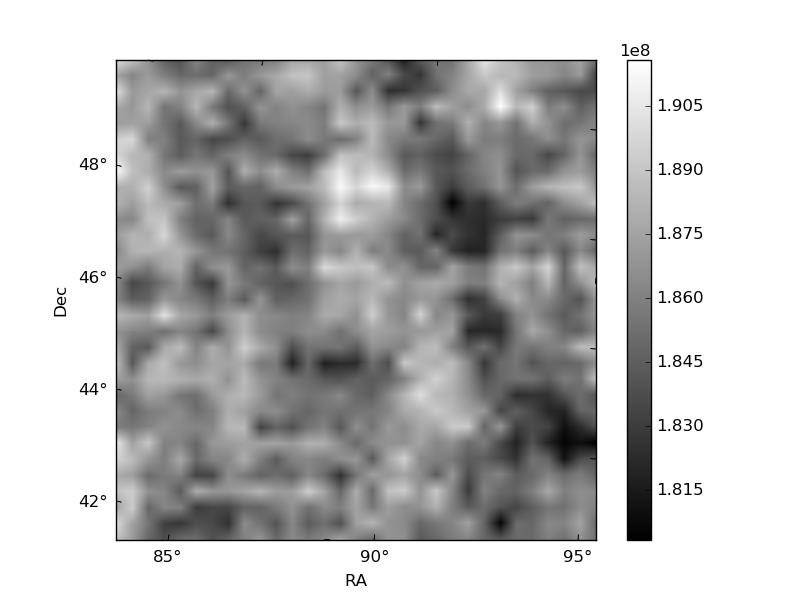
Histogram calculated using DETX and DETY for each event in the final _common_clean file
| Quadrant A |  |
 |
Quadrant B |
|---|---|---|---|
| Quadrant D |  |
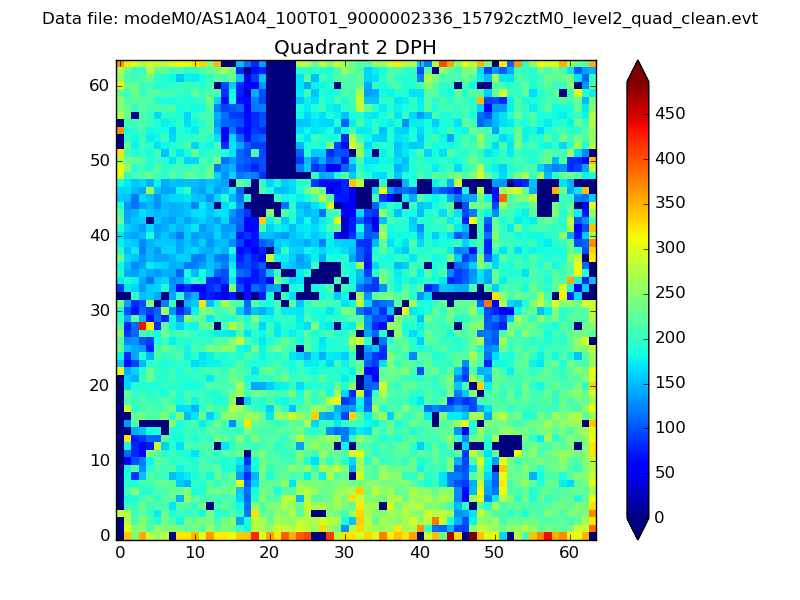 |
Quadrant C |
| Plot type | Count rate plots | Images |
|---|---|---|
| Comparison with Poisson distribution Blue bars denote a histogram of data divided into 1 sec bins. Red curve is a Poisson curve with rate = median count rate of data. |
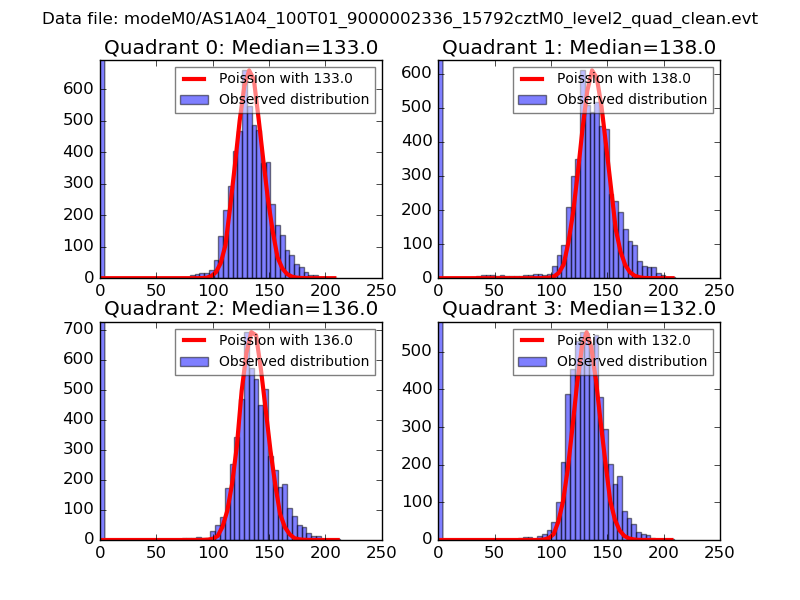 |
 |
| Quadrant-wise count rates Data is divided into 100 sec bins |
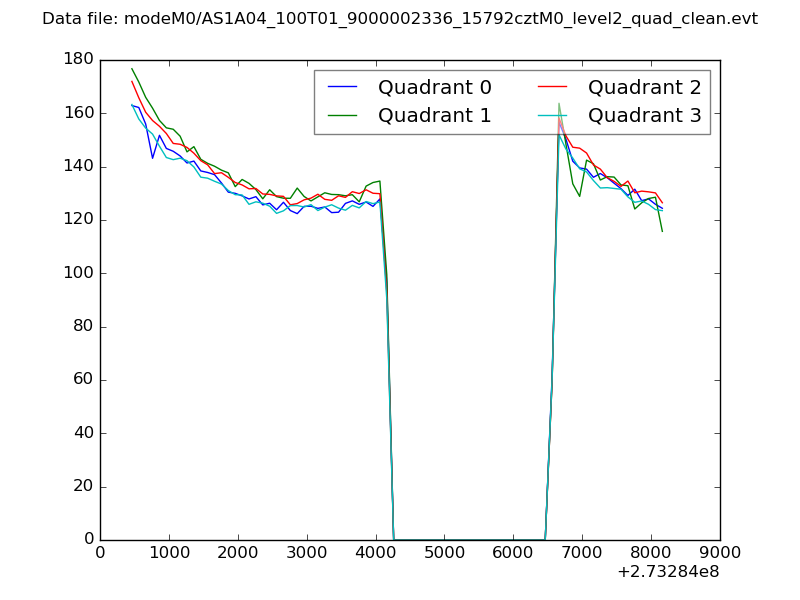 |
|
| Module-wise count rates for Quadrant A Data is divided into 100 sec bins |
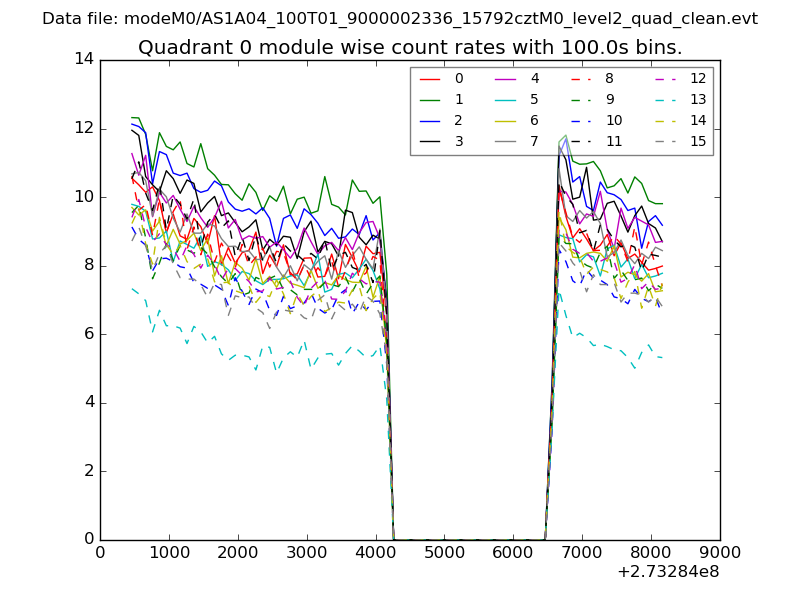 |
 |
| Module-wise count rates for Quadrant B Data is divided into 100 sec bins |
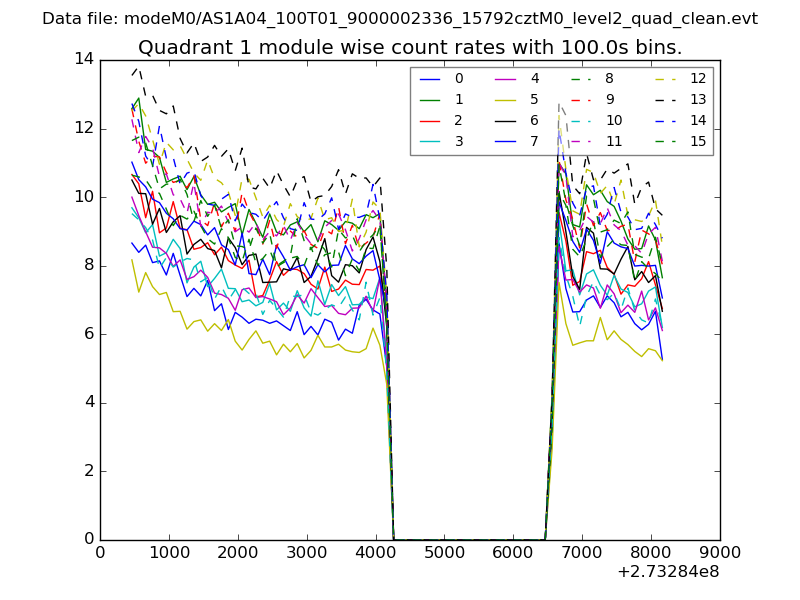 |
 |
| Module-wise count rates for Quadrant C Data is divided into 100 sec bins |
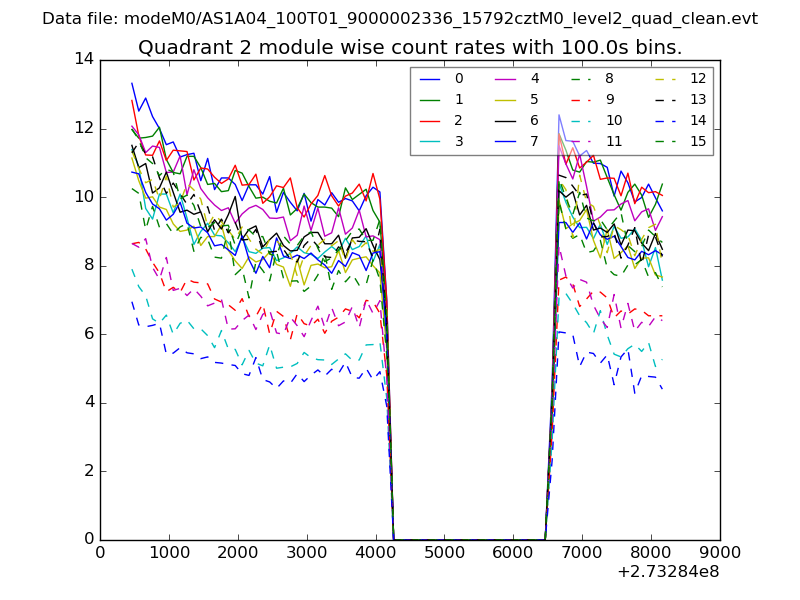 |
 |
| Module-wise count rates for Quadrant D Data is divided into 100 sec bins |
 |
 |
| Parameter | Plot |
|---|---|
| CZT HV Monitor | 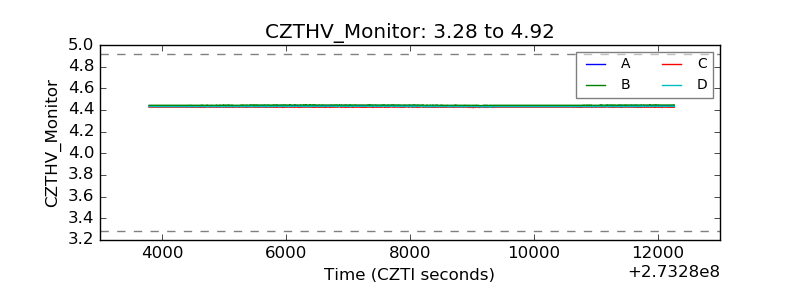 |
| D_VDD | 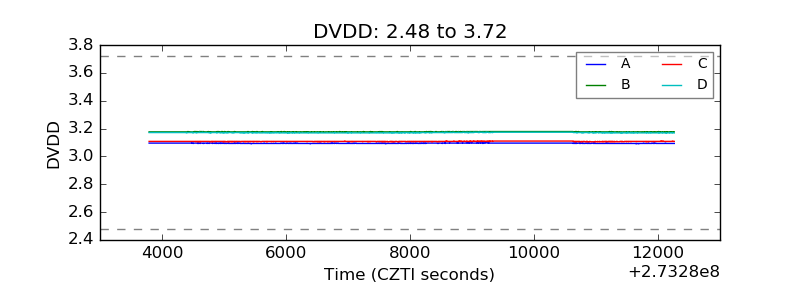 |
| Temperature 1 | 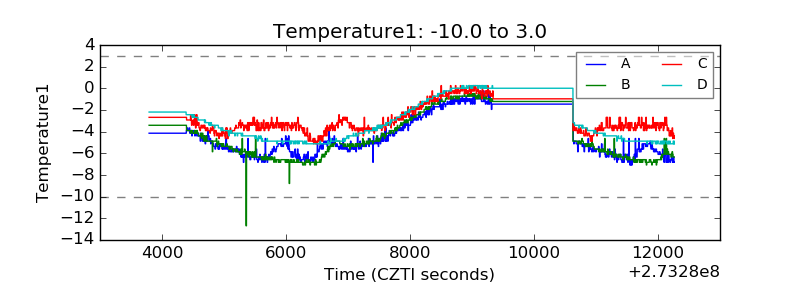 |
| Veto HV Monitor | 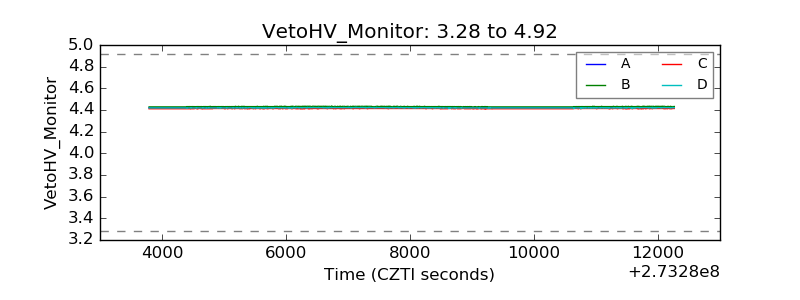 |
| Veto LLD | 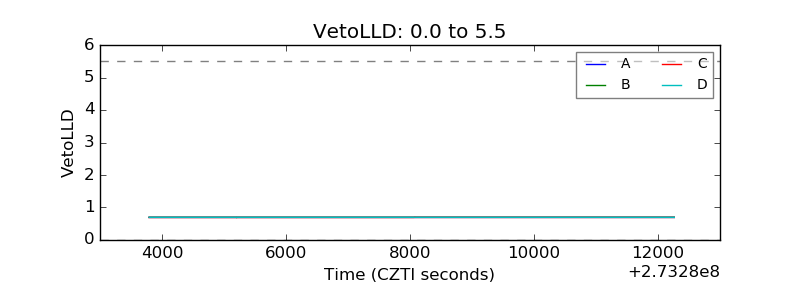 |
| Alpha Counter | 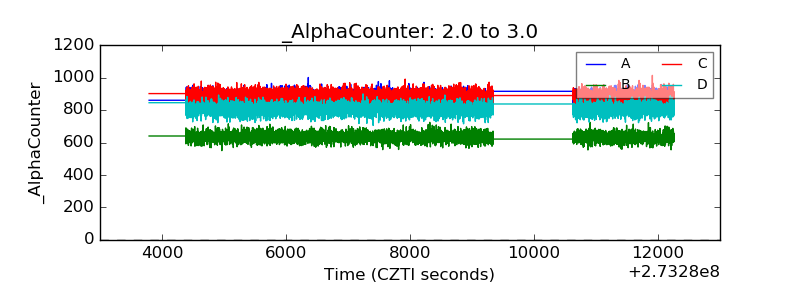 |
| _CPM_Rate | 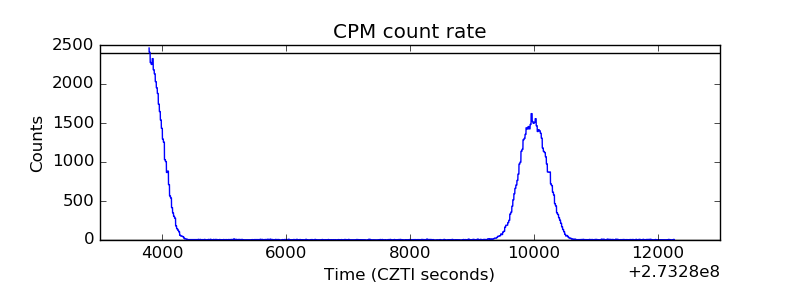 |
| CZT Counter | 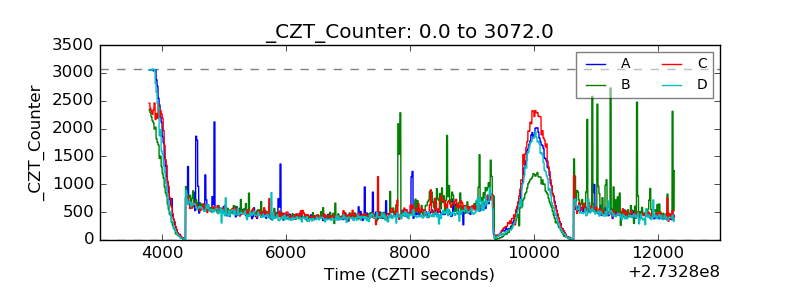 |
| +2.5 Volts monitor |  |
| +5 Volts monitor |  |
| _ROLL_ROT | 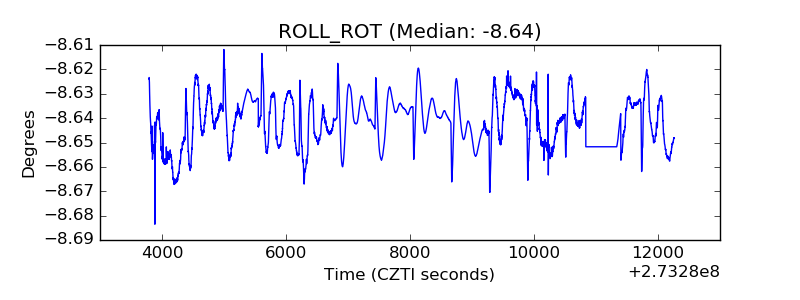 |
| _Roll_DEC | 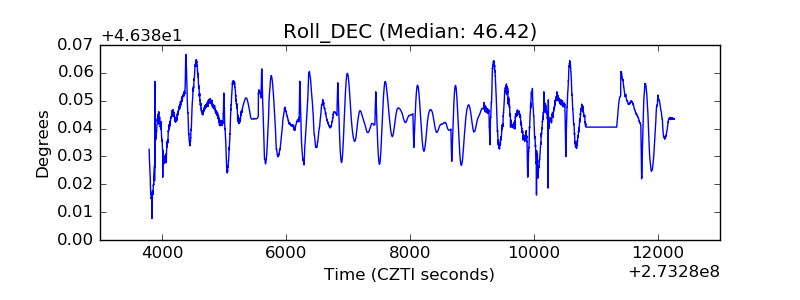 |
| _Roll_RA | 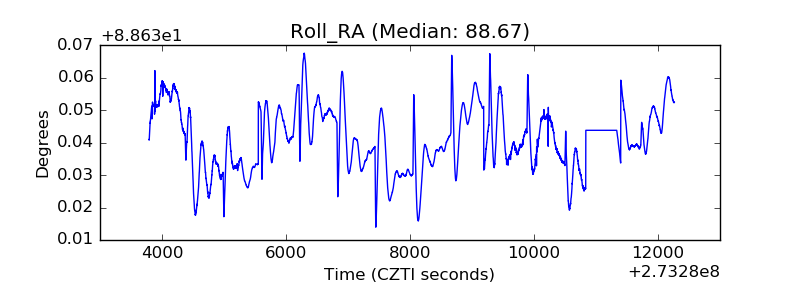 |
| Veto Counter | 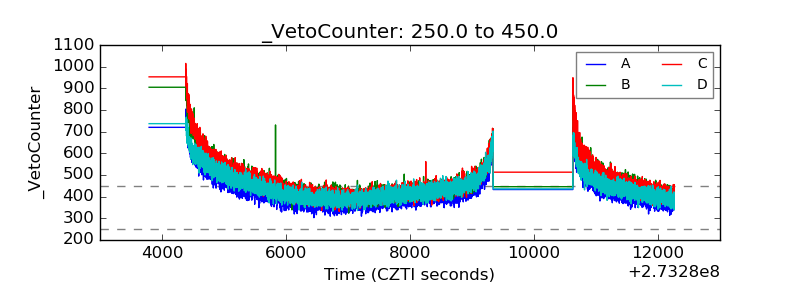 |