| Param | Original file | Final file |
|---|---|---|
| Filename | modeM0/AS1A04_100T01_9000002336_15793cztM0_level2.evt | modeM0/AS1A04_100T01_9000002336_15793cztM0_level2_quad_clean.evt |
| Size (bytes) | 405,455,040 | 87,013,440 |
| Size | 386.7 MB | 83.0 MB |
| Events in quadrant A | 2,752,104 | 550,179 |
| Events in quadrant B | 3,625,020 | 559,737 |
| Events in quadrant C | 2,798,589 | 560,319 |
| Events in quadrant D | 2,693,784 | 544,263 |
| Mode SS | |||
|---|---|---|---|
| Quadrant | BADHDUFLAG | Total packets | Discarded packets |
| A | 0 | 124 | 0 |
| B | 0 | 124 | 0 |
| C | 0 | 124 | 0 |
| D | 0 | 124 | 0 |
| Mode M0 | |||
|---|---|---|---|
| Quadrant | BADHDUFLAG | Total packets | Discarded packets |
| A | 0 | 12400 | 2 |
| B | 0 | 14679 | 1 |
| C | 0 | 12381 | 1 |
| D | 0 | 12534 | 1 |
| Mode M9 | |||
|---|---|---|---|
| Quadrant | BADHDUFLAG | Total packets | Discarded packets |
| A | 0 | 11 | 0 |
| B | 0 | 11 | 0 |
| C | 0 | 11 | 0 |
| D | 0 | 11 | 0 |
| Quadrant | Total seconds | Saturated seconds | Saturation percentage |
|---|---|---|---|
| A | 6015 | 12 | 0.199501% |
| B | 6015 | 212 | 3.524522% |
| C | 6015 | 39 | 0.648379% |
| D | 6015 | 15 | 0.249377% |
Noise dominated data is calculated using 1-second bins in cleaned event files. If a bin has >2000 counts, and if more than 50% of those come from <1% of pixels, then it is considered to be noise-dominated and hence unusable.
| Quadrant | # 1 sec bins | Bins with >0 counts | Bins with >2000 counts | High rate bins dominated by noise | Noise dominated (total time) | Noise dominated (detector-on time) | Marked lightcurve |
|---|---|---|---|---|---|---|---|
| A | 7176 | 6017 | 1 | 1 | 0.01% | 0.02% | 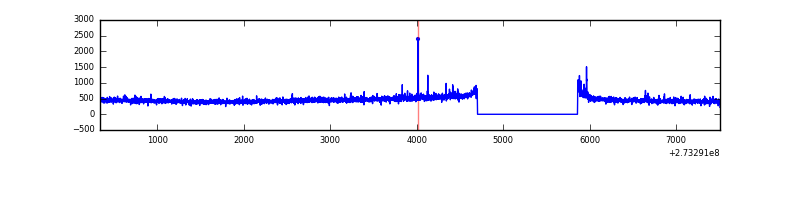 |
| B | 7176 | 6017 | 142 | 142 | 1.98% | 2.36% | 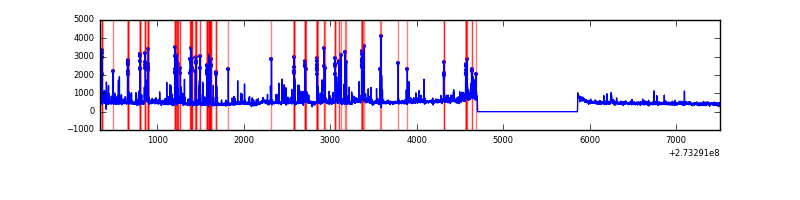 |
| C | 7176 | 6017 | 0 | 0 | 0.00% | 0.00% | 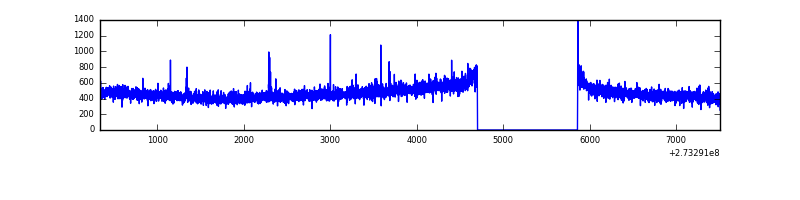 |
| D | 7176 | 6017 | 5 | 5 | 0.07% | 0.08% | 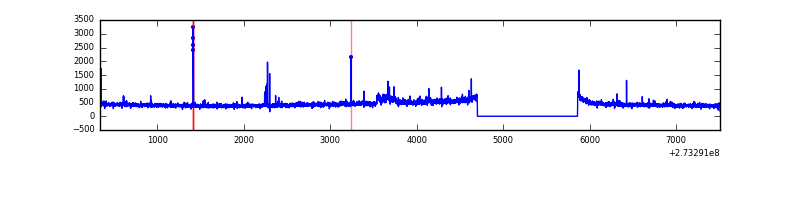 |
Top three noisy pixels from each quadrant. If the there are fewer than three noisy pixels in the level2.evt file, extra rows are filled as -1
| Pixel properties | Quadrant properties | ||||||
|---|---|---|---|---|---|---|---|
| Quadrant | DetID | PixID | Counts | Sigma | Mean | Median | Sigma |
| A | 14 | 254 | 21678 | 147.2 | 704 | 690 | 142.6 |
| A | 15 | 239 | 17281 | 116.36 | 704 | 690 | 142.6 |
| A | 0 | 226 | 6255 | 39.03 | 704 | 690 | 142.6 |
| B | 5 | 65 | 528863 | 3999.01 | 703 | 689 | 132.1 |
| B | 10 | 245 | 179186 | 1351.47 | 703 | 689 | 132.1 |
| B | 7 | 220 | 89796 | 674.66 | 703 | 689 | 132.1 |
| C | 14 | 238 | 106339 | 662.5 | 682 | 687 | 159.5 |
| C | 0 | 207 | 14871 | 88.94 | 682 | 687 | 159.5 |
| C | 10 | 22 | 6399 | 35.82 | 682 | 687 | 159.5 |
| D | 12 | 221 | 37702 | 222.62 | 683 | 664 | 166.4 |
| D | 2 | 234 | 24636 | 144.09 | 683 | 664 | 166.4 |
| D | 2 | 120 | 23806 | 139.1 | 683 | 664 | 166.4 |
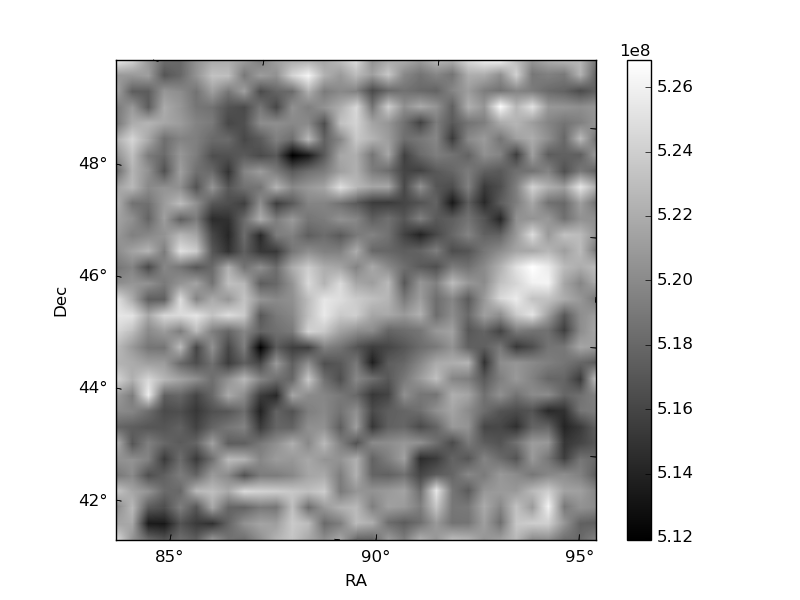
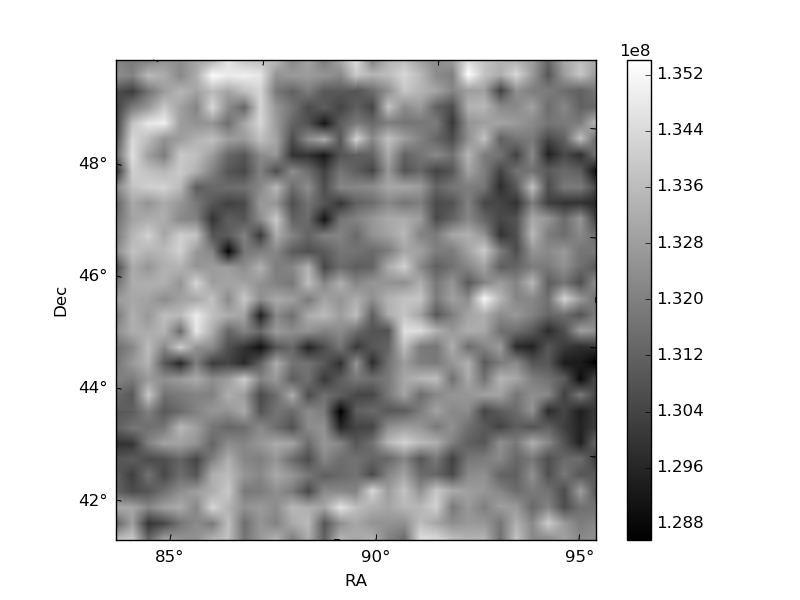
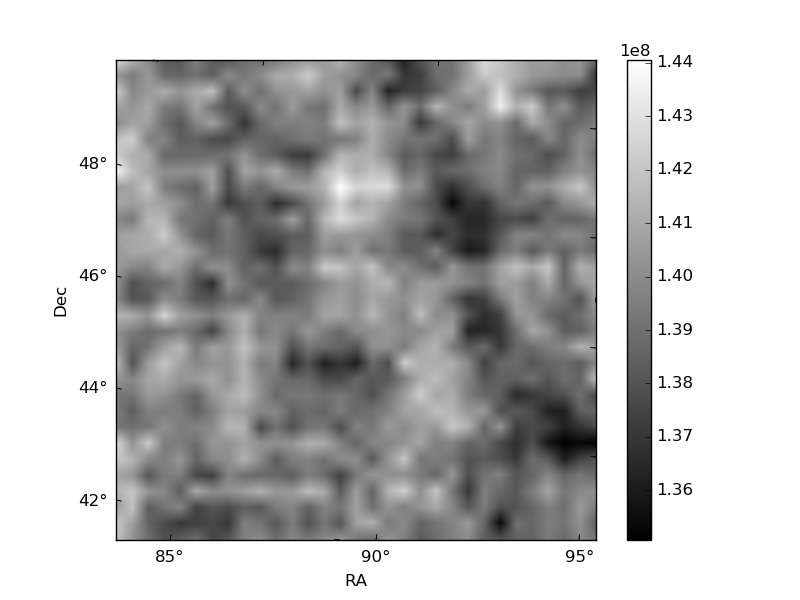
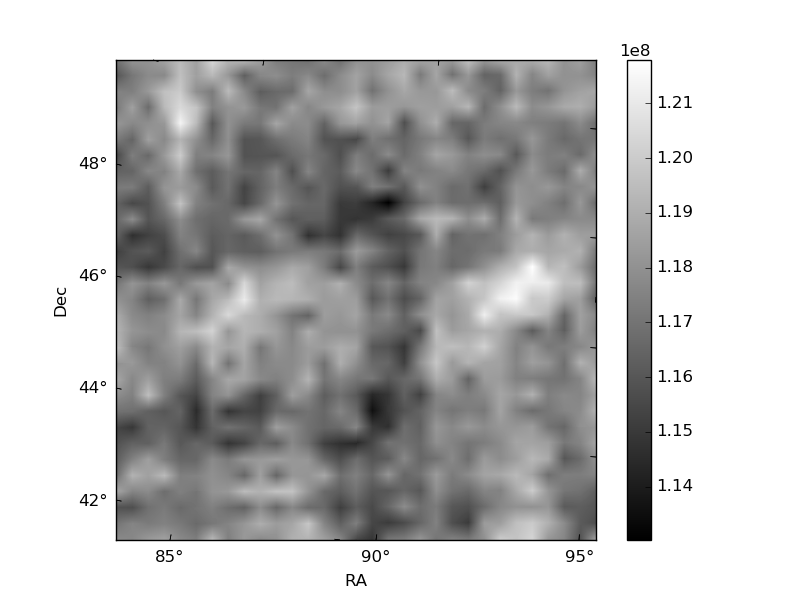
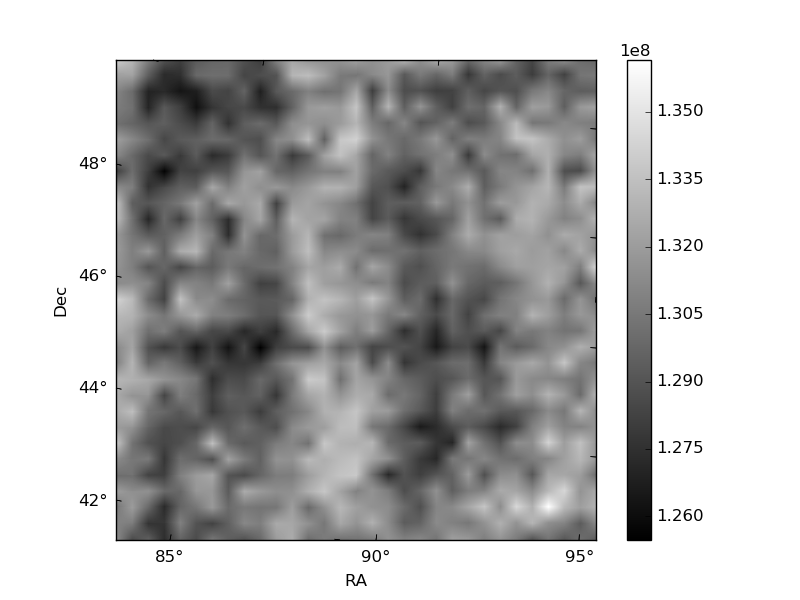
Histogram calculated using DETX and DETY for each event in the final _common_clean file
| Quadrant A | 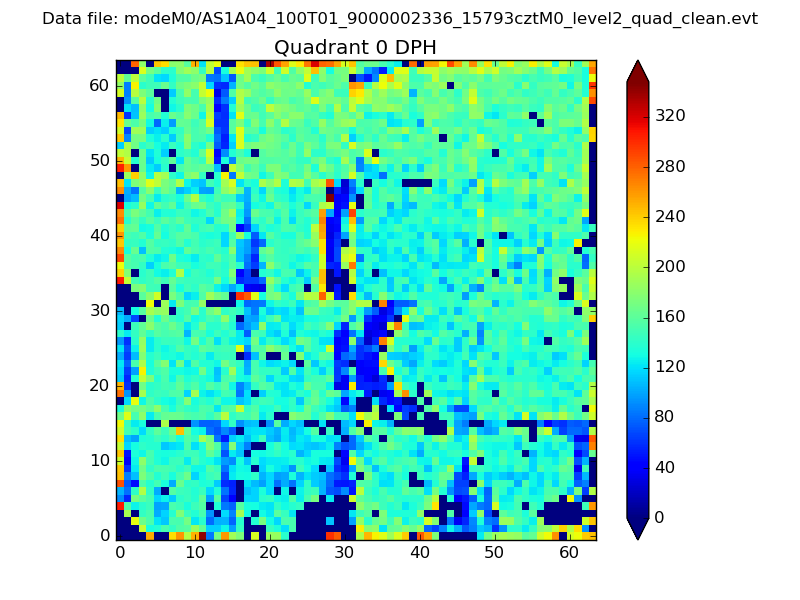 |
 |
Quadrant B |
|---|---|---|---|
| Quadrant D | 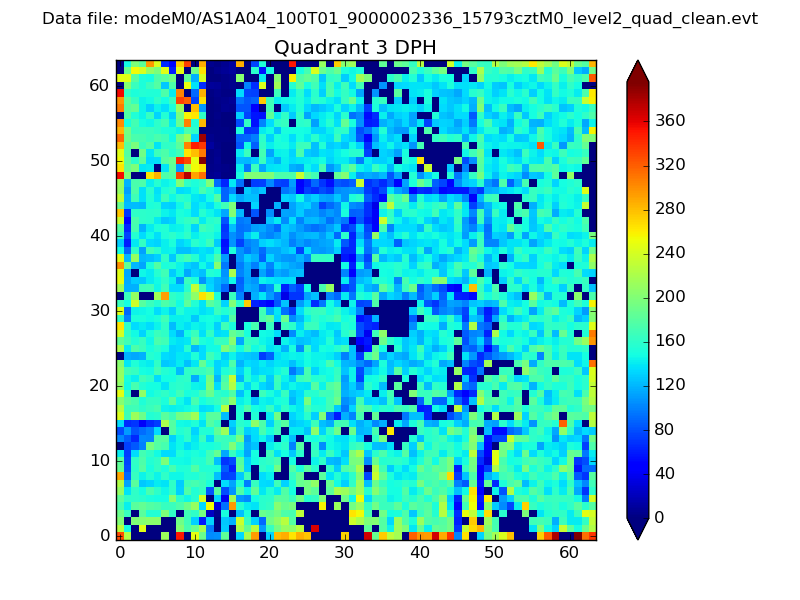 |
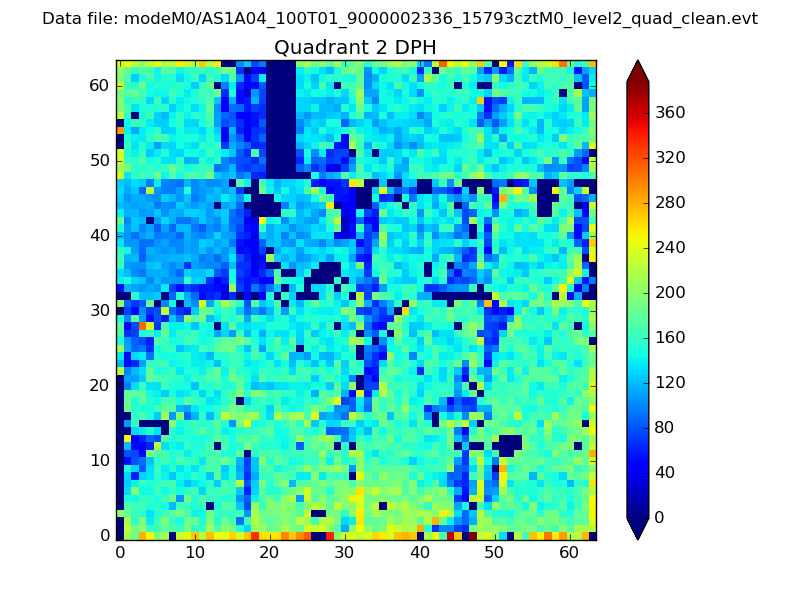 |
Quadrant C |
| Plot type | Count rate plots | Images |
|---|---|---|
| Comparison with Poisson distribution Blue bars denote a histogram of data divided into 1 sec bins. Red curve is a Poisson curve with rate = median count rate of data. |
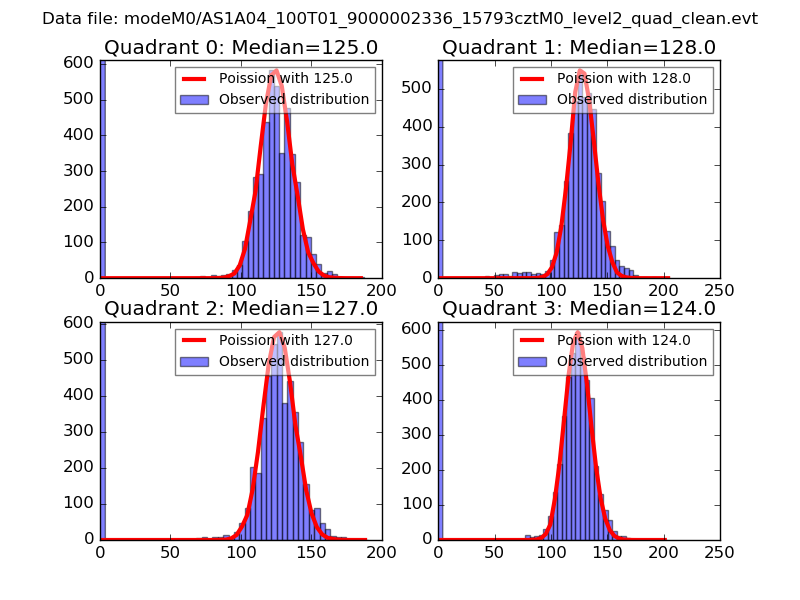 |
 |
| Quadrant-wise count rates Data is divided into 100 sec bins |
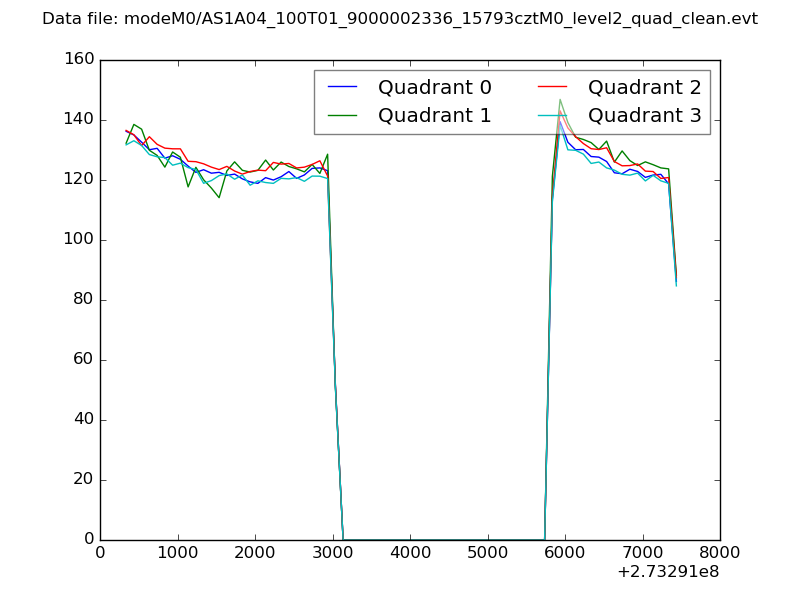 |
|
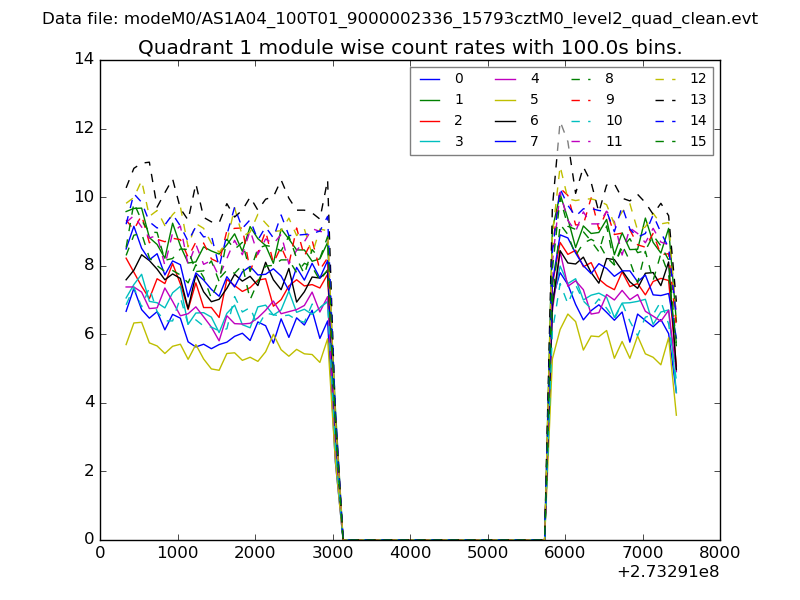
| Module-wise count rates for Quadrant A Data is divided into 100 sec bins |
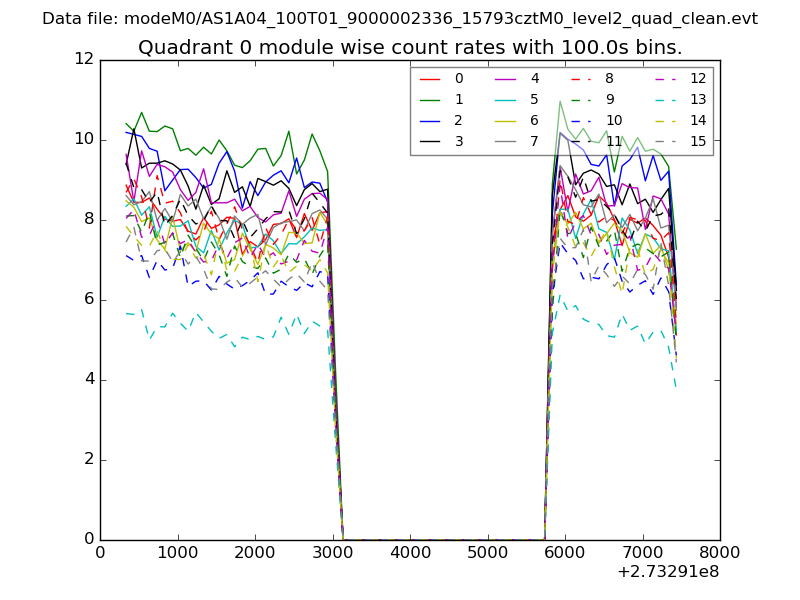 |
 |
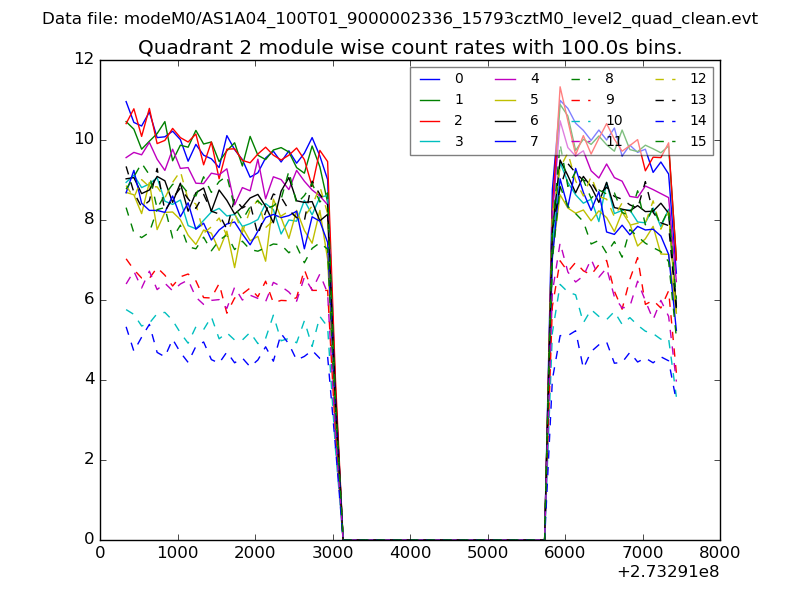
| Module-wise count rates for Quadrant B Data is divided into 100 sec bins |
 |
 |
| Module-wise count rates for Quadrant C Data is divided into 100 sec bins |
 |
 |
| Module-wise count rates for Quadrant D Data is divided into 100 sec bins |
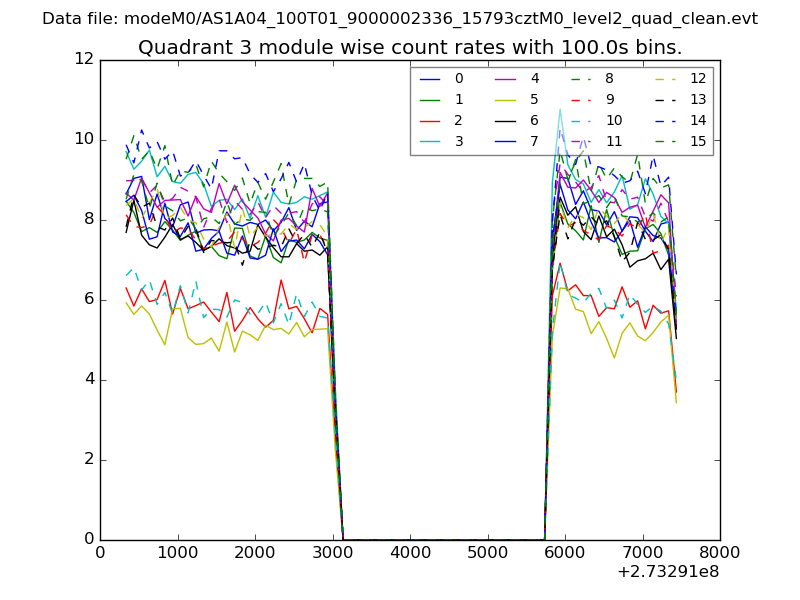 |
 |
| Parameter | Plot |
|---|---|
| CZT HV Monitor | 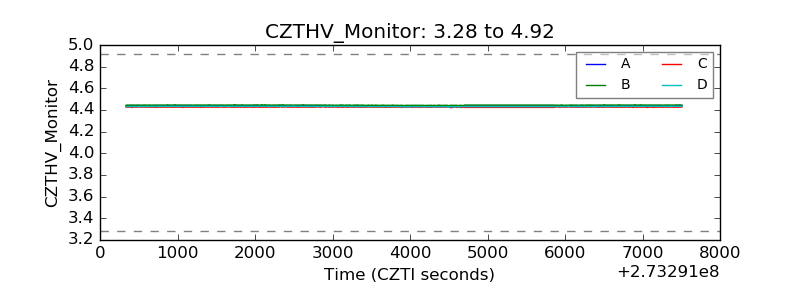 |
| D_VDD | 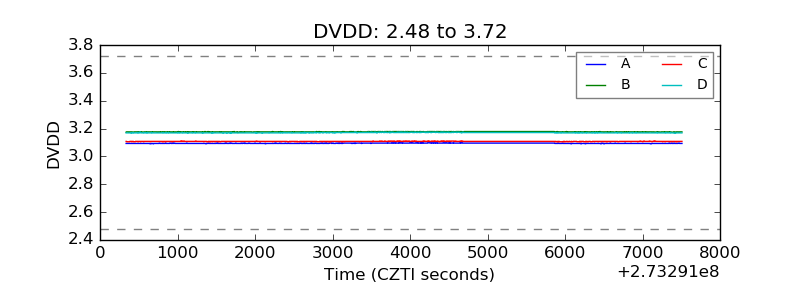 |
| Temperature 1 | 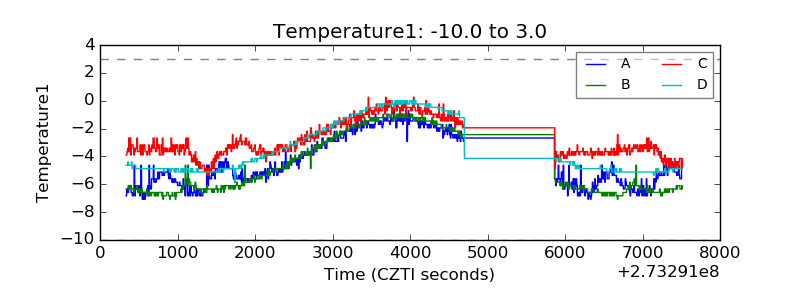 |
| Veto HV Monitor |  |
| Veto LLD | 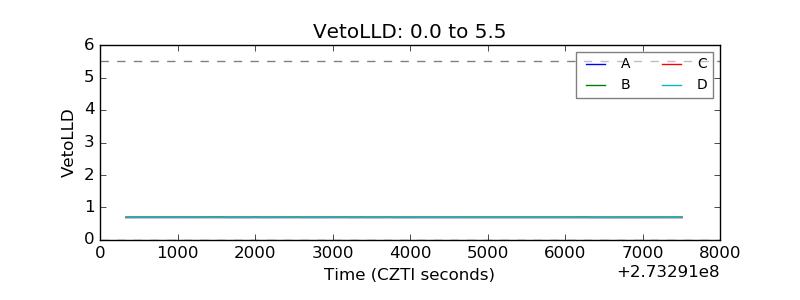 |
| Alpha Counter | 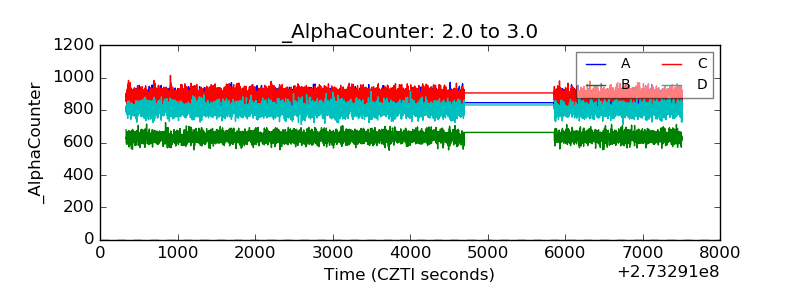 |
| _CPM_Rate | 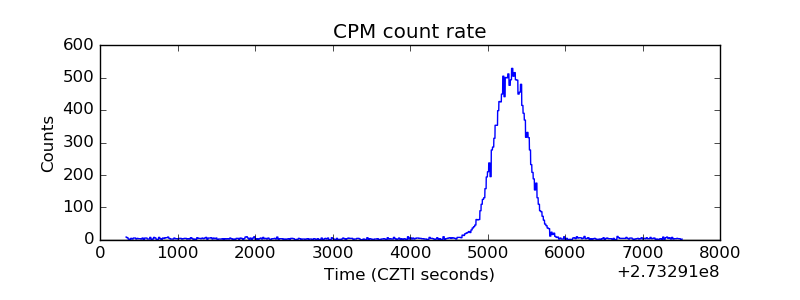 |
| CZT Counter | 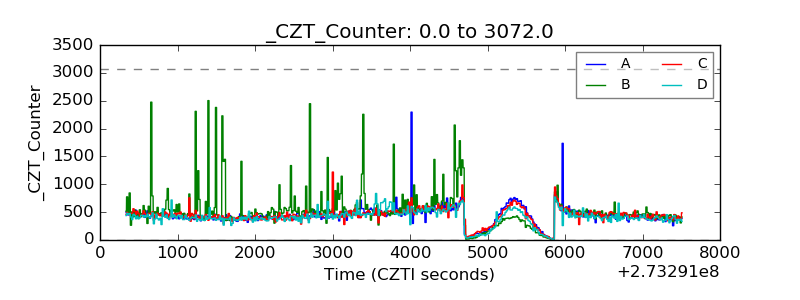 |
| +2.5 Volts monitor |  |
| +5 Volts monitor | 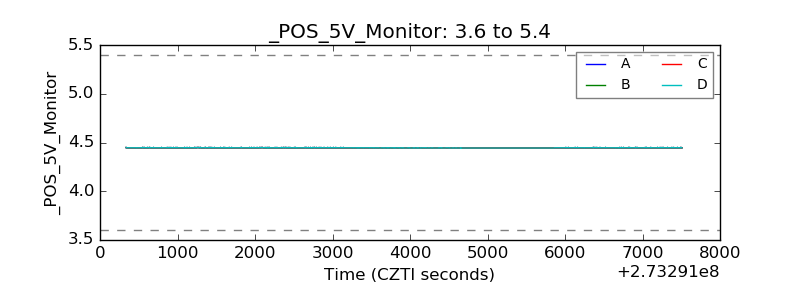 |
| _ROLL_ROT | 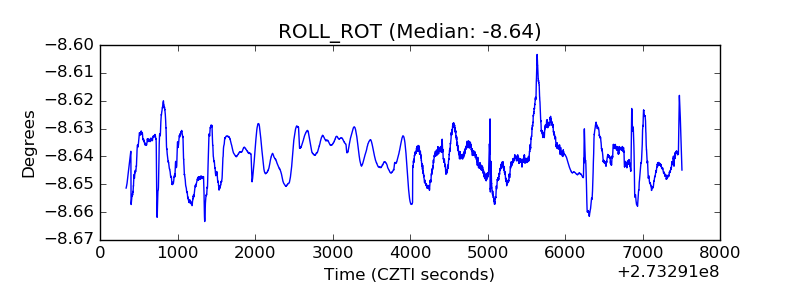 |
| _Roll_DEC | 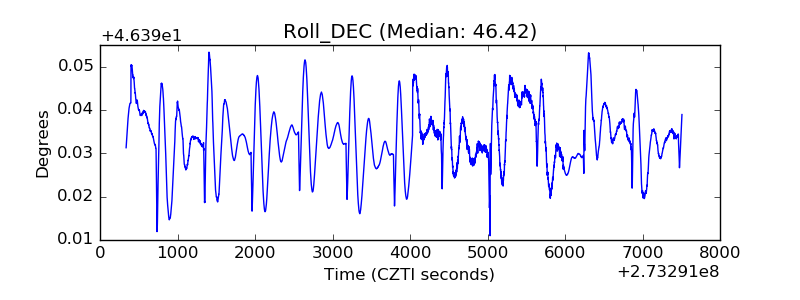 |
| _Roll_RA | 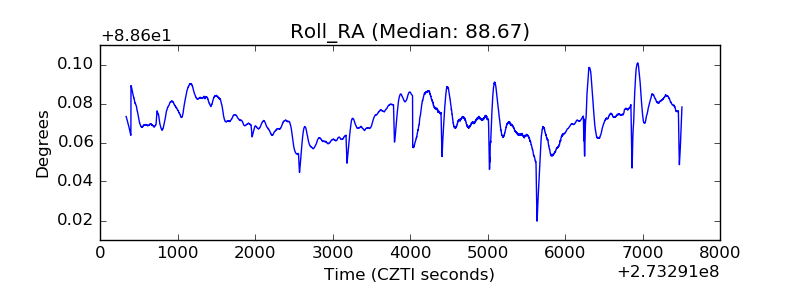 |
| Veto Counter | 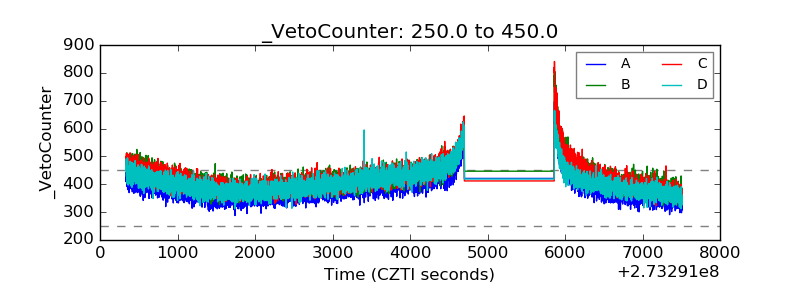 |