| Param | Original file | Final file |
|---|---|---|
| Filename | modeM0/AS1A04_100T01_9000002336_15795cztM0_level2.evt | modeM0/AS1A04_100T01_9000002336_15795cztM0_level2_quad_clean.evt |
| Size (bytes) | 444,830,400 | 93,435,840 |
| Size | 424.2 MB | 89.1 MB |
| Events in quadrant A | 3,209,847 | 581,547 |
| Events in quadrant B | 3,416,711 | 598,515 |
| Events in quadrant C | 3,285,892 | 590,871 |
| Events in quadrant D | 3,088,658 | 576,634 |
| Mode SS | |||
|---|---|---|---|
| Quadrant | BADHDUFLAG | Total packets | Discarded packets |
| A | 0 | 140 | 0 |
| B | 0 | 140 | 0 |
| C | 0 | 140 | 0 |
| D | 0 | 140 | 0 |
| Mode M0 | |||
|---|---|---|---|
| Quadrant | BADHDUFLAG | Total packets | Discarded packets |
| A | 0 | 14436 | 2 |
| B | 0 | 14823 | 1 |
| C | 0 | 14413 | 1 |
| D | 0 | 14387 | 1 |
| Mode M9 | |||
|---|---|---|---|
| Quadrant | BADHDUFLAG | Total packets | Discarded packets |
| A | 0 | 3 | 0 |
| B | 0 | 3 | 0 |
| C | 0 | 3 | 0 |
| D | 0 | 3 | 0 |
| Quadrant | Total seconds | Saturated seconds | Saturation percentage |
|---|---|---|---|
| A | 6919 | 129 | 1.864431% |
| B | 6919 | 141 | 2.037867% |
| C | 6919 | 125 | 1.806619% |
| D | 6919 | 81 | 1.170689% |
Noise dominated data is calculated using 1-second bins in cleaned event files. If a bin has >2000 counts, and if more than 50% of those come from <1% of pixels, then it is considered to be noise-dominated and hence unusable.
| Quadrant | # 1 sec bins | Bins with >0 counts | Bins with >2000 counts | High rate bins dominated by noise | Noise dominated (total time) | Noise dominated (detector-on time) | Marked lightcurve |
|---|---|---|---|---|---|---|---|
| A | 7225 | 6921 | 6 | 6 | 0.08% | 0.09% | 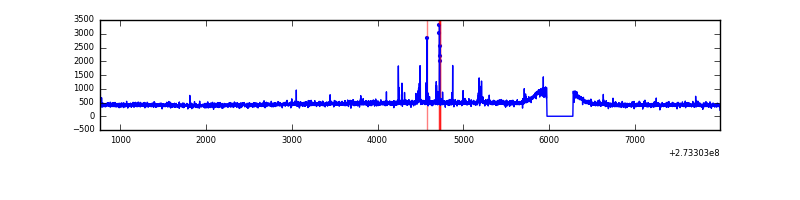 |
| B | 7225 | 6921 | 6 | 6 | 0.08% | 0.09% | 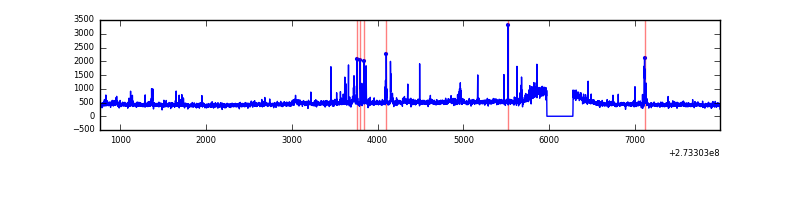 |
| C | 7225 | 6921 | 0 | 0 | 0.00% | 0.00% | 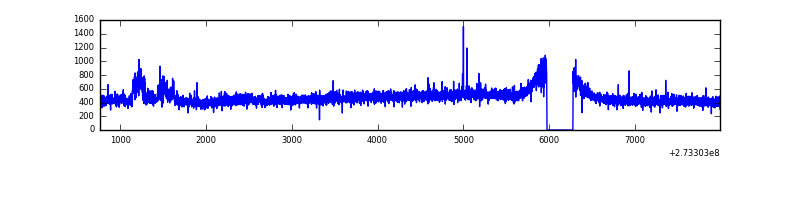 |
| D | 7225 | 6921 | 9 | 9 | 0.12% | 0.13% | 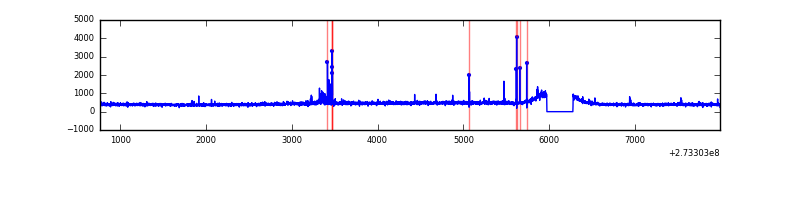 |
Top three noisy pixels from each quadrant. If the there are fewer than three noisy pixels in the level2.evt file, extra rows are filled as -1
| Pixel properties | Quadrant properties | ||||||
|---|---|---|---|---|---|---|---|
| Quadrant | DetID | PixID | Counts | Sigma | Mean | Median | Sigma |
| A | 15 | 239 | 53441 | 316.65 | 813 | 793 | 166.3 |
| A | 14 | 254 | 26276 | 153.27 | 813 | 793 | 166.3 |
| A | 0 | 226 | 7254 | 38.86 | 813 | 793 | 166.3 |
| B | 4 | 173 | 70263 | 440.96 | 816 | 794 | 157.5 |
| B | 0 | 190 | 36307 | 225.42 | 816 | 794 | 157.5 |
| B | 4 | 48 | 29273 | 180.77 | 816 | 794 | 157.5 |
| C | 14 | 238 | 119701 | 643.53 | 784 | 789 | 184.8 |
| C | 7 | 247 | 89651 | 480.9 | 784 | 789 | 184.8 |
| C | 10 | 22 | 7578 | 36.74 | 784 | 789 | 184.8 |
| D | 4 | 239 | 29045 | 145.01 | 795 | 769 | 195.0 |
| D | 2 | 234 | 27833 | 138.8 | 795 | 769 | 195.0 |
| D | 13 | 172 | 16285 | 79.57 | 795 | 769 | 195.0 |
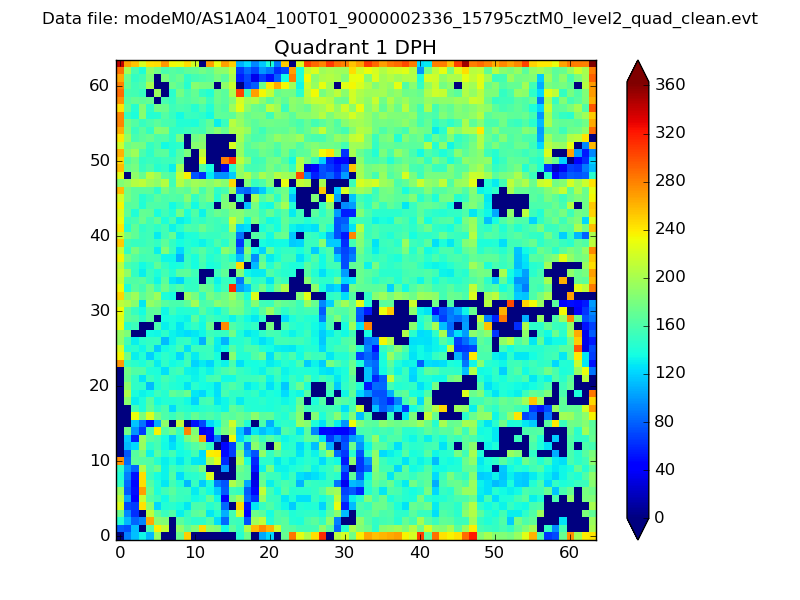
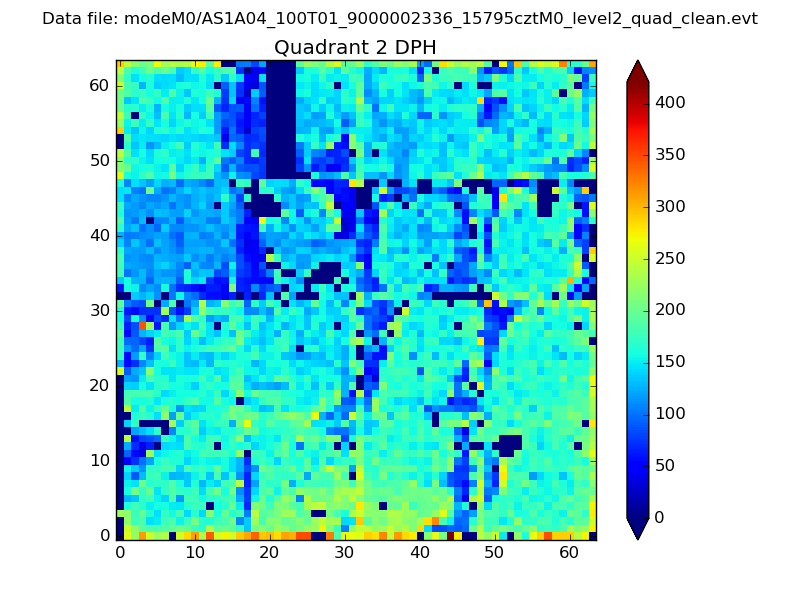
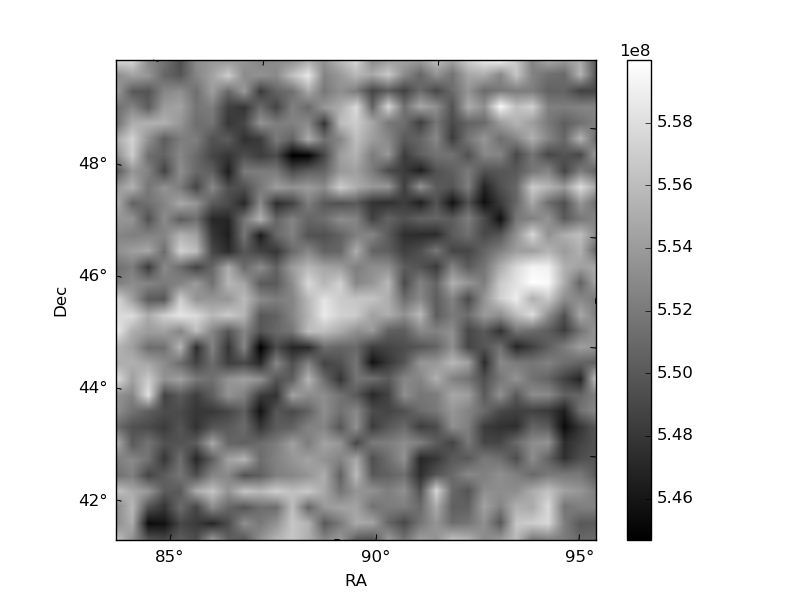
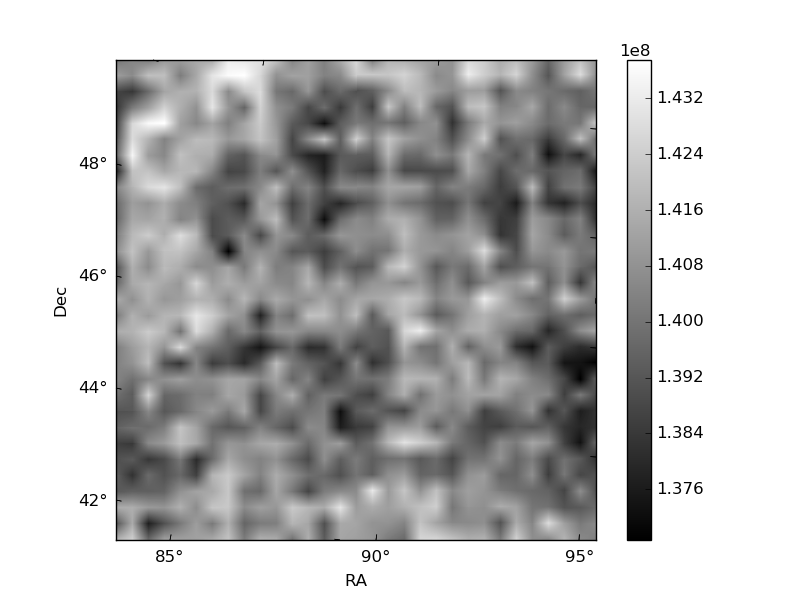
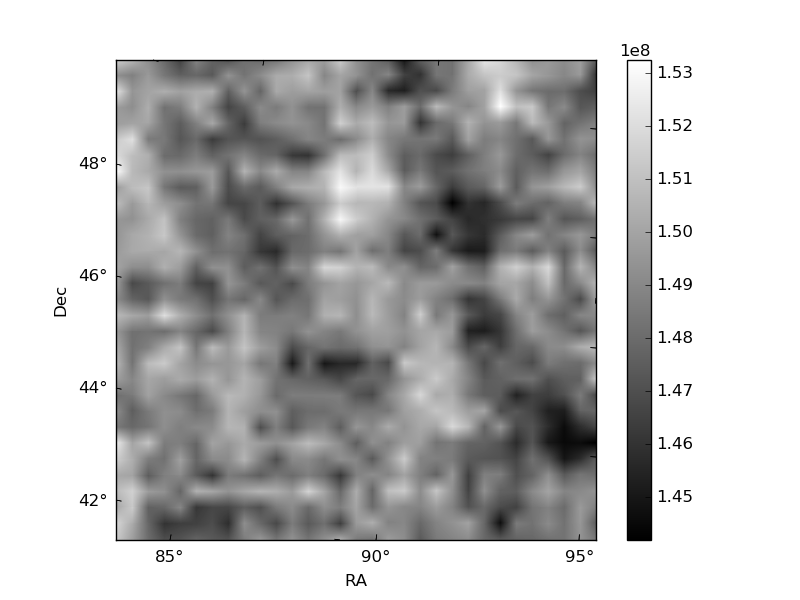
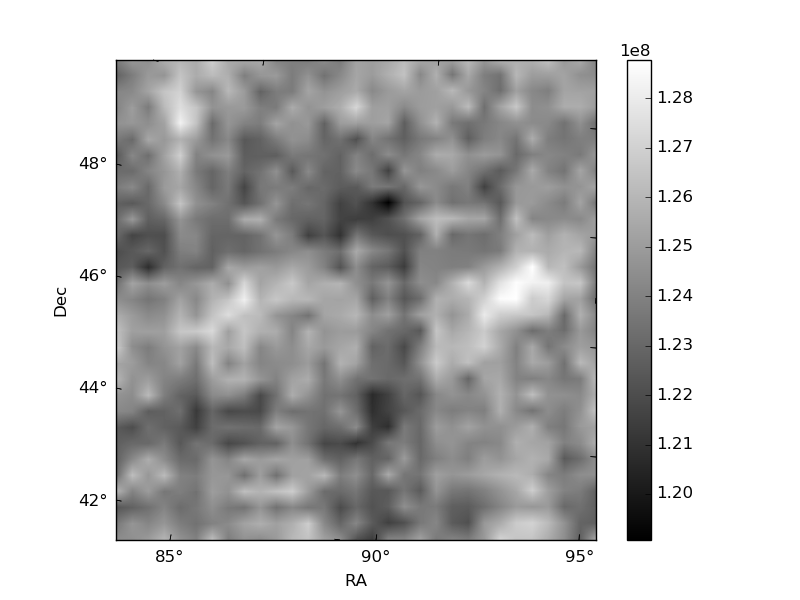
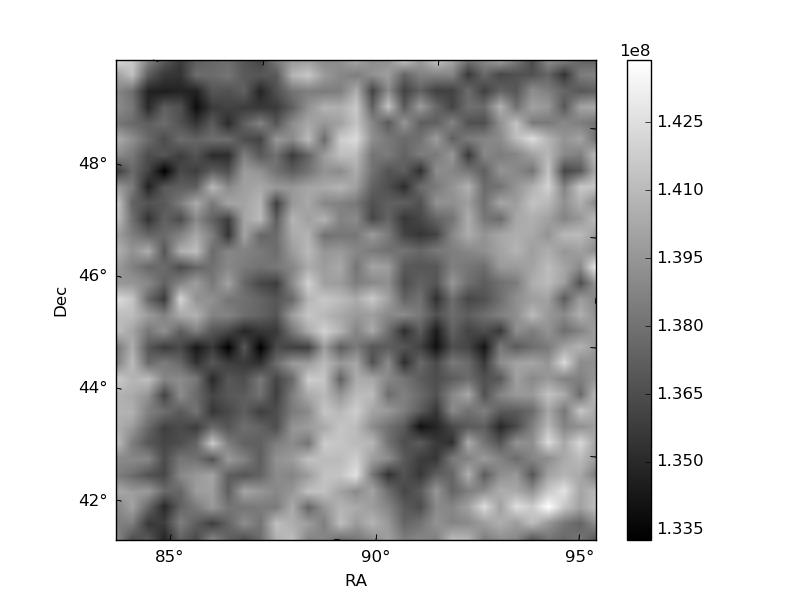
Histogram calculated using DETX and DETY for each event in the final _common_clean file
| Quadrant A |  |
 |
Quadrant B |
|---|---|---|---|
| Quadrant D | 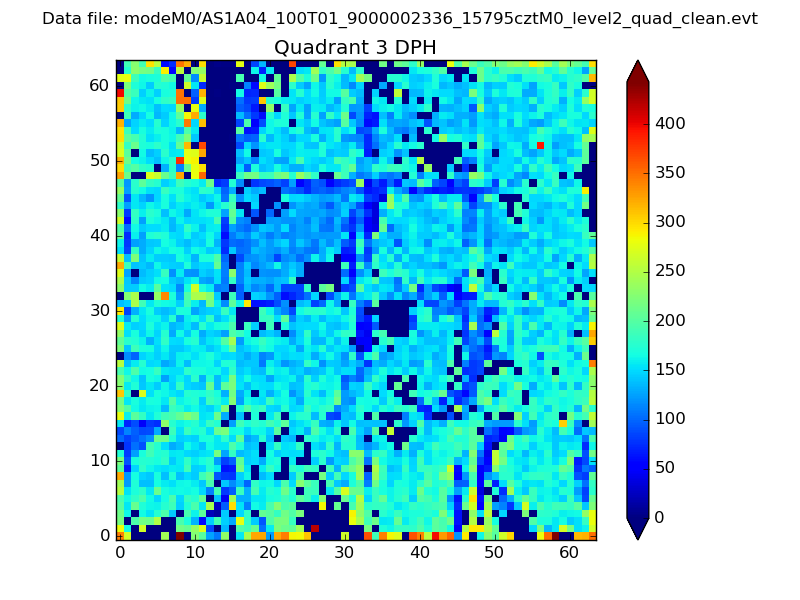 |
 |
Quadrant C |
| Plot type | Count rate plots | Images |
|---|---|---|
| Comparison with Poisson distribution Blue bars denote a histogram of data divided into 1 sec bins. Red curve is a Poisson curve with rate = median count rate of data. |
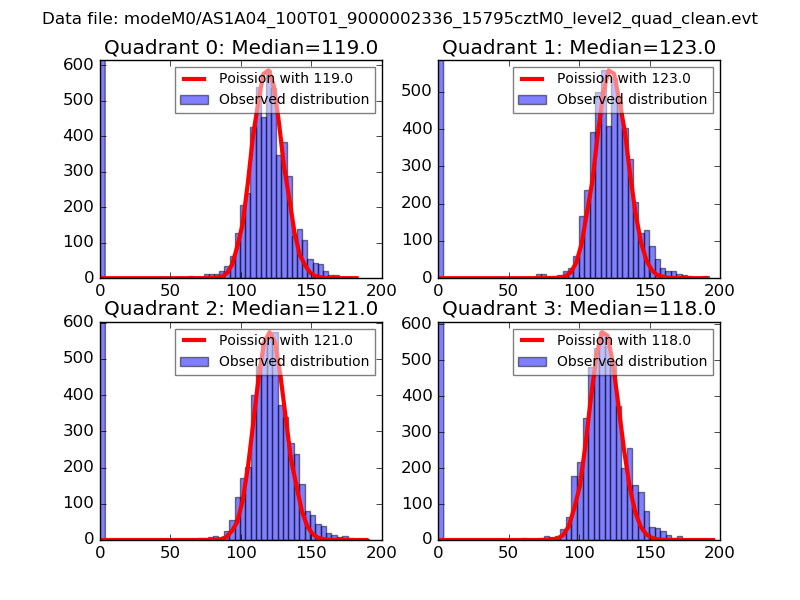 |
 |
| Quadrant-wise count rates Data is divided into 100 sec bins |
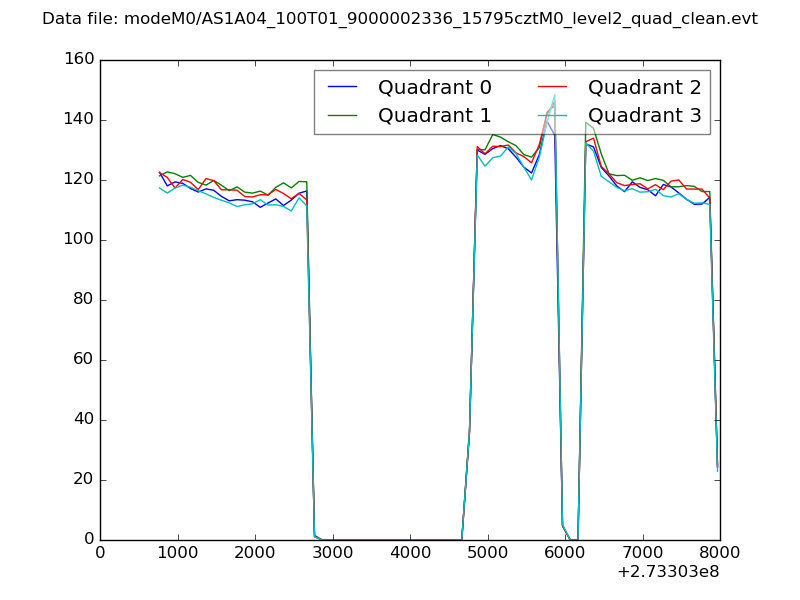 |
|
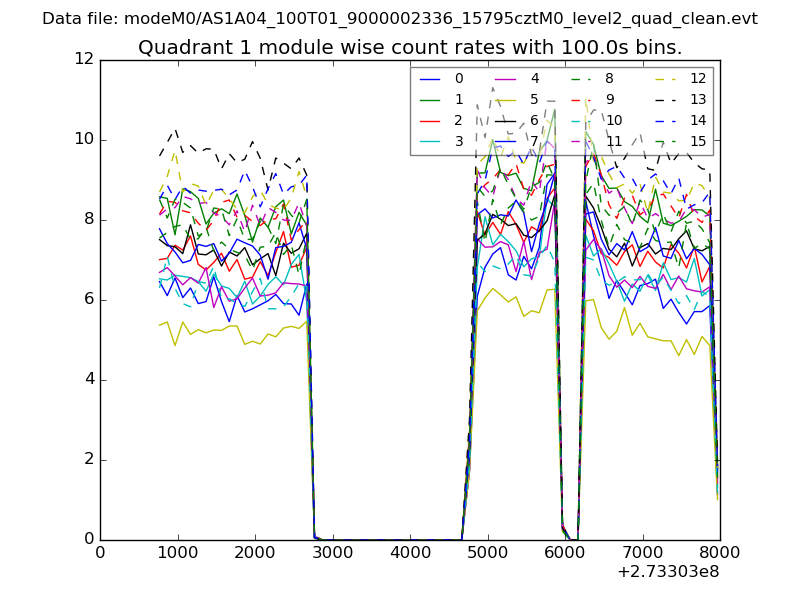
| Module-wise count rates for Quadrant A Data is divided into 100 sec bins |
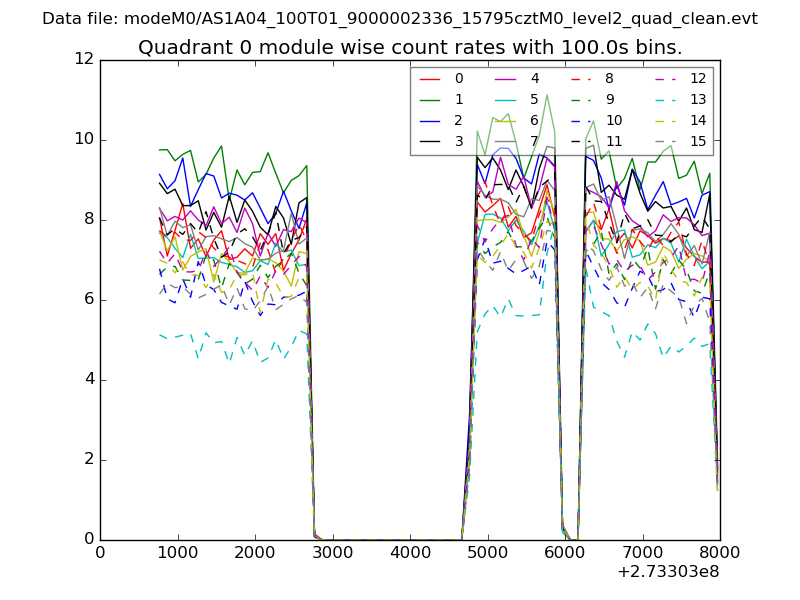 |
 |
| Module-wise count rates for Quadrant B Data is divided into 100 sec bins |
 |
 |
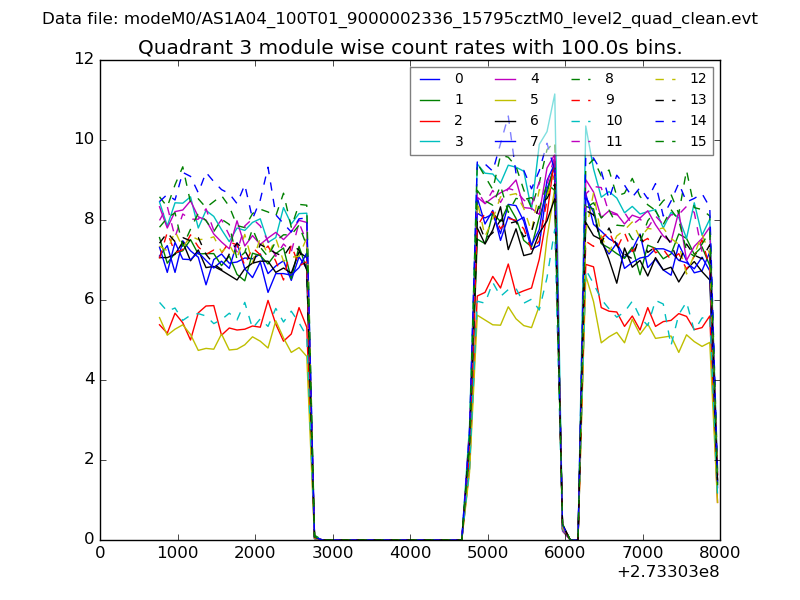
| Module-wise count rates for Quadrant C Data is divided into 100 sec bins |
 |
 |
| Module-wise count rates for Quadrant D Data is divided into 100 sec bins |
 |
 |
| Parameter | Plot |
|---|---|
| CZT HV Monitor | 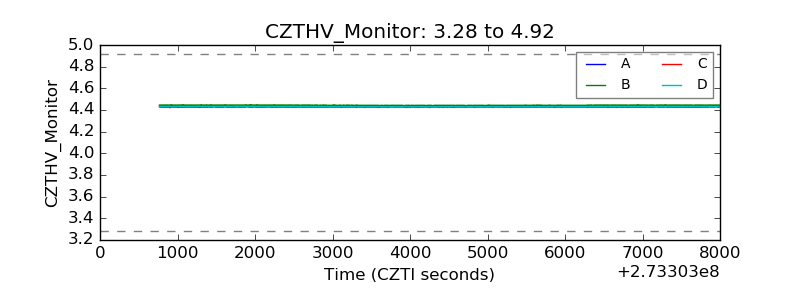 |
| D_VDD | 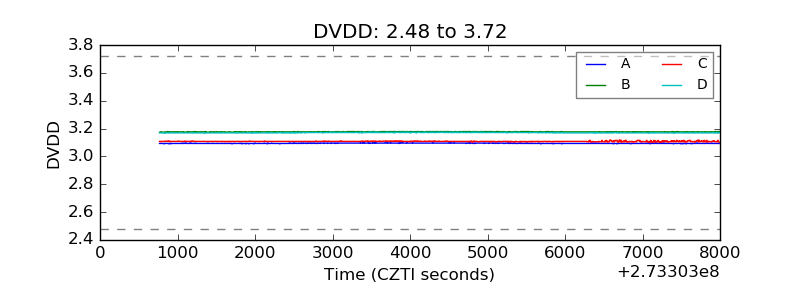 |
| Temperature 1 | 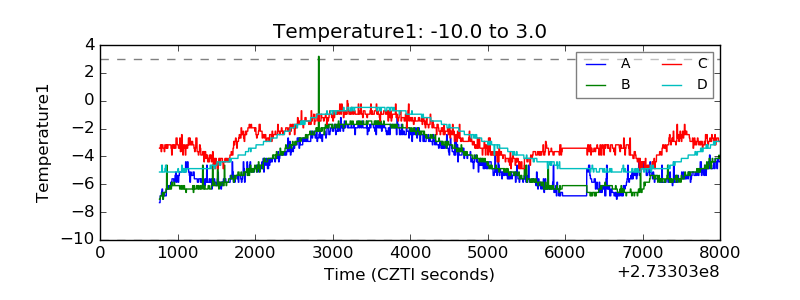 |
| Veto HV Monitor | 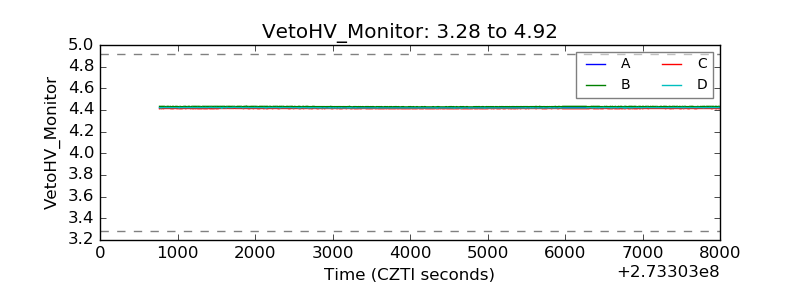 |
| Veto LLD | 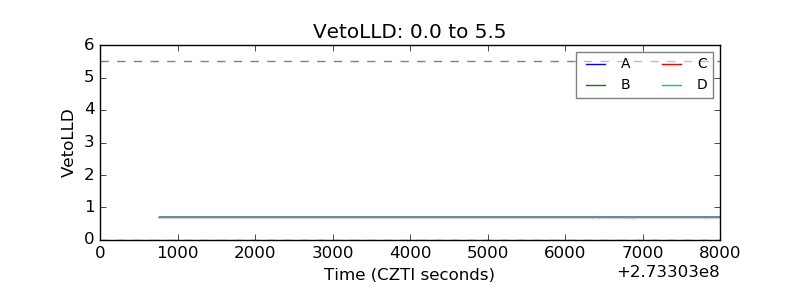 |
| Alpha Counter |  |
| _CPM_Rate | 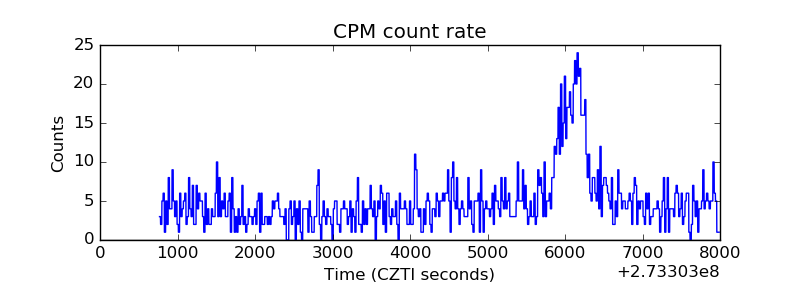 |
| CZT Counter | 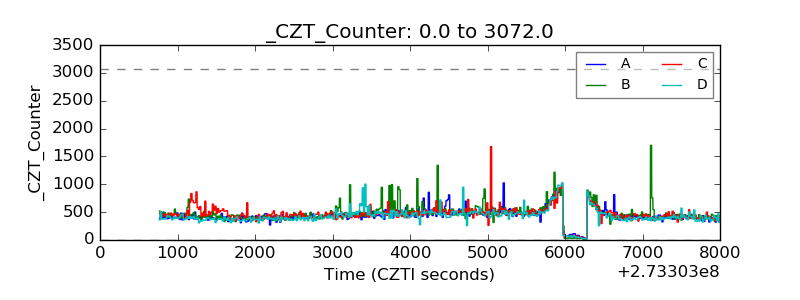 |
| +2.5 Volts monitor |  |
| +5 Volts monitor |  |
| _ROLL_ROT | 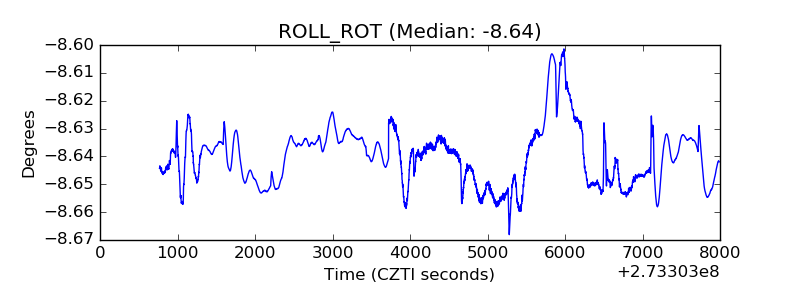 |
| _Roll_DEC | 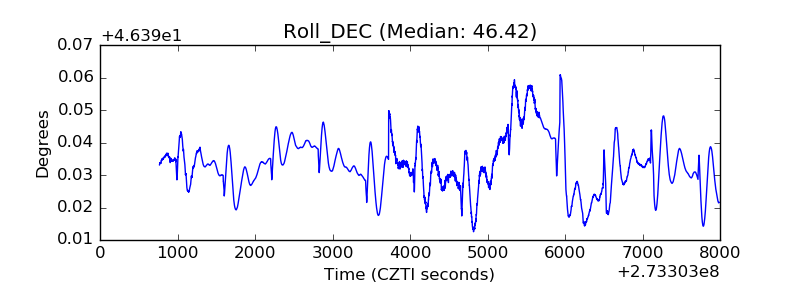 |
| _Roll_RA |  |
| Veto Counter | 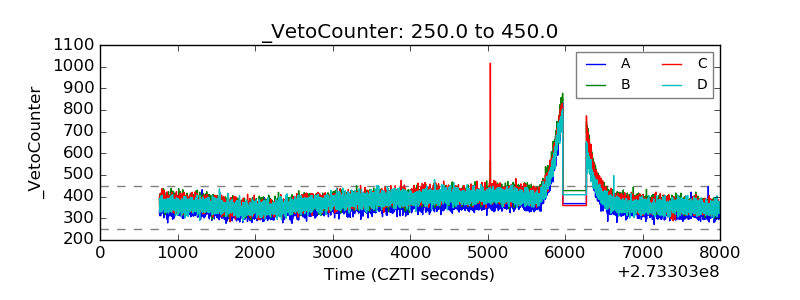 |