| Param | Original file | Final file |
|---|---|---|
| Filename | modeM0/AS1A04_100T01_9000002336_15797cztM0_level2.evt | modeM0/AS1A04_100T01_9000002336_15797cztM0_level2_quad_clean.evt |
| Size (bytes) | 265,668,480 | 40,354,560 |
| Size | 253.4 MB | 38.5 MB |
| Events in quadrant A | 2,019,238 | 231,443 |
| Events in quadrant B | 2,139,134 | 237,747 |
| Events in quadrant C | 1,814,044 | 235,448 |
| Events in quadrant D | 1,796,248 | 230,938 |
| Mode SS | |||
|---|---|---|---|
| Quadrant | BADHDUFLAG | Total packets | Discarded packets |
| A | 0 | 80 | 0 |
| B | 0 | 80 | 0 |
| C | 0 | 80 | 0 |
| D | 0 | 80 | 0 |
| Mode M0 | |||
|---|---|---|---|
| Quadrant | BADHDUFLAG | Total packets | Discarded packets |
| A | 0 | 8847 | 0 |
| B | 0 | 9011 | 0 |
| C | 0 | 8165 | 0 |
| D | 0 | 8389 | 0 |
| Quadrant | Total seconds | Saturated seconds | Saturation percentage |
|---|---|---|---|
| A | 4057 | 86 | 2.119793% |
| B | 4057 | 26 | 0.640868% |
| C | 4057 | 7 | 0.172541% |
| D | 4057 | 12 | 0.295785% |
Noise dominated data is calculated using 1-second bins in cleaned event files. If a bin has >2000 counts, and if more than 50% of those come from <1% of pixels, then it is considered to be noise-dominated and hence unusable.
| Quadrant | # 1 sec bins | Bins with >0 counts | Bins with >2000 counts | High rate bins dominated by noise | Noise dominated (total time) | Noise dominated (detector-on time) | Marked lightcurve |
|---|---|---|---|---|---|---|---|
| A | 4058 | 4058 | 69 | 69 | 1.70% | 1.70% | 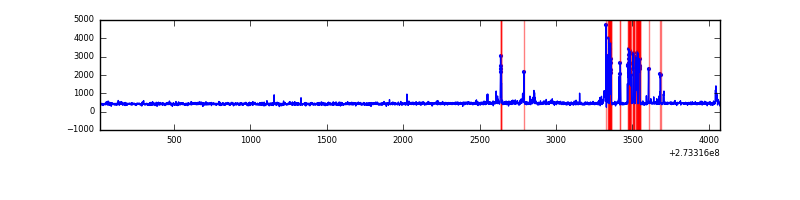 |
| B | 4058 | 4058 | 13 | 13 | 0.32% | 0.32% | 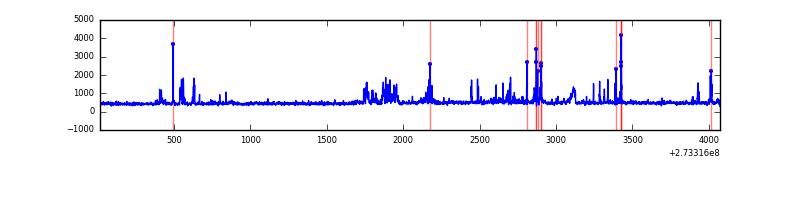 |
| C | 4058 | 4058 | 1 | 1 | 0.02% | 0.02% | 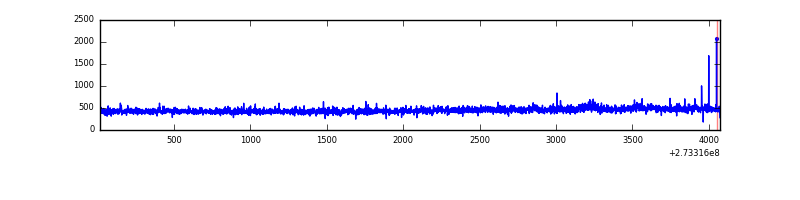 |
| D | 4058 | 4058 | 9 | 9 | 0.22% | 0.22% | 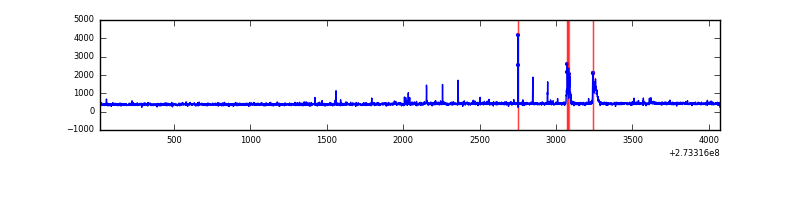 |
Top three noisy pixels from each quadrant. If the there are fewer than three noisy pixels in the level2.evt file, extra rows are filled as -1
| Pixel properties | Quadrant properties | ||||||
|---|---|---|---|---|---|---|---|
| Quadrant | DetID | PixID | Counts | Sigma | Mean | Median | Sigma |
| A | 15 | 239 | 261958 | 2785.32 | 454 | 443 | 93.9 |
| A | 0 | 226 | 4136 | 39.33 | 454 | 443 | 93.9 |
| A | 14 | 254 | 3757 | 35.3 | 454 | 443 | 93.9 |
| B | 0 | 85 | 89450 | 1000.92 | 455 | 443 | 88.9 |
| B | 7 | 220 | 69904 | 781.12 | 455 | 443 | 88.9 |
| B | 10 | 245 | 39308 | 437.05 | 455 | 443 | 88.9 |
| C | 14 | 238 | 67841 | 654.48 | 438 | 441 | 103.0 |
| C | 7 | 247 | 20874 | 198.41 | 438 | 441 | 103.0 |
| C | 10 | 22 | 8765 | 80.83 | 438 | 441 | 103.0 |
| D | 7 | 55 | 78773 | 673.71 | 444 | 432 | 116.3 |
| D | 2 | 234 | 18078 | 151.75 | 444 | 432 | 116.3 |
| D | 13 | 172 | 6663 | 53.58 | 444 | 432 | 116.3 |
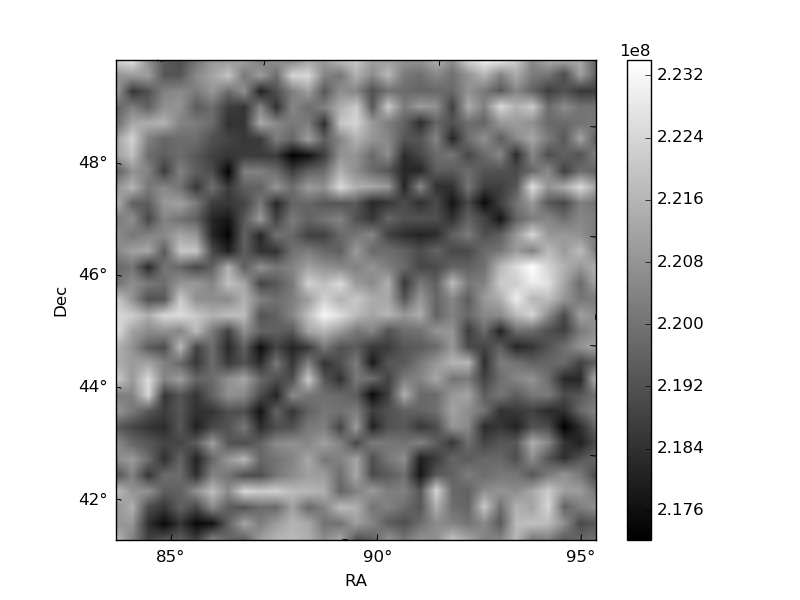
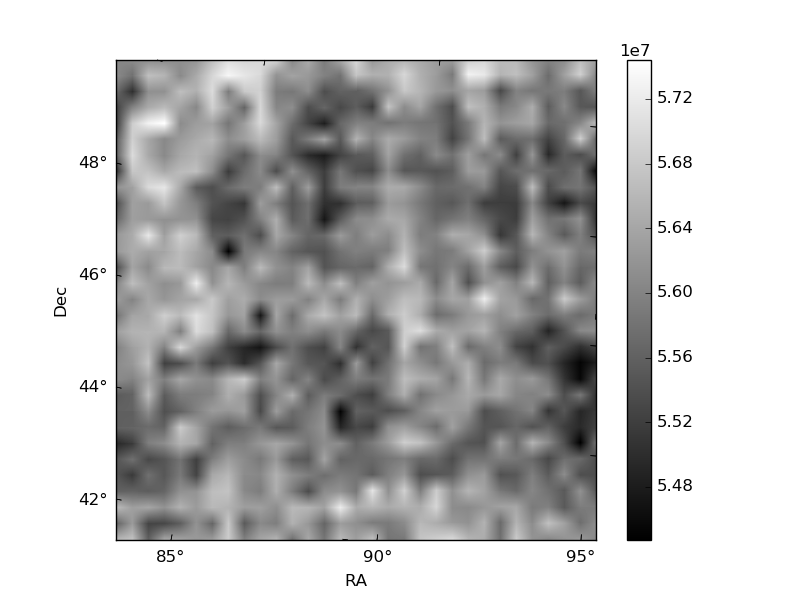
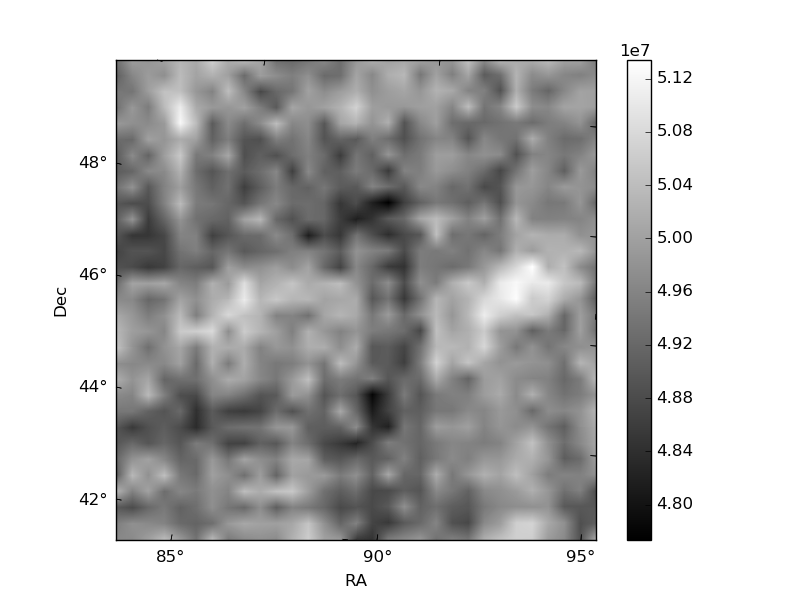
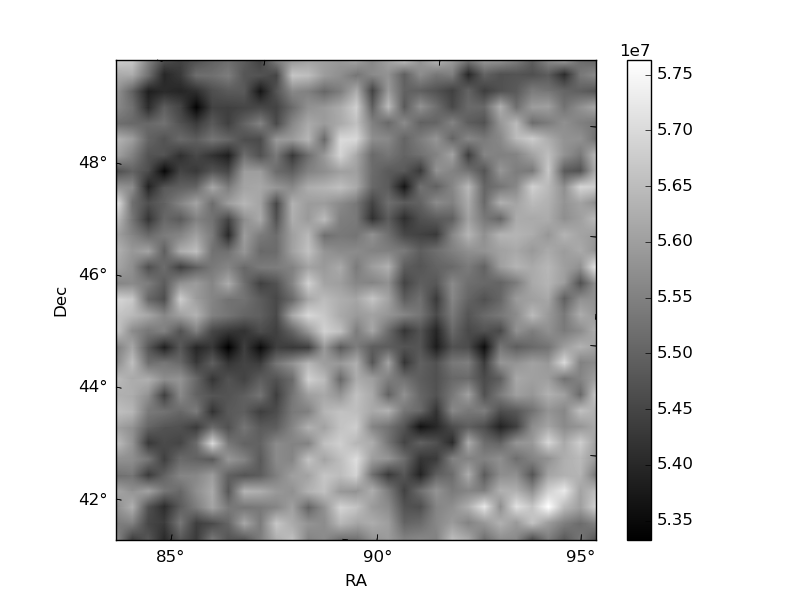
Histogram calculated using DETX and DETY for each event in the final _common_clean file
| Quadrant A | 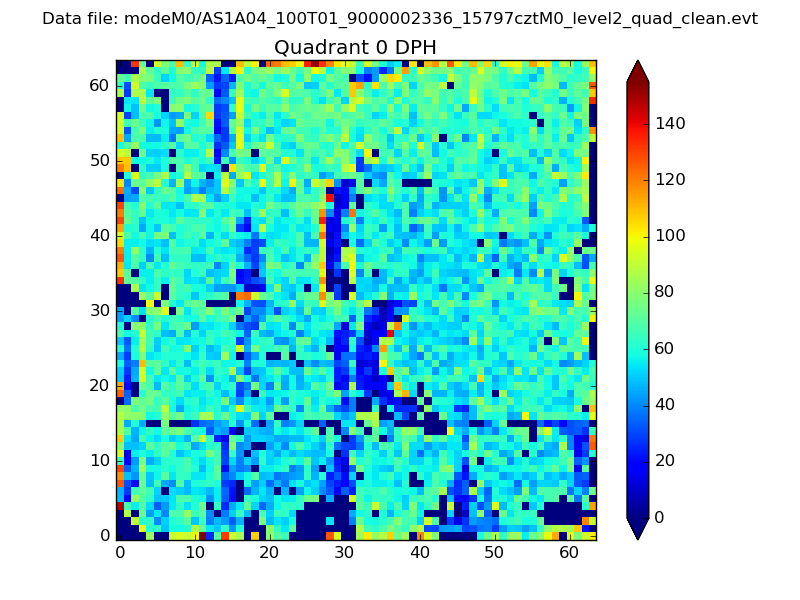 |
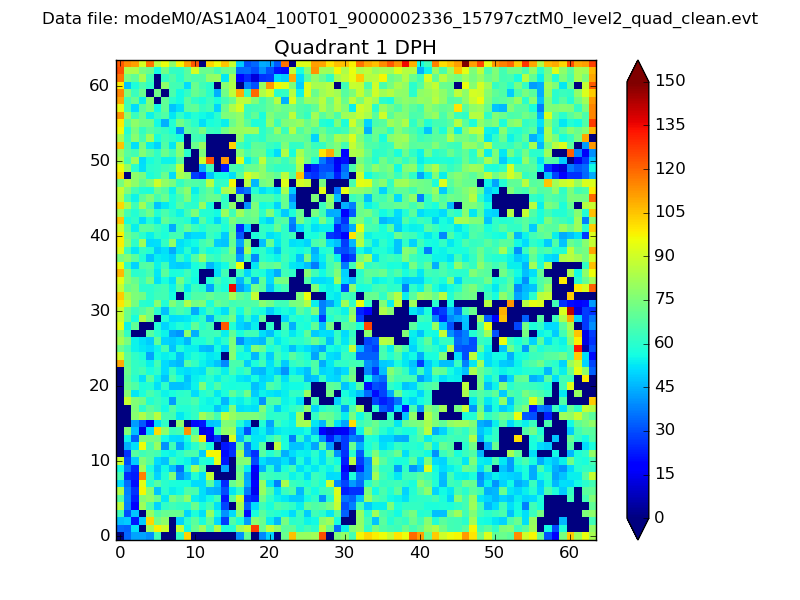 |
Quadrant B |
|---|---|---|---|
| Quadrant D | 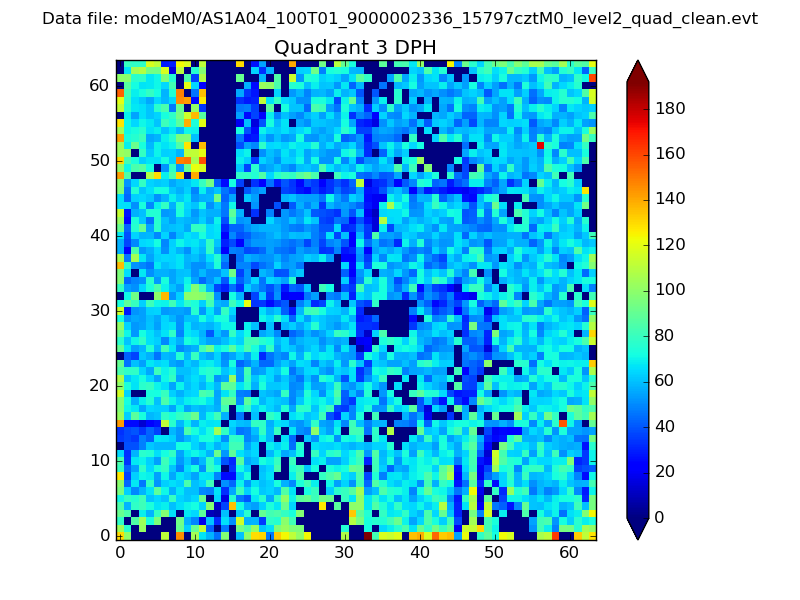 |
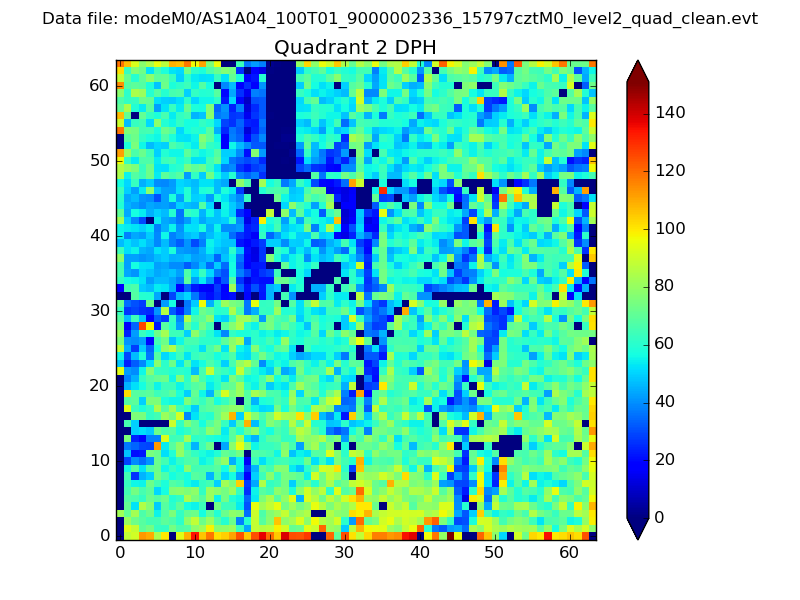 |
Quadrant C |
| Plot type | Count rate plots | Images |
|---|---|---|
| Comparison with Poisson distribution Blue bars denote a histogram of data divided into 1 sec bins. Red curve is a Poisson curve with rate = median count rate of data. |
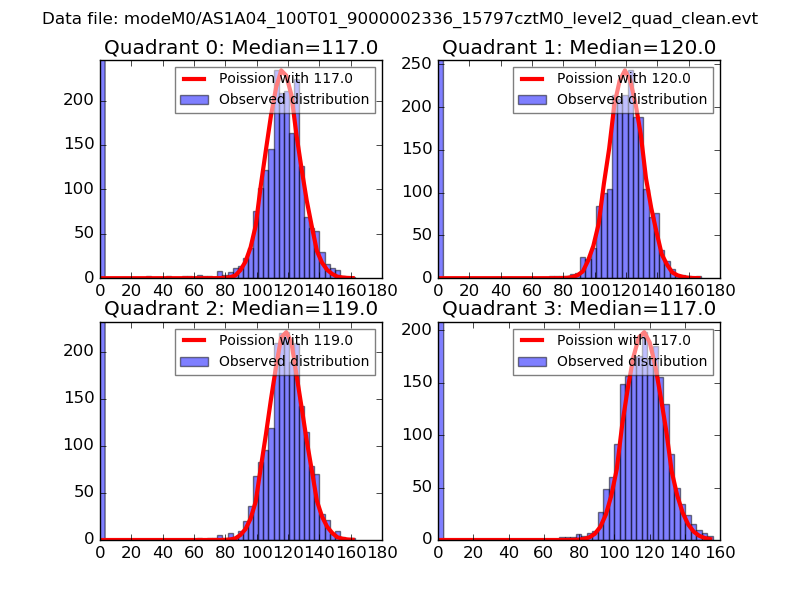 |
 |
| Quadrant-wise count rates Data is divided into 100 sec bins |
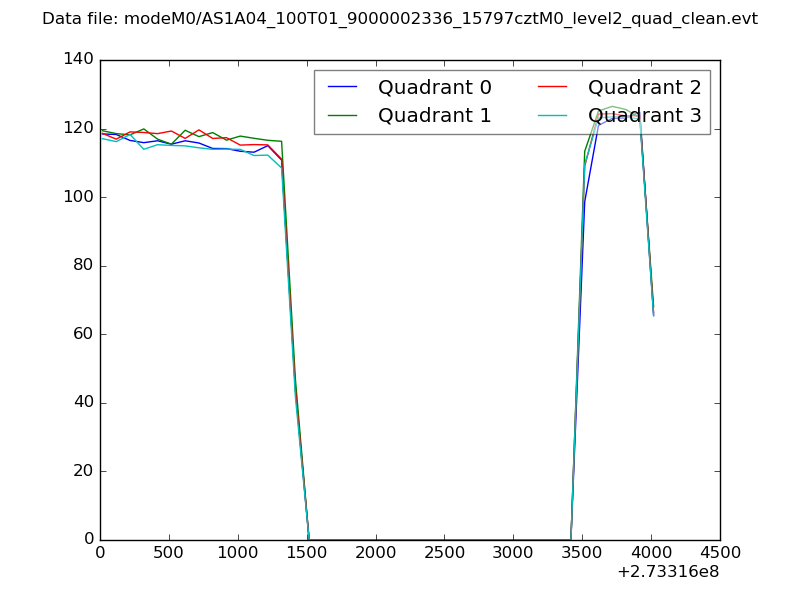 |
|
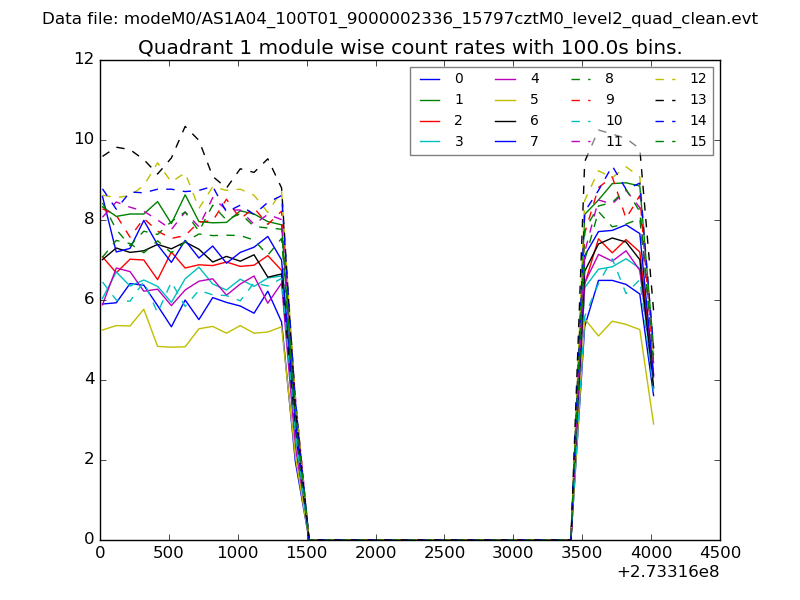
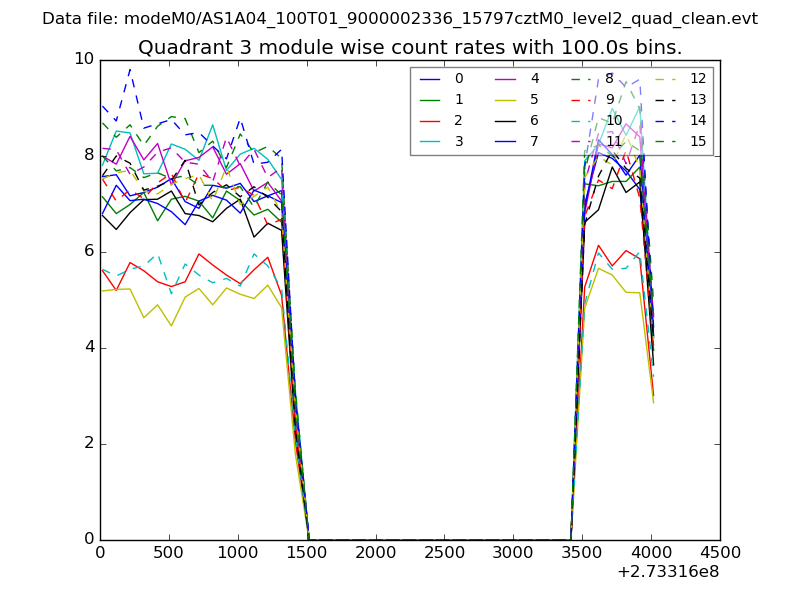
| Module-wise count rates for Quadrant A Data is divided into 100 sec bins |
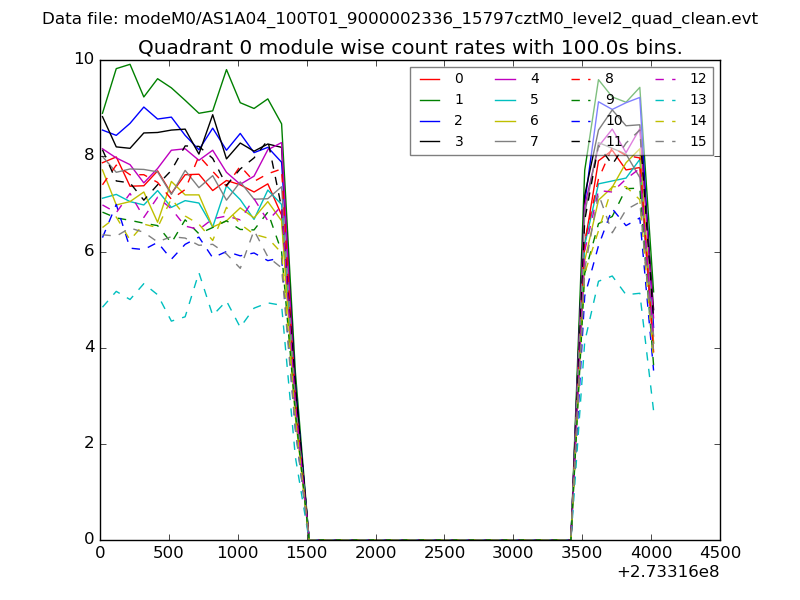 |
 |
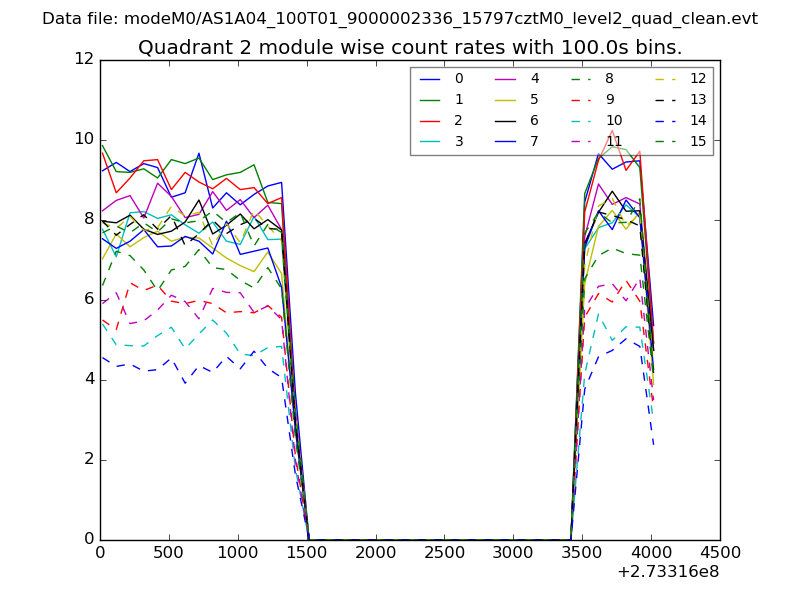
| Module-wise count rates for Quadrant B Data is divided into 100 sec bins |
 |
 |
| Module-wise count rates for Quadrant C Data is divided into 100 sec bins |
 |
 |
| Module-wise count rates for Quadrant D Data is divided into 100 sec bins |
 |
 |
| Parameter | Plot |
|---|---|
| CZT HV Monitor | 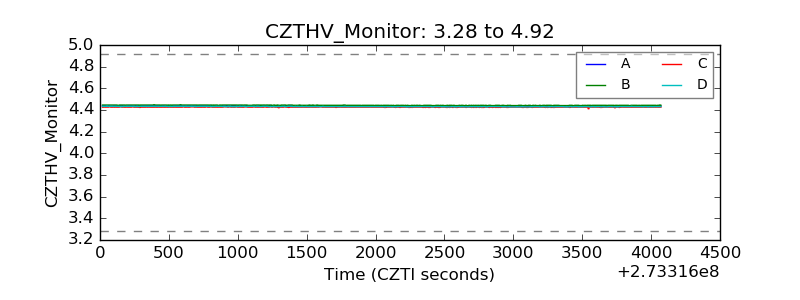 |
| D_VDD | 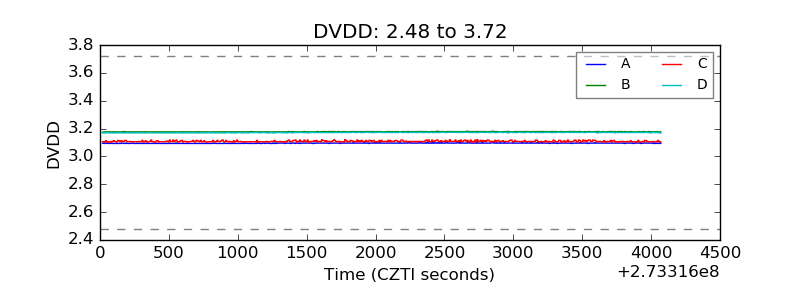 |
| Temperature 1 | 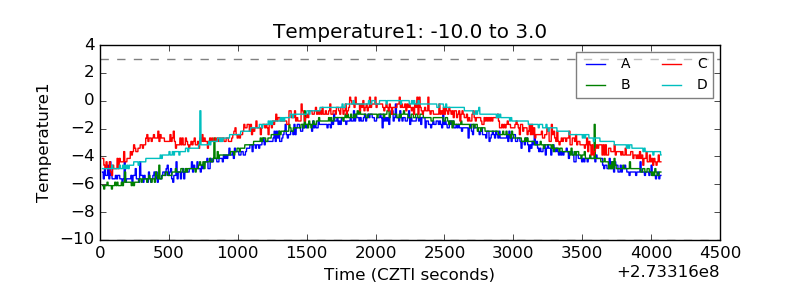 |
| Veto HV Monitor | 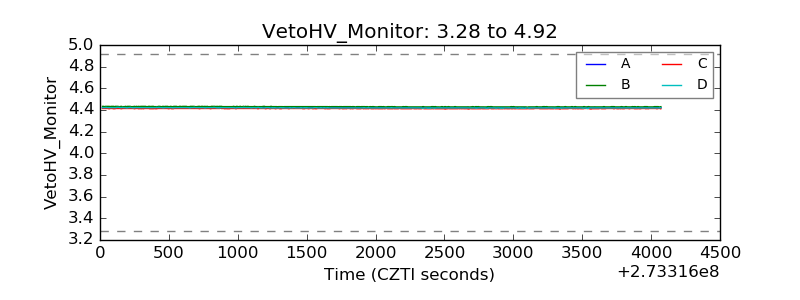 |
| Veto LLD | 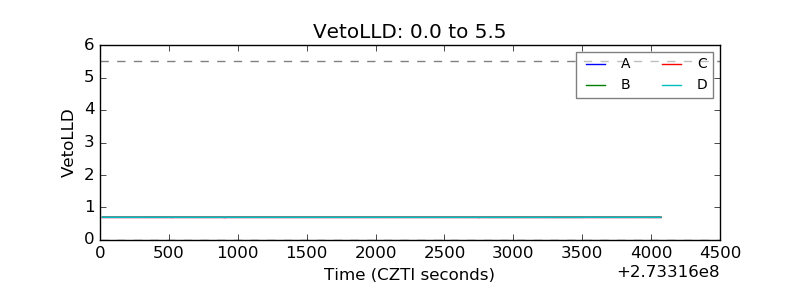 |
| Alpha Counter | 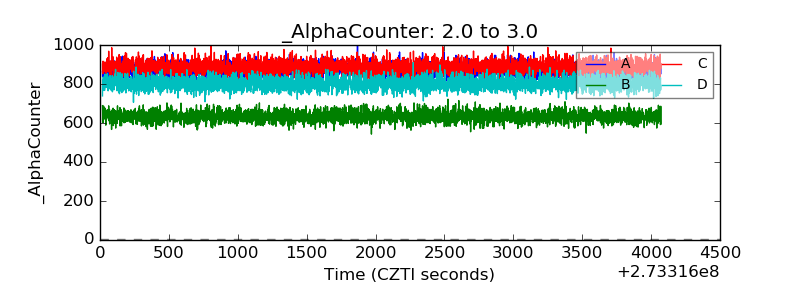 |
| _CPM_Rate | 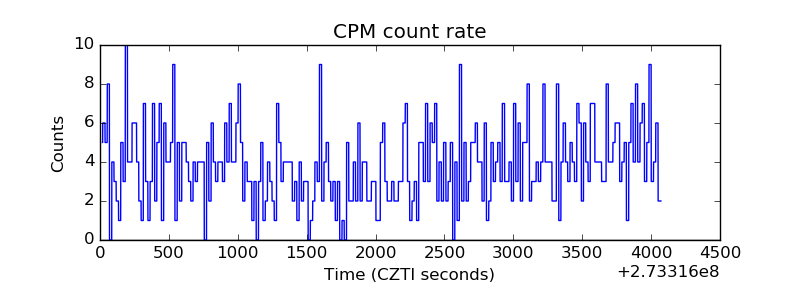 |
| CZT Counter | 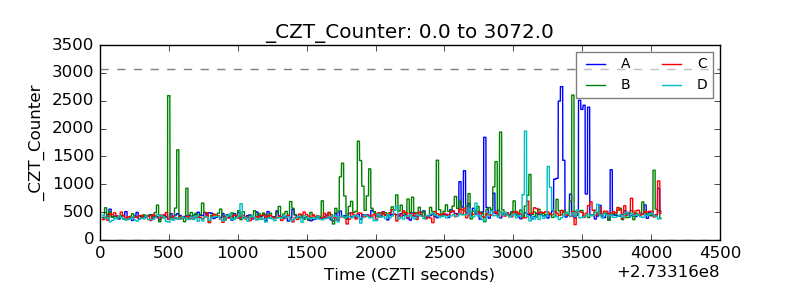 |
| +2.5 Volts monitor |  |
| +5 Volts monitor |  |
| _ROLL_ROT | 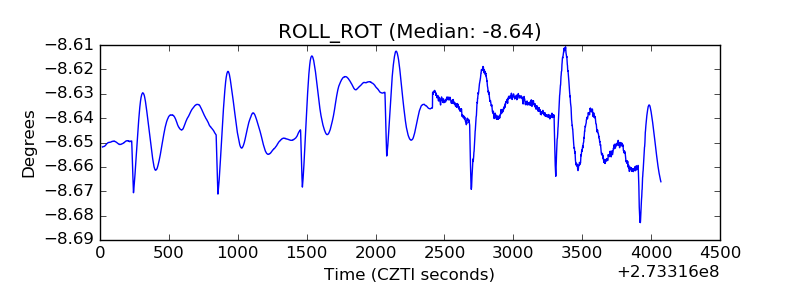 |
| _Roll_DEC | 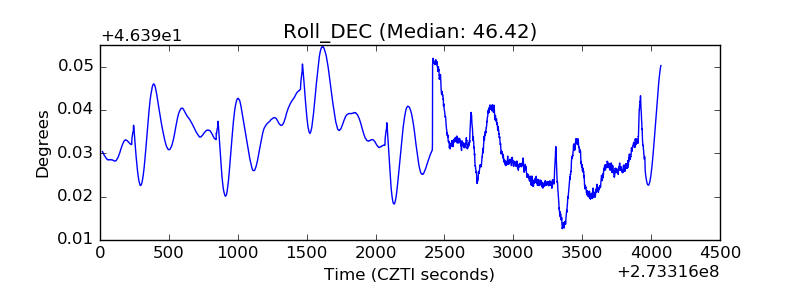 |
| _Roll_RA | 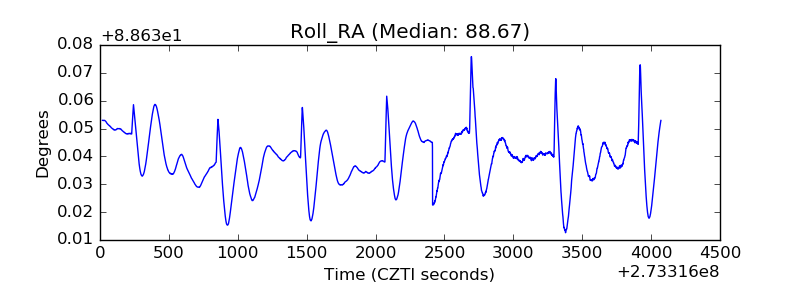 |
| Veto Counter | 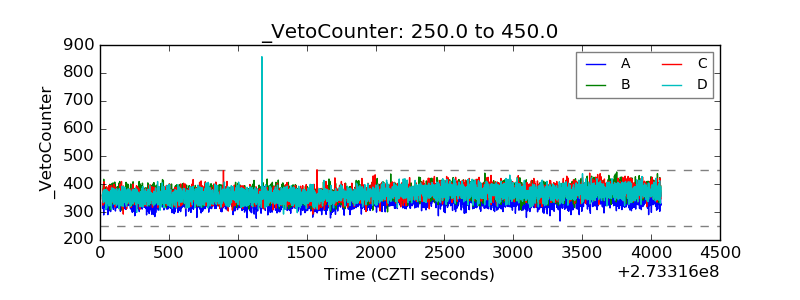 |