| Param | Original file | Final file |
|---|---|---|
| Filename | modeM0/AS1G08_028T01_9000002334_15764cztM0_level2.evt | modeM0/AS1G08_028T01_9000002334_15764cztM0_level2_quad_clean.evt |
| Size (bytes) | 427,944,960 | 70,994,880 |
| Size | 408.1 MB | 67.7 MB |
| Events in quadrant A | 3,102,948 | 431,426 |
| Events in quadrant B | 3,225,208 | 446,700 |
| Events in quadrant C | 3,130,402 | 421,231 |
| Events in quadrant D | 3,071,766 | 409,027 |
| Mode SS | |||
|---|---|---|---|
| Quadrant | BADHDUFLAG | Total packets | Discarded packets |
| A | 0 | 128 | 0 |
| B | 0 | 128 | 0 |
| C | 0 | 128 | 0 |
| D | 0 | 128 | 0 |
| Mode M0 | |||
|---|---|---|---|
| Quadrant | BADHDUFLAG | Total packets | Discarded packets |
| A | 0 | 13137 | 3 |
| B | 0 | 13362 | 2 |
| C | 0 | 13132 | 2 |
| D | 0 | 13368 | 2 |
| Mode M9 | |||
|---|---|---|---|
| Quadrant | BADHDUFLAG | Total packets | Discarded packets |
| A | 0 | 18 | 0 |
| B | 0 | 18 | 0 |
| C | 0 | 18 | 0 |
| D | 0 | 19 | 0 |
| Quadrant | Total seconds | Saturated seconds | Saturation percentage |
|---|---|---|---|
| A | 6324 | 56 | 0.885515% |
| B | 6324 | 86 | 1.359899% |
| C | 6324 | 83 | 1.312460% |
| D | 6324 | 38 | 0.600886% |
Noise dominated data is calculated using 1-second bins in cleaned event files. If a bin has >2000 counts, and if more than 50% of those come from <1% of pixels, then it is considered to be noise-dominated and hence unusable.
| Quadrant | # 1 sec bins | Bins with >0 counts | Bins with >2000 counts | High rate bins dominated by noise | Noise dominated (total time) | Noise dominated (detector-on time) | Marked lightcurve |
|---|---|---|---|---|---|---|---|
| A | 7450 | 6326 | 0 | 0 | 0.00% | 0.00% | 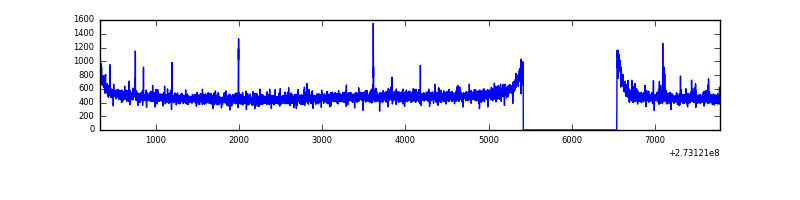 |
| B | 7450 | 6326 | 1 | 1 | 0.01% | 0.02% | 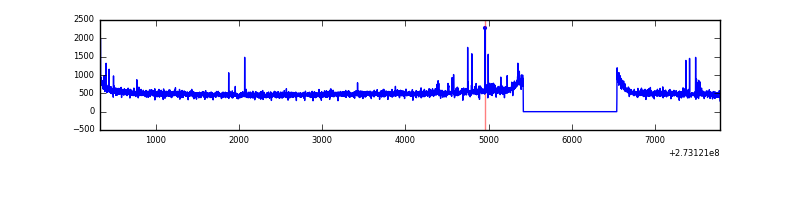 |
| C | 7450 | 6326 | 0 | 0 | 0.00% | 0.00% | 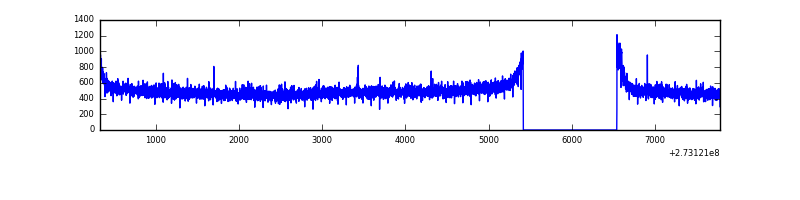 |
| D | 7450 | 6326 | 13 | 13 | 0.17% | 0.21% | 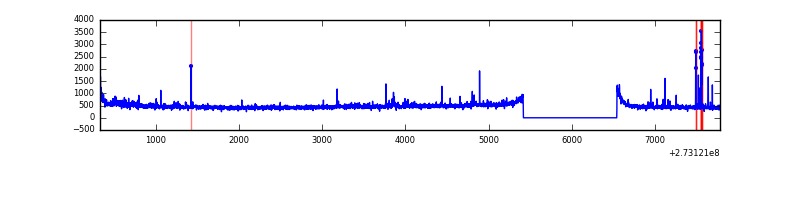 |
Top three noisy pixels from each quadrant. If the there are fewer than three noisy pixels in the level2.evt file, extra rows are filled as -1
| Pixel properties | Quadrant properties | ||||||
|---|---|---|---|---|---|---|---|
| Quadrant | DetID | PixID | Counts | Sigma | Mean | Median | Sigma |
| A | 9 | 143 | 14963 | 87.52 | 800 | 785 | 162.0 |
| A | 4 | 2 | 10836 | 62.04 | 800 | 785 | 162.0 |
| A | 0 | 226 | 7119 | 39.1 | 800 | 785 | 162.0 |
| B | 4 | 173 | 24714 | 156.56 | 804 | 785 | 152.8 |
| B | 4 | 251 | 19337 | 121.38 | 804 | 785 | 152.8 |
| B | 12 | 111 | 17820 | 111.46 | 804 | 785 | 152.8 |
| C | 14 | 238 | 118398 | 656.08 | 766 | 773 | 179.3 |
| C | 3 | 233 | 13929 | 73.38 | 766 | 773 | 179.3 |
| C | 7 | 247 | 6315 | 30.91 | 766 | 773 | 179.3 |
| D | 1 | 52 | 133235 | 644.57 | 762 | 746 | 205.5 |
| D | 5 | 51 | 24368 | 114.92 | 762 | 746 | 205.5 |
| D | 2 | 234 | 22179 | 104.27 | 762 | 746 | 205.5 |
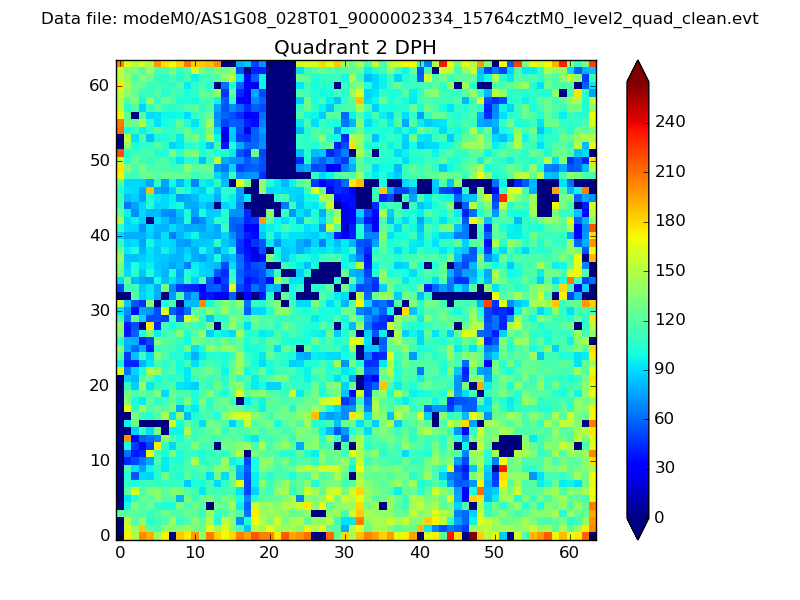
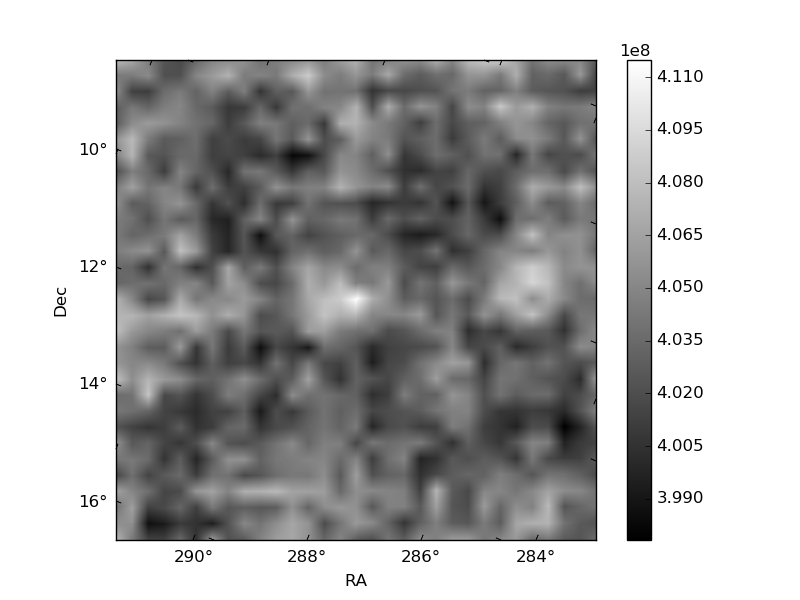
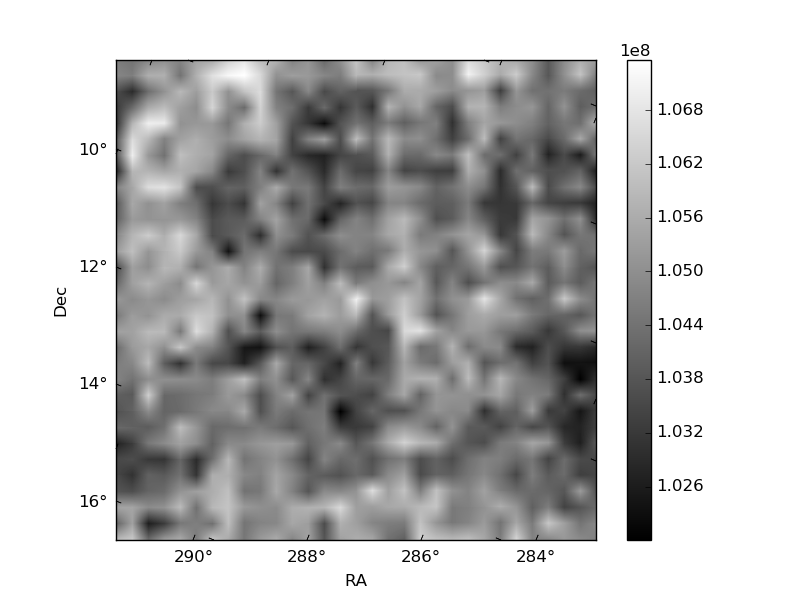
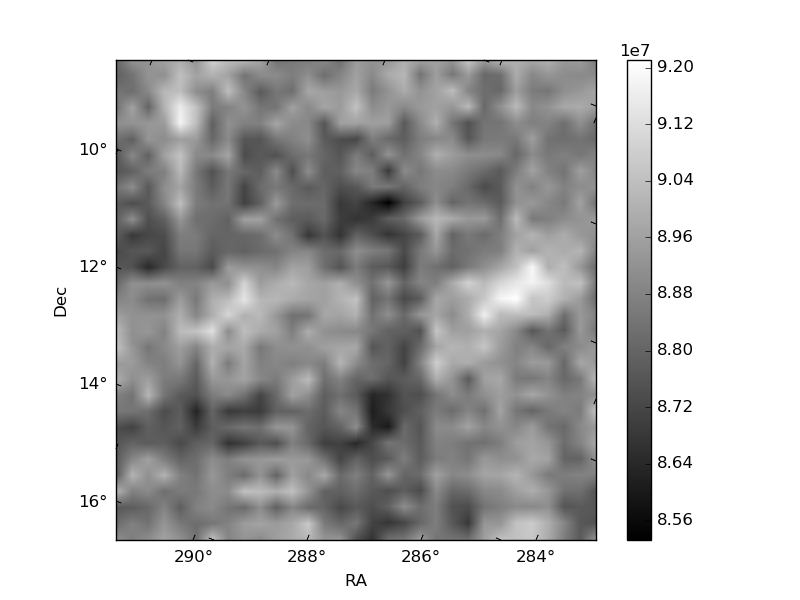
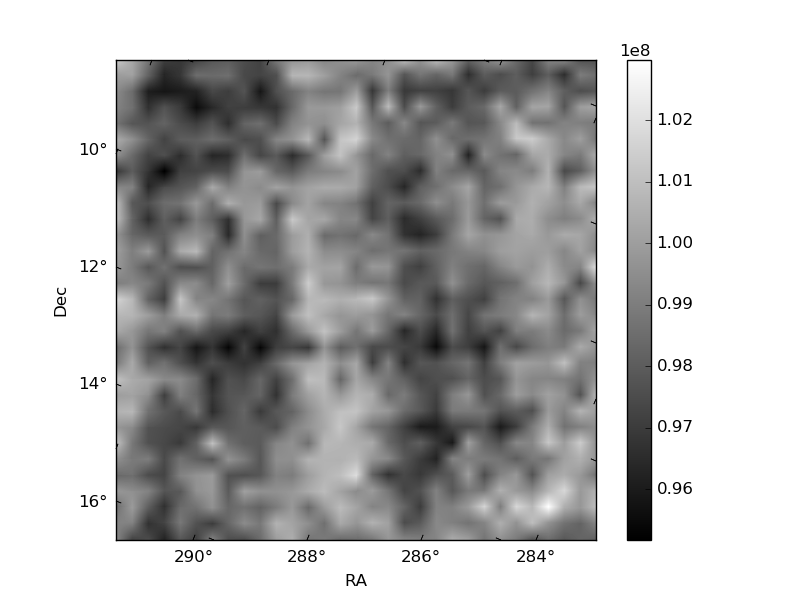
Histogram calculated using DETX and DETY for each event in the final _common_clean file
| Quadrant A | 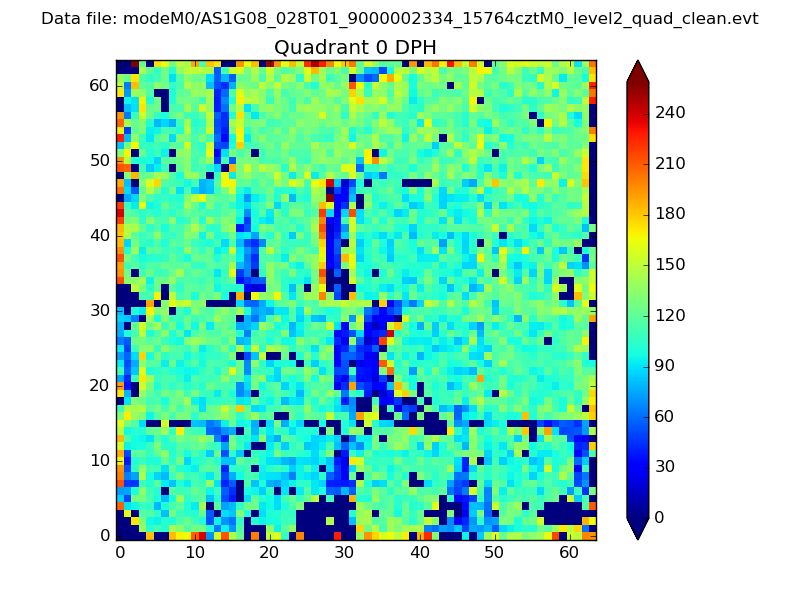 |
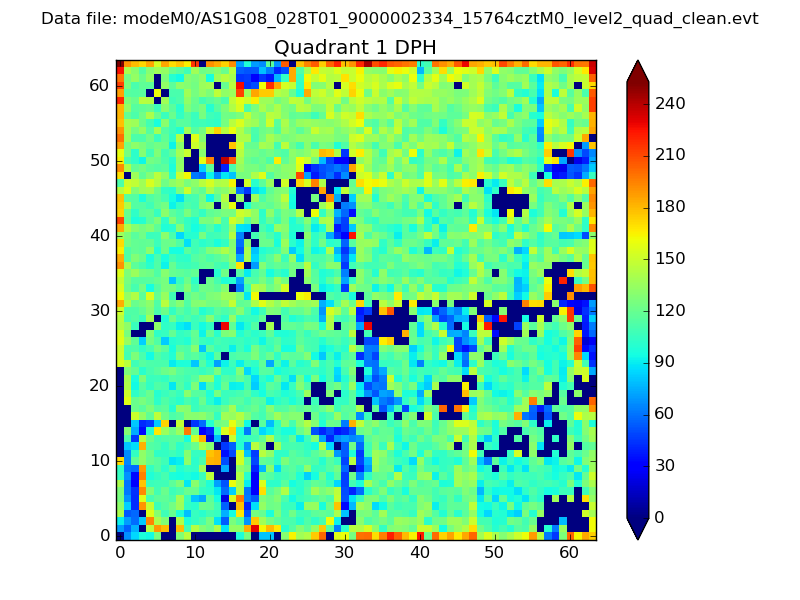 |
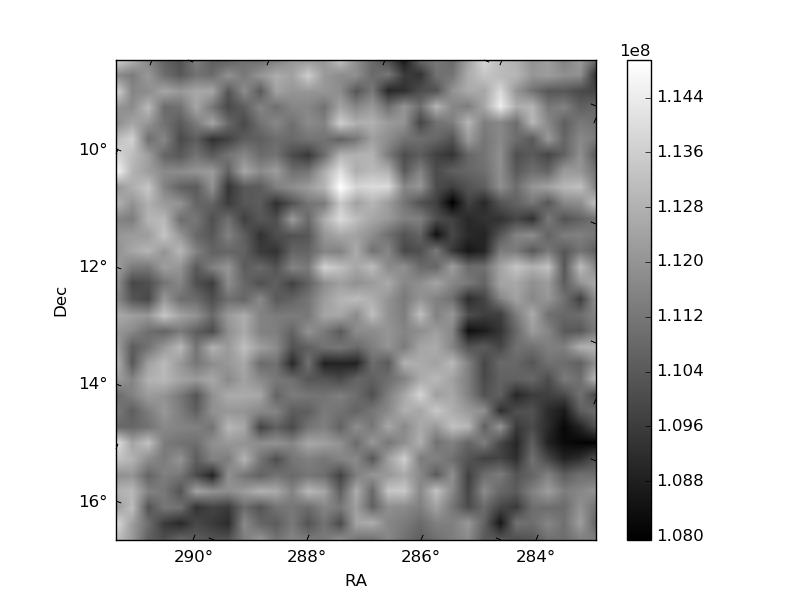
Quadrant B |
|---|---|---|---|
| Quadrant D | 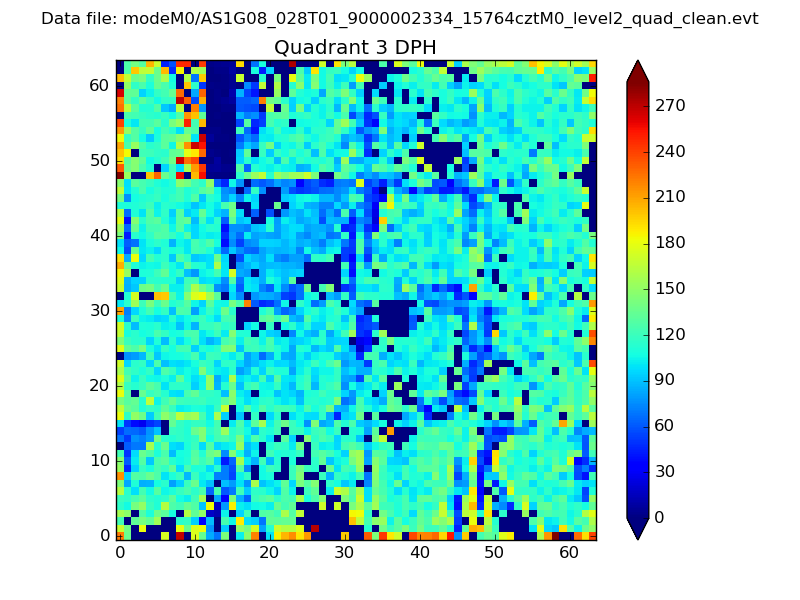 |
 |
Quadrant C |
| Plot type | Count rate plots | Images |
|---|---|---|
| Comparison with Poisson distribution Blue bars denote a histogram of data divided into 1 sec bins. Red curve is a Poisson curve with rate = median count rate of data. |
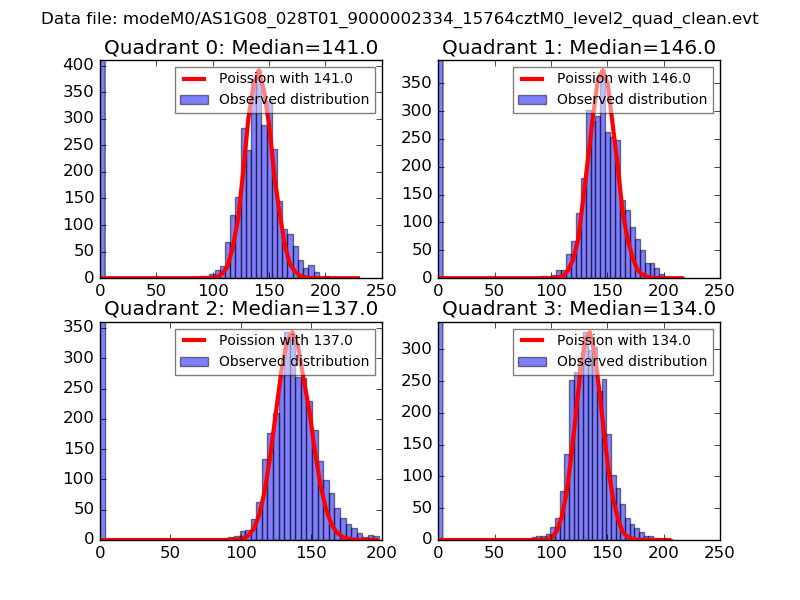 |
 |
| Quadrant-wise count rates Data is divided into 100 sec bins |
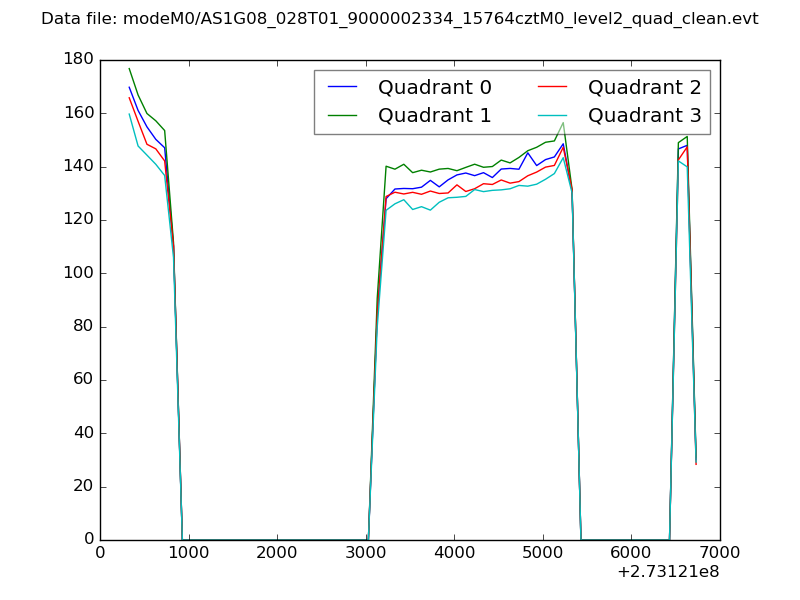 |
|
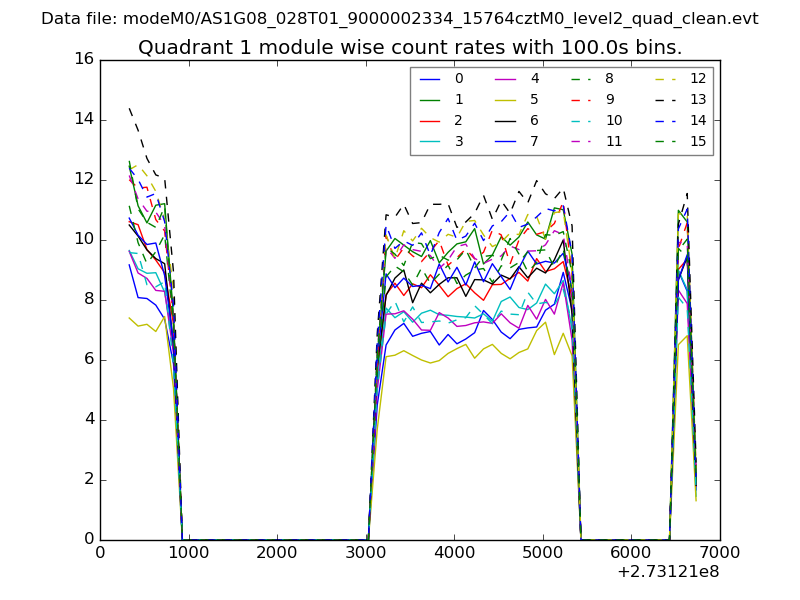
| Module-wise count rates for Quadrant A Data is divided into 100 sec bins |
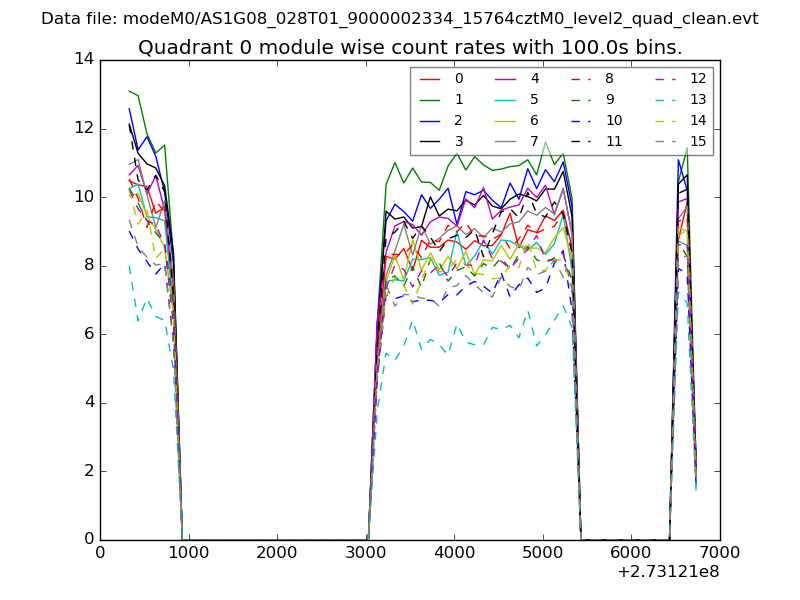 |
 |
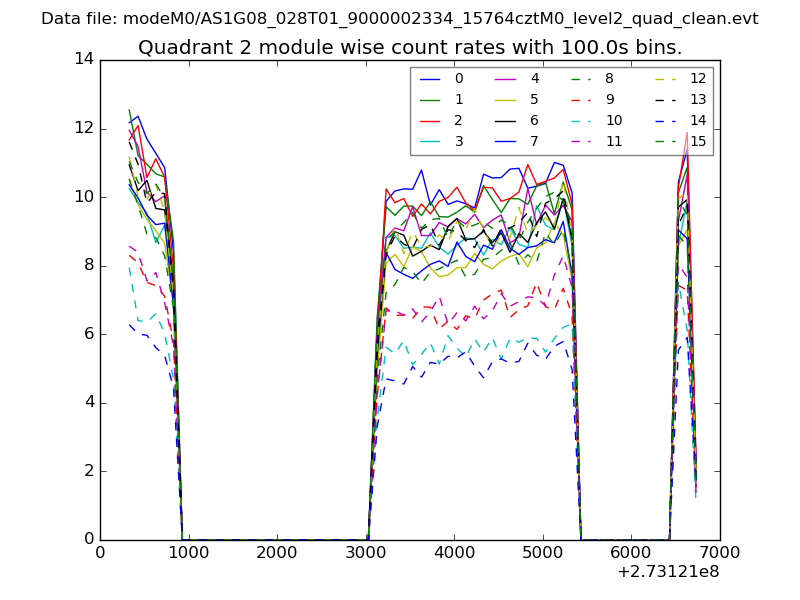
| Module-wise count rates for Quadrant B Data is divided into 100 sec bins |
 |
 |
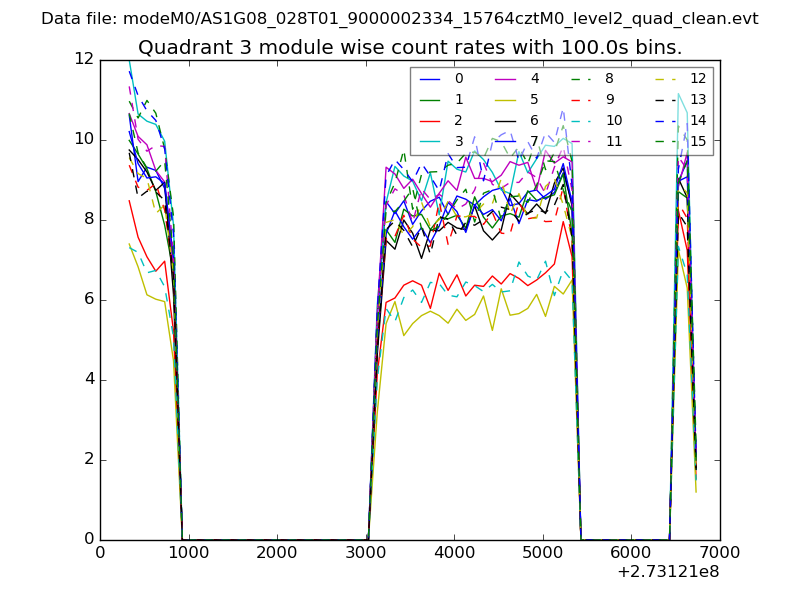
| Module-wise count rates for Quadrant C Data is divided into 100 sec bins |
 |
 |
| Module-wise count rates for Quadrant D Data is divided into 100 sec bins |
 |
 |
| Parameter | Plot |
|---|---|
| CZT HV Monitor | 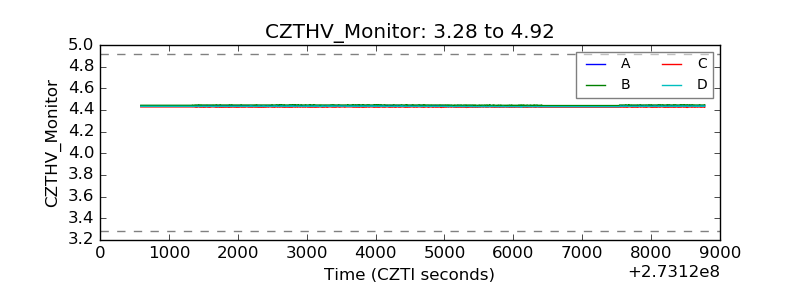 |
| D_VDD | 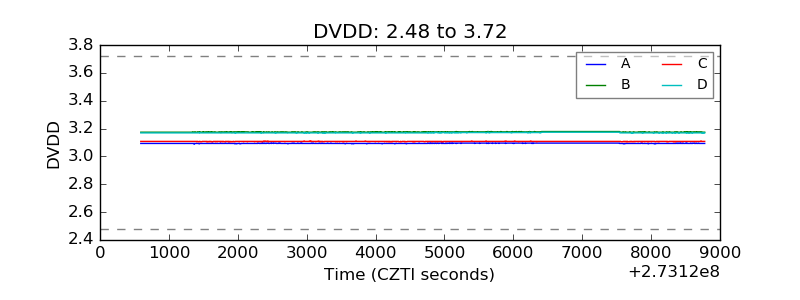 |
| Temperature 1 |  |
| Veto HV Monitor | 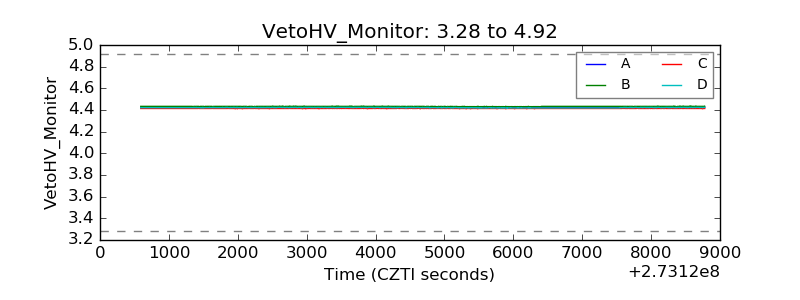 |
| Veto LLD | 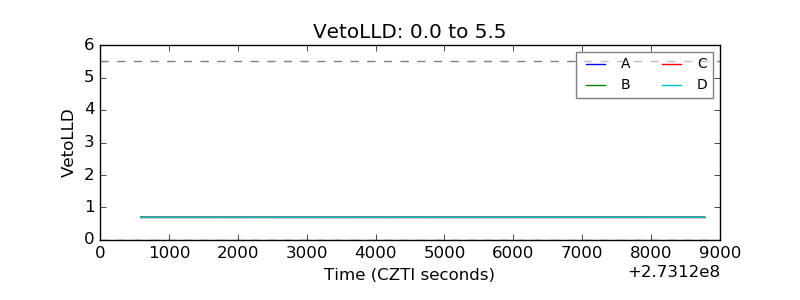 |
| Alpha Counter | 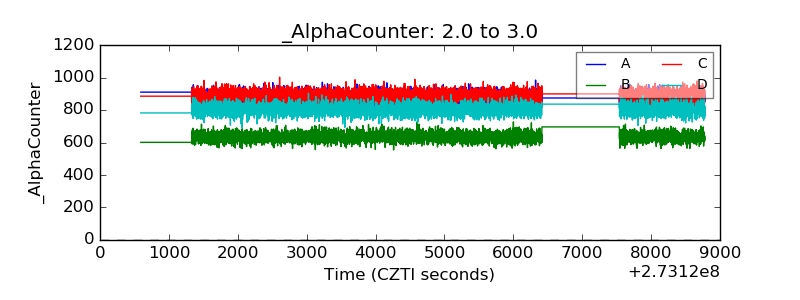 |
| _CPM_Rate | 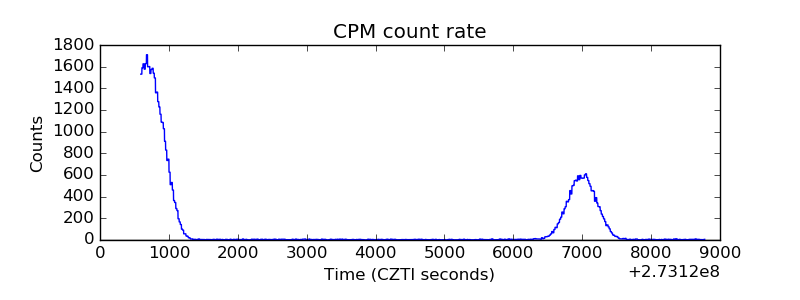 |
| CZT Counter | 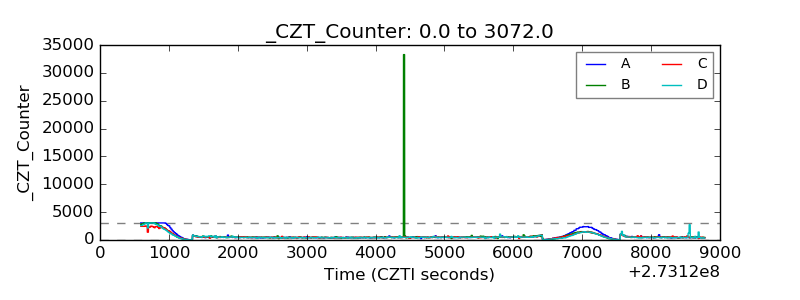 |
| +2.5 Volts monitor |  |
| +5 Volts monitor |  |
| _ROLL_ROT | 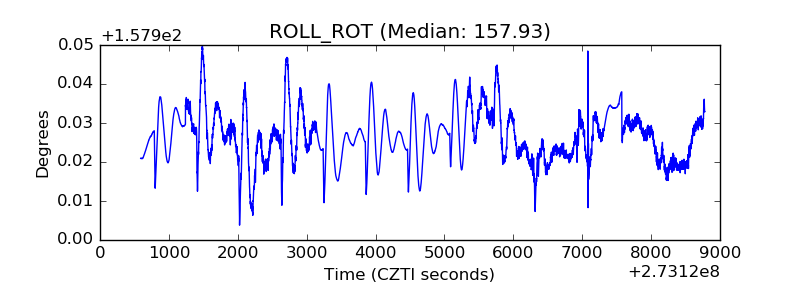 |
| _Roll_DEC | 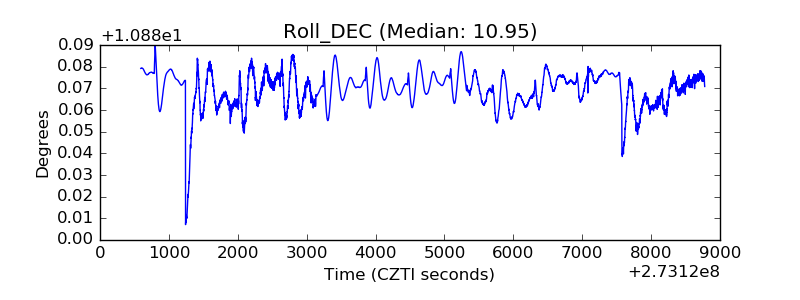 |
| _Roll_RA | 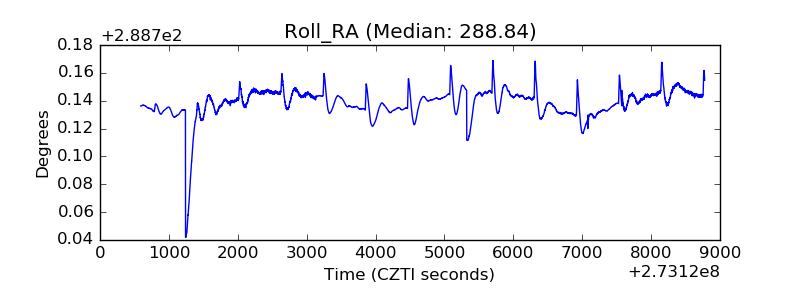 |
| Veto Counter | 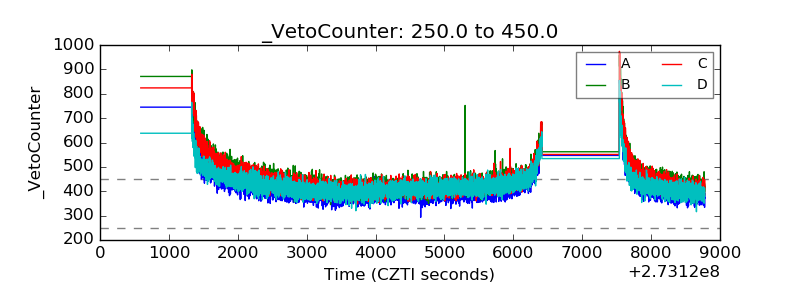 |