| Param | Original file | Final file |
|---|---|---|
| Filename | modeM0/AS1G08_028T01_9000002334_15765cztM0_level2.evt | modeM0/AS1G08_028T01_9000002334_15765cztM0_level2_quad_clean.evt |
| Size (bytes) | 457,436,160 | 69,883,200 |
| Size | 436.2 MB | 66.6 MB |
| Events in quadrant A | 3,243,789 | 415,301 |
| Events in quadrant B | 3,415,468 | 426,222 |
| Events in quadrant C | 3,358,885 | 402,877 |
| Events in quadrant D | 3,371,755 | 396,165 |
| Mode SS | |||
|---|---|---|---|
| Quadrant | BADHDUFLAG | Total packets | Discarded packets |
| A | 0 | 136 | 0 |
| B | 0 | 136 | 0 |
| C | 0 | 136 | 0 |
| D | 0 | 136 | 0 |
| Mode M0 | |||
|---|---|---|---|
| Quadrant | BADHDUFLAG | Total packets | Discarded packets |
| A | 0 | 14036 | 2 |
| B | 0 | 14346 | 1 |
| C | 0 | 14168 | 1 |
| D | 0 | 14653 | 1 |
| Mode M9 | |||
|---|---|---|---|
| Quadrant | BADHDUFLAG | Total packets | Discarded packets |
| A | 0 | 9 | 0 |
| B | 0 | 9 | 0 |
| C | 0 | 9 | 0 |
| D | 0 | 9 | 0 |
| Quadrant | Total seconds | Saturated seconds | Saturation percentage |
|---|---|---|---|
| A | 6829 | 51 | 0.746815% |
| B | 6829 | 66 | 0.966467% |
| C | 6829 | 71 | 1.039684% |
| D | 6829 | 41 | 0.600381% |
Noise dominated data is calculated using 1-second bins in cleaned event files. If a bin has >2000 counts, and if more than 50% of those come from <1% of pixels, then it is considered to be noise-dominated and hence unusable.
| Quadrant | # 1 sec bins | Bins with >0 counts | Bins with >2000 counts | High rate bins dominated by noise | Noise dominated (total time) | Noise dominated (detector-on time) | Marked lightcurve |
|---|---|---|---|---|---|---|---|
| A | 7685 | 6831 | 0 | 0 | 0.00% | 0.00% | 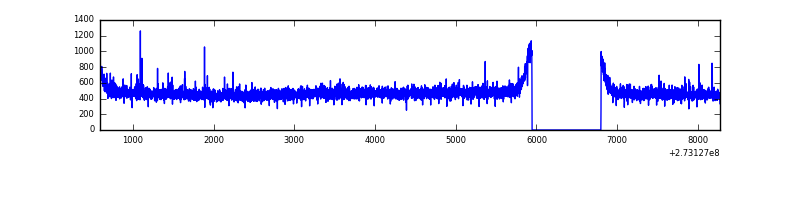 |
| B | 7685 | 6831 | 0 | 0 | 0.00% | 0.00% | 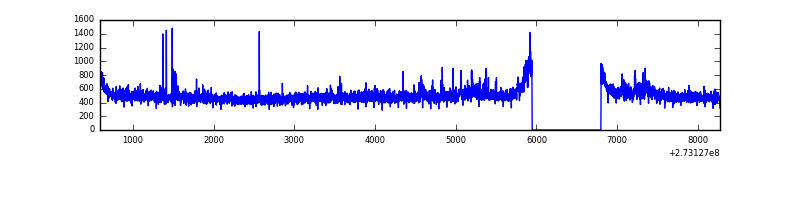 |
| C | 7685 | 6831 | 1 | 1 | 0.01% | 0.01% | 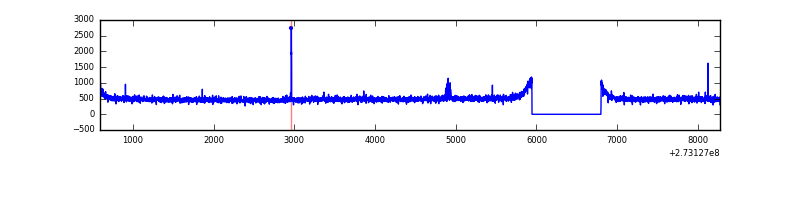 |
| D | 7685 | 6831 | 22 | 22 | 0.29% | 0.32% | 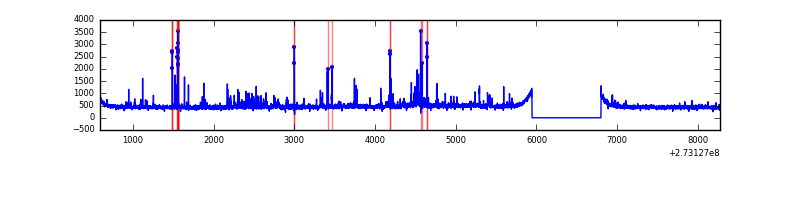 |
Top three noisy pixels from each quadrant. If the there are fewer than three noisy pixels in the level2.evt file, extra rows are filled as -1
| Pixel properties | Quadrant properties | ||||||
|---|---|---|---|---|---|---|---|
| Quadrant | DetID | PixID | Counts | Sigma | Mean | Median | Sigma |
| A | 9 | 143 | 13073 | 71.5 | 839 | 821 | 171.3 |
| A | 0 | 226 | 7408 | 38.44 | 839 | 821 | 171.3 |
| A | 12 | 194 | 5946 | 29.91 | 839 | 821 | 171.3 |
| B | 3 | 64 | 60591 | 368.88 | 843 | 823 | 162.0 |
| B | 3 | 209 | 34311 | 206.68 | 843 | 823 | 162.0 |
| B | 12 | 111 | 19199 | 113.41 | 843 | 823 | 162.0 |
| C | 14 | 238 | 121826 | 641.07 | 803 | 810 | 188.8 |
| C | 3 | 233 | 46141 | 240.14 | 803 | 810 | 188.8 |
| C | 7 | 247 | 26493 | 136.05 | 803 | 810 | 188.8 |
| D | 1 | 52 | 258427 | 1200.38 | 803 | 784 | 214.6 |
| D | 13 | 172 | 25018 | 112.91 | 803 | 784 | 214.6 |
| D | 10 | 70 | 24807 | 111.93 | 803 | 784 | 214.6 |
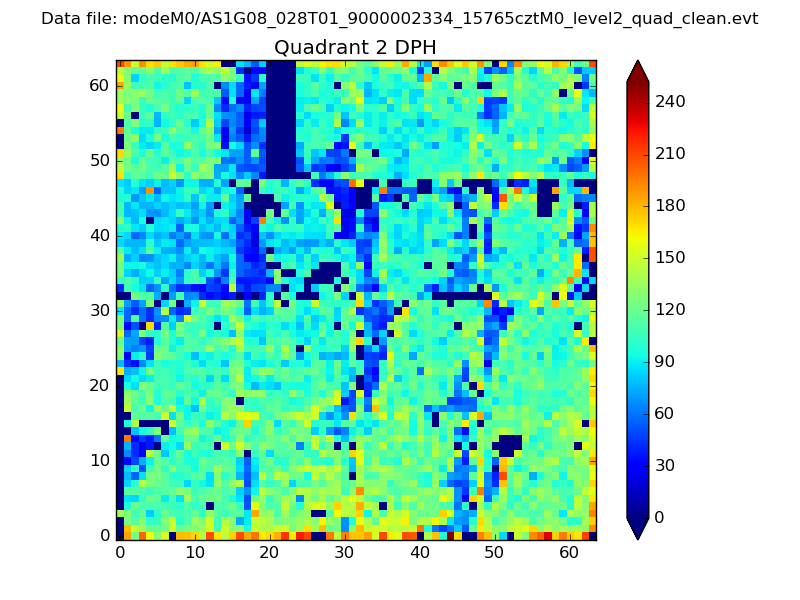
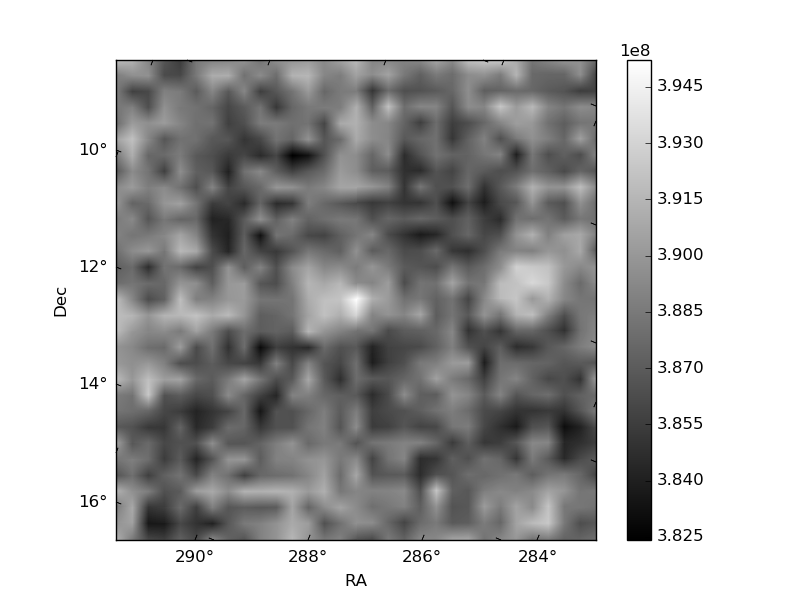
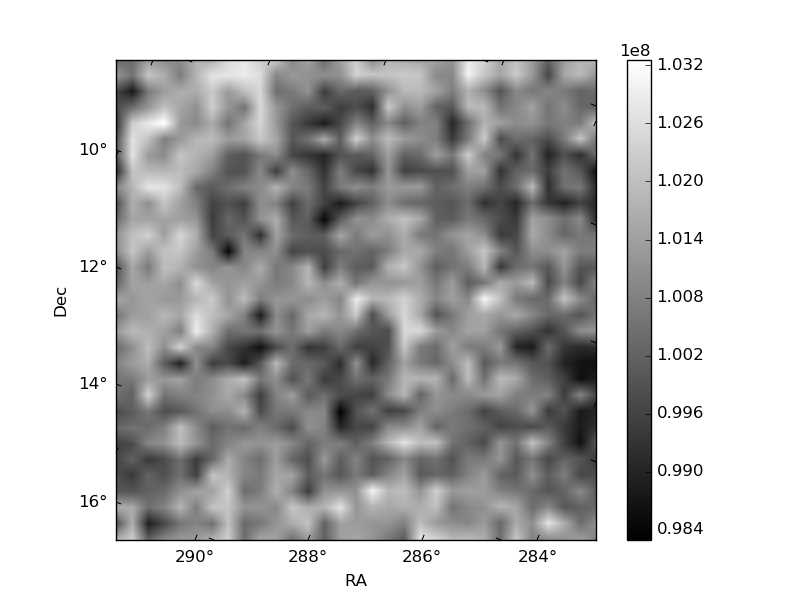
Histogram calculated using DETX and DETY for each event in the final _common_clean file
| Quadrant A | 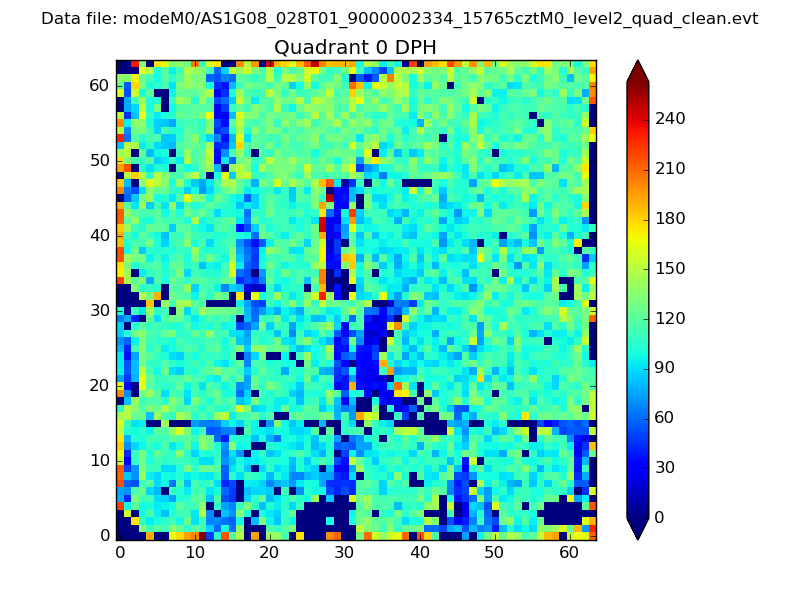 |
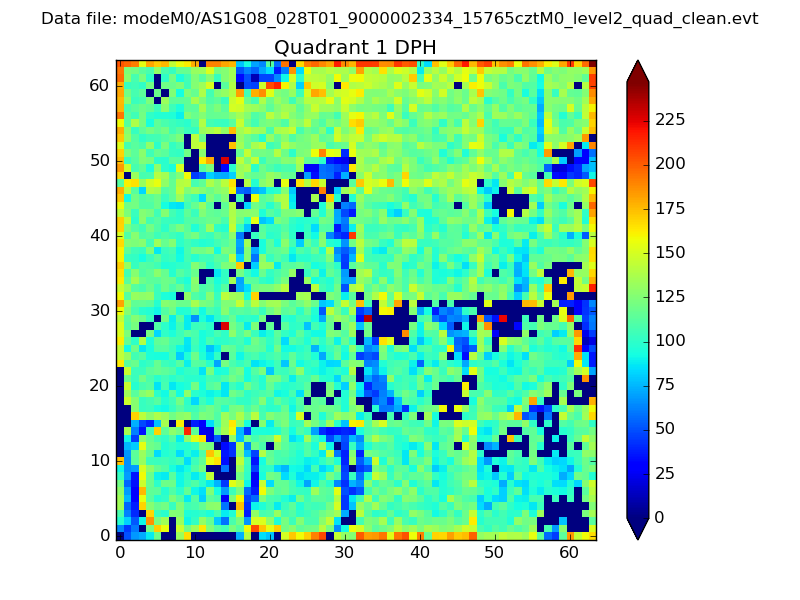 |
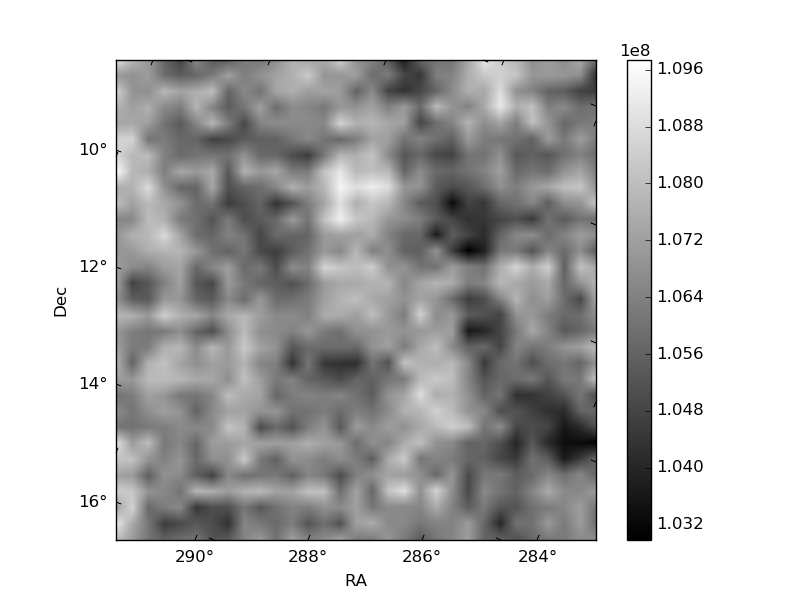
Quadrant B |
|---|---|---|---|
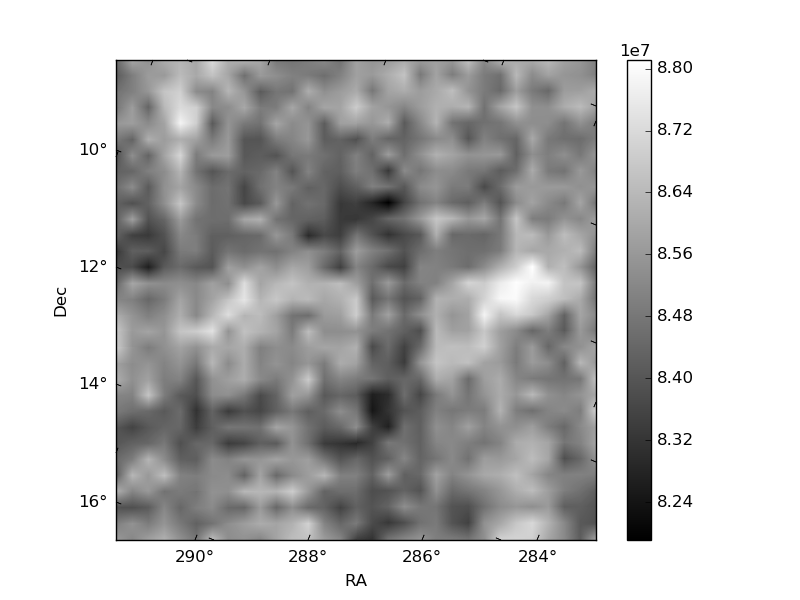
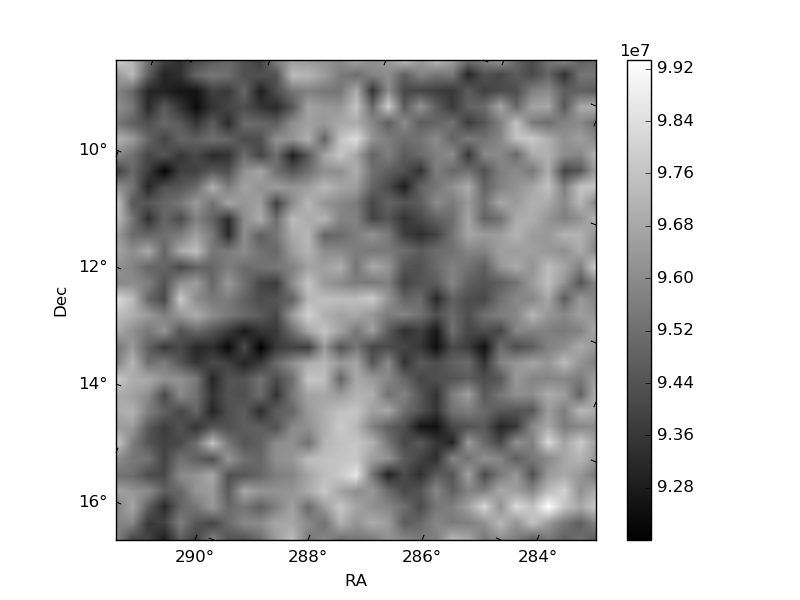
| Quadrant D | 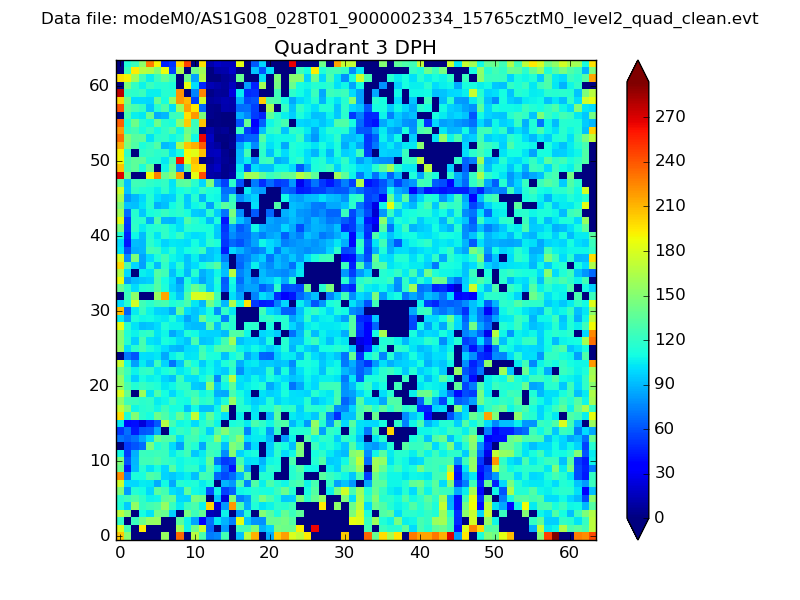 |
 |
Quadrant C |
| Plot type | Count rate plots | Images |
|---|---|---|
| Comparison with Poisson distribution Blue bars denote a histogram of data divided into 1 sec bins. Red curve is a Poisson curve with rate = median count rate of data. |
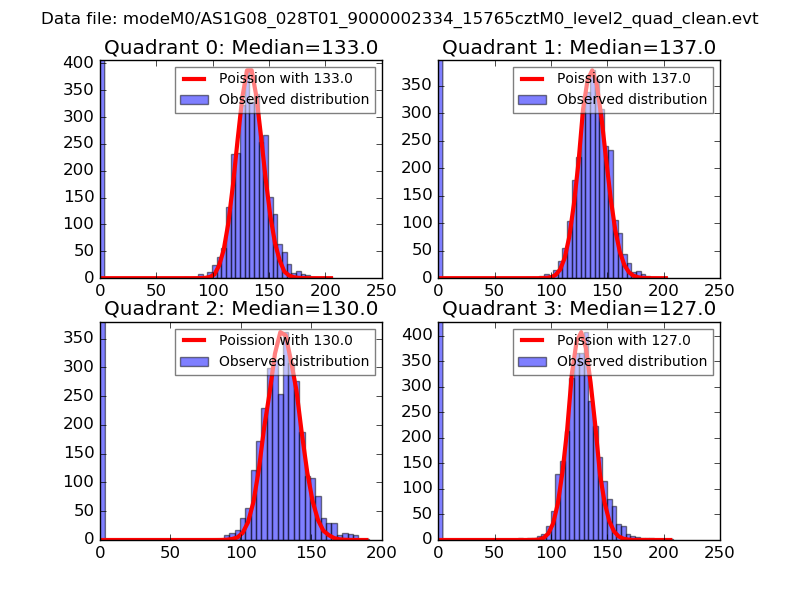 |
 |
| Quadrant-wise count rates Data is divided into 100 sec bins |
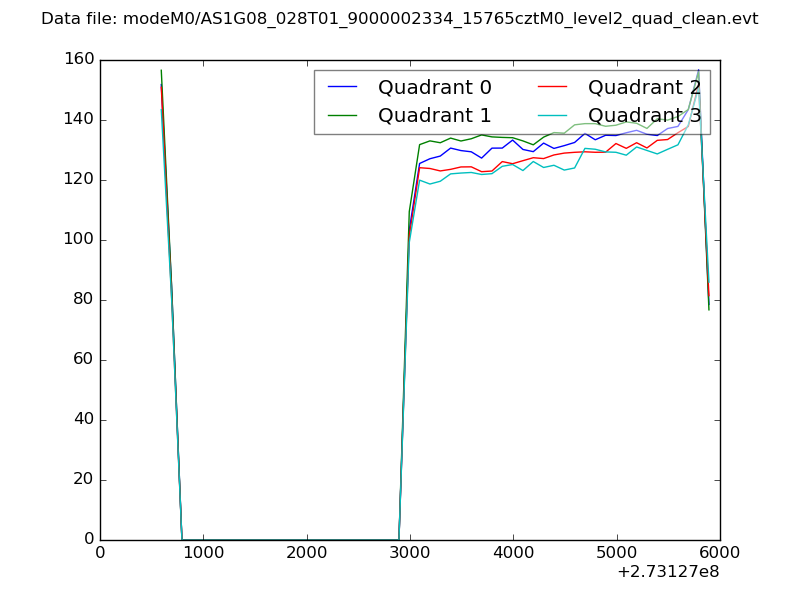 |
|
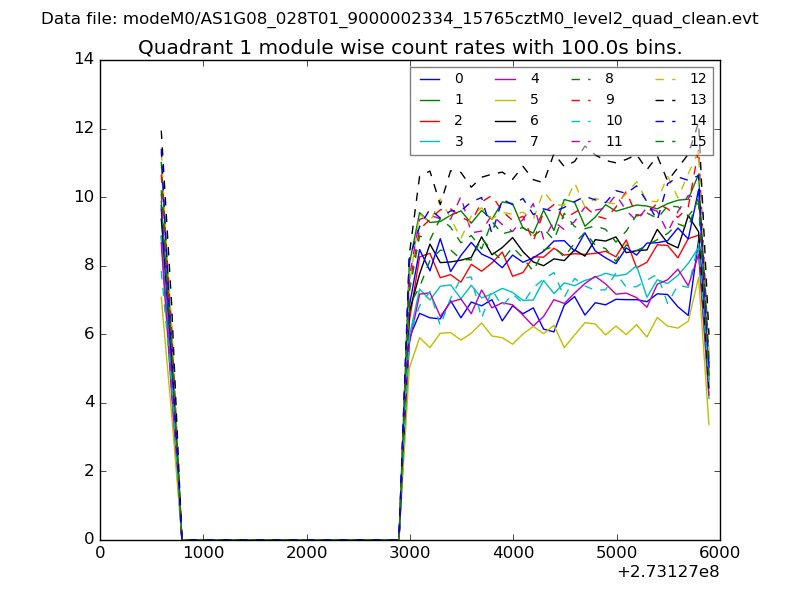
| Module-wise count rates for Quadrant A Data is divided into 100 sec bins |
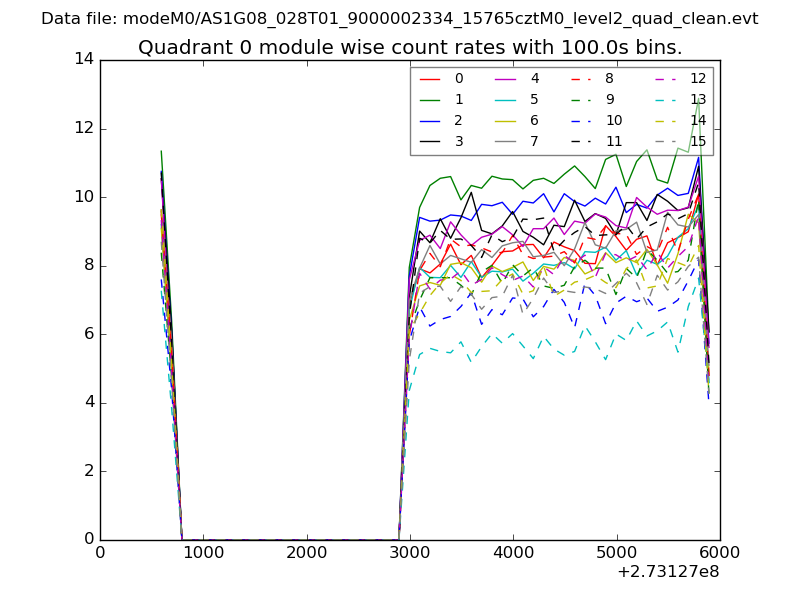 |
 |
| Module-wise count rates for Quadrant B Data is divided into 100 sec bins |
 |
 |
| Module-wise count rates for Quadrant C Data is divided into 100 sec bins |
 |
 |
| Module-wise count rates for Quadrant D Data is divided into 100 sec bins |
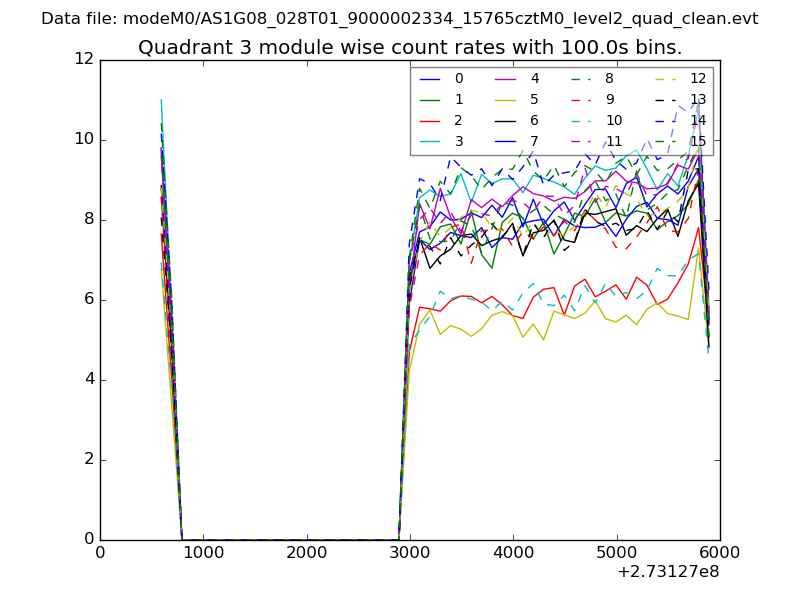 |
 |
| Parameter | Plot |
|---|---|
| CZT HV Monitor | 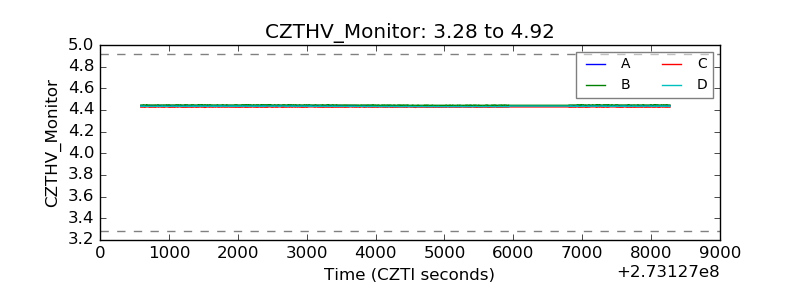 |
| D_VDD | 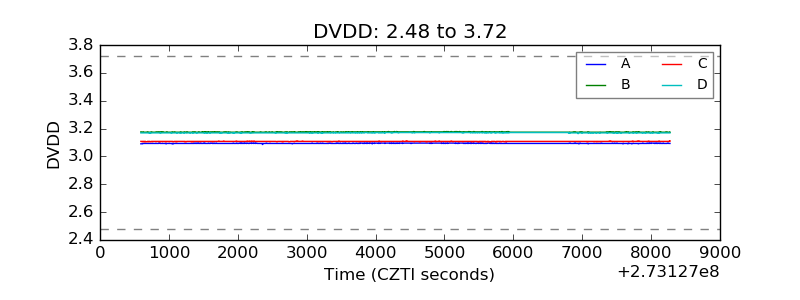 |
| Temperature 1 | 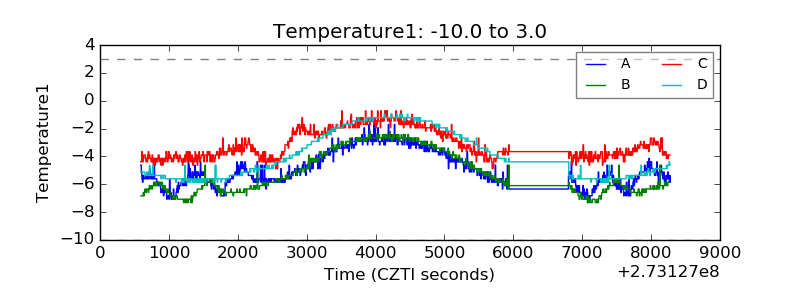 |
| Veto HV Monitor | 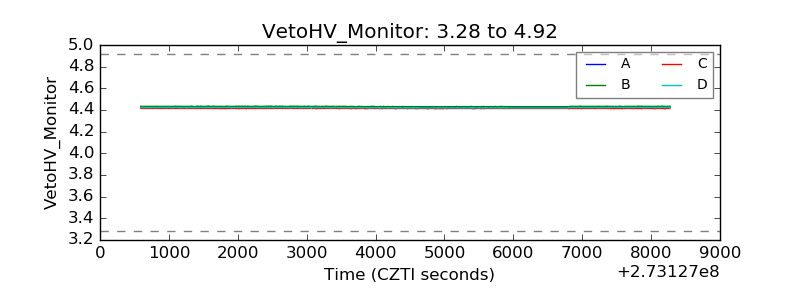 |
| Veto LLD | 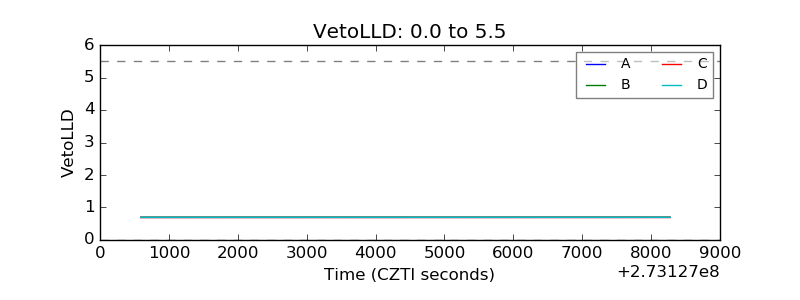 |
| Alpha Counter | 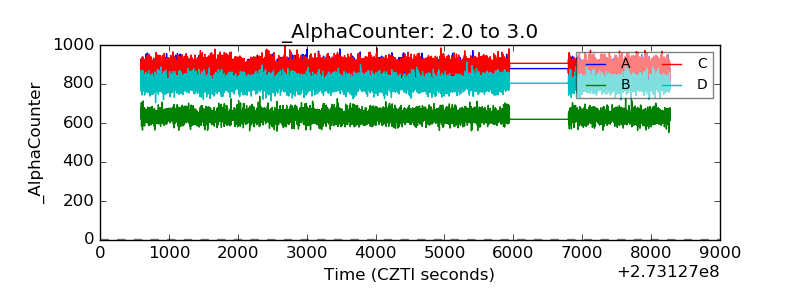 |
| _CPM_Rate | 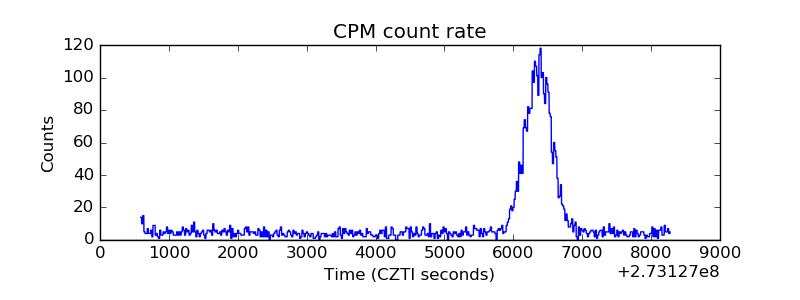 |
| CZT Counter | 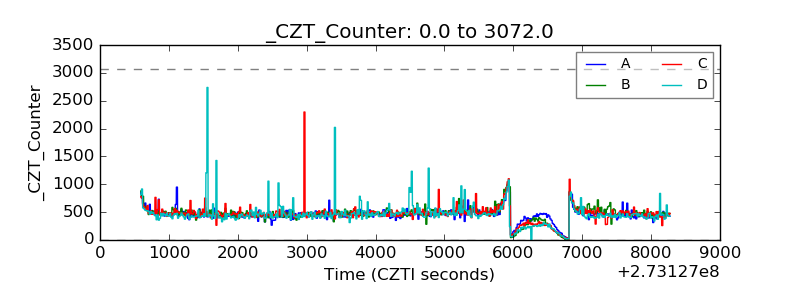 |
| +2.5 Volts monitor | 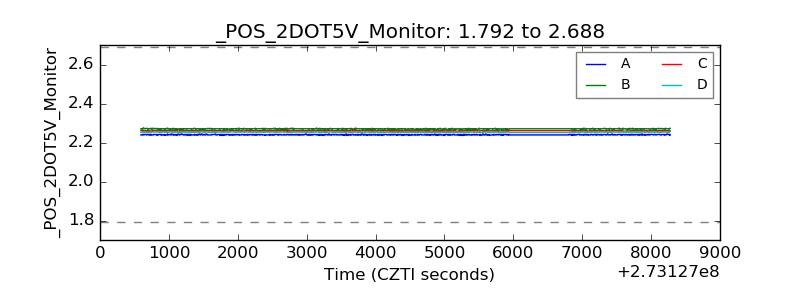 |
| +5 Volts monitor |  |
| _ROLL_ROT | 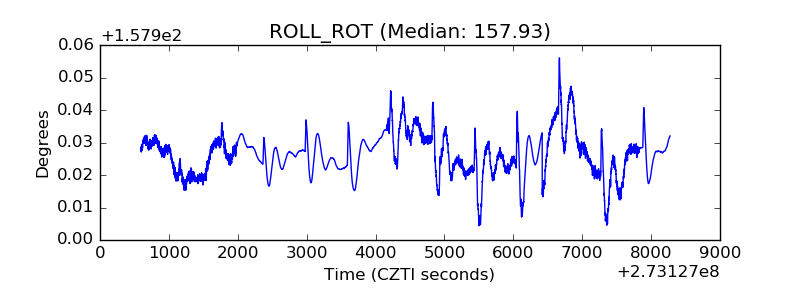 |
| _Roll_DEC | 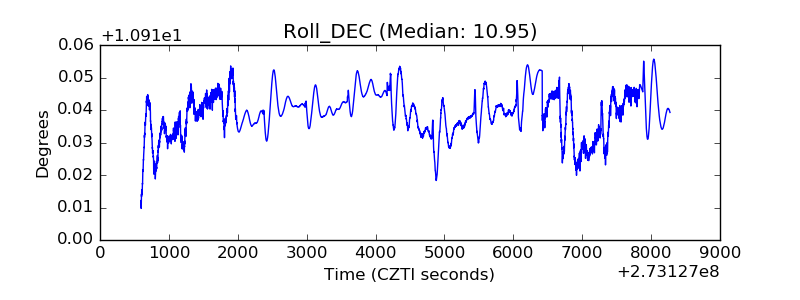 |
| _Roll_RA | 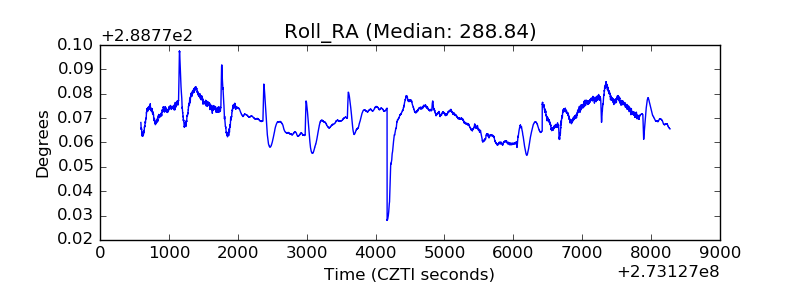 |
| Veto Counter | 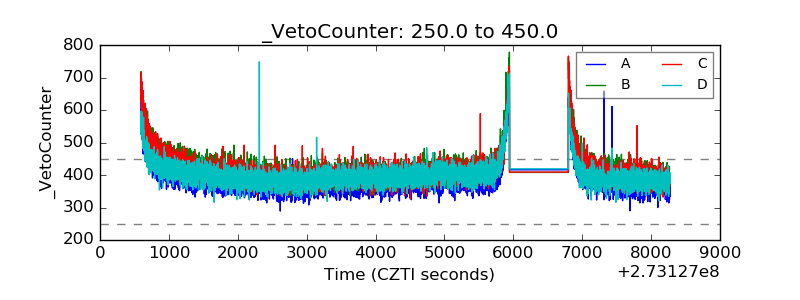 |