| Param | Original file | Final file |
|---|---|---|
| Filename | modeM0/AS1G08_028T01_9000002334_15766cztM0_level2.evt | modeM0/AS1G08_028T01_9000002334_15766cztM0_level2_quad_clean.evt |
| Size (bytes) | 519,108,480 | 84,942,720 |
| Size | 495.1 MB | 81.0 MB |
| Events in quadrant A | 3,727,352 | 514,637 |
| Events in quadrant B | 3,940,884 | 525,173 |
| Events in quadrant C | 3,865,712 | 500,120 |
| Events in quadrant D | 3,662,393 | 495,001 |
| Mode SS | |||
|---|---|---|---|
| Quadrant | BADHDUFLAG | Total packets | Discarded packets |
| A | 0 | 156 | 0 |
| B | 0 | 156 | 0 |
| C | 0 | 156 | 0 |
| D | 0 | 156 | 0 |
| Mode M0 | |||
|---|---|---|---|
| Quadrant | BADHDUFLAG | Total packets | Discarded packets |
| A | 0 | 16152 | 3 |
| B | 0 | 16416 | 2 |
| C | 0 | 16242 | 2 |
| D | 0 | 16301 | 2 |
| Mode M9 | |||
|---|---|---|---|
| Quadrant | BADHDUFLAG | Total packets | Discarded packets |
| A | 0 | 13 | 0 |
| B | 0 | 13 | 0 |
| C | 0 | 13 | 0 |
| D | 0 | 13 | 0 |
| Quadrant | Total seconds | Saturated seconds | Saturation percentage |
|---|---|---|---|
| A | 7734 | 187 | 2.417895% |
| B | 7734 | 225 | 2.909232% |
| C | 7734 | 180 | 2.327386% |
| D | 7734 | 112 | 1.448151% |
Noise dominated data is calculated using 1-second bins in cleaned event files. If a bin has >2000 counts, and if more than 50% of those come from <1% of pixels, then it is considered to be noise-dominated and hence unusable.
| Quadrant | # 1 sec bins | Bins with >0 counts | Bins with >2000 counts | High rate bins dominated by noise | Noise dominated (total time) | Noise dominated (detector-on time) | Marked lightcurve |
|---|---|---|---|---|---|---|---|
| A | 8980 | 7737 | 0 | 0 | 0.00% | 0.00% | 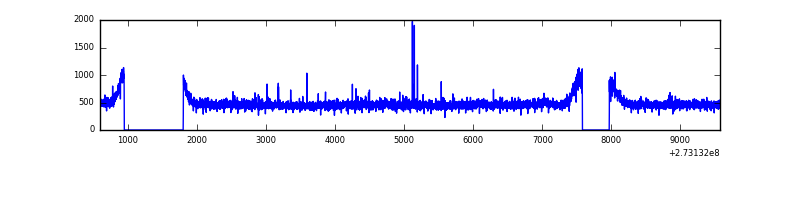 |
| B | 8980 | 7737 | 0 | 0 | 0.00% | 0.00% | 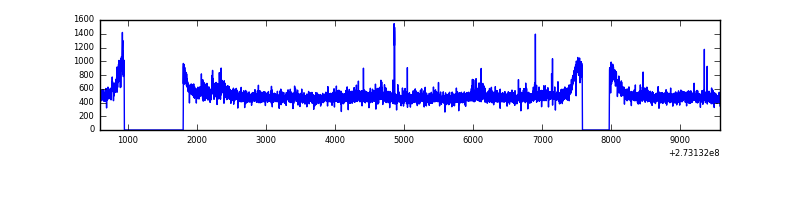 |
| C | 8980 | 7737 | 0 | 0 | 0.00% | 0.00% | 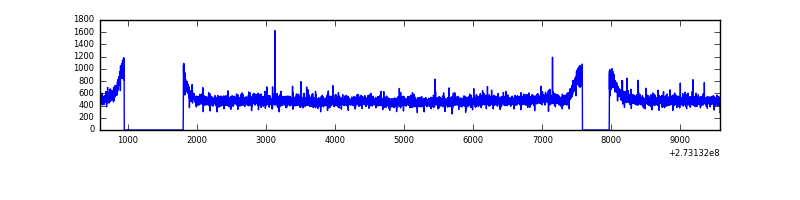 |
| D | 8980 | 7737 | 8 | 8 | 0.09% | 0.10% | 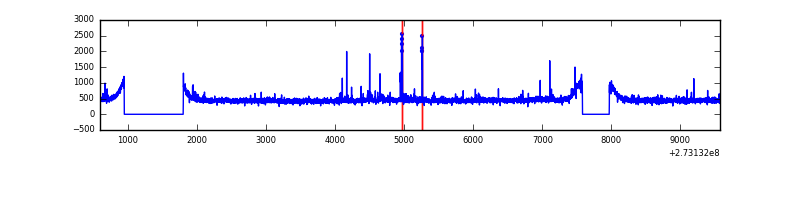 |
Top three noisy pixels from each quadrant. If the there are fewer than three noisy pixels in the level2.evt file, extra rows are filled as -1
| Pixel properties | Quadrant properties | ||||||
|---|---|---|---|---|---|---|---|
| Quadrant | DetID | PixID | Counts | Sigma | Mean | Median | Sigma |
| A | 9 | 143 | 15932 | 75.87 | 964 | 941 | 197.6 |
| A | 0 | 226 | 8466 | 38.08 | 964 | 941 | 197.6 |
| A | 12 | 194 | 6955 | 30.44 | 964 | 941 | 197.6 |
| B | 3 | 64 | 100771 | 534.24 | 967 | 941 | 186.9 |
| B | 12 | 111 | 22905 | 117.54 | 967 | 941 | 186.9 |
| B | 11 | 111 | 19658 | 100.16 | 967 | 941 | 186.9 |
| C | 14 | 238 | 139780 | 632.37 | 925 | 929 | 219.6 |
| C | 3 | 233 | 69495 | 312.27 | 925 | 929 | 219.6 |
| C | 7 | 247 | 45013 | 200.77 | 925 | 929 | 219.6 |
| D | 1 | 52 | 92293 | 373.36 | 931 | 906 | 244.8 |
| D | 5 | 51 | 28706 | 113.58 | 931 | 906 | 244.8 |
| D | 2 | 234 | 27267 | 107.7 | 931 | 906 | 244.8 |
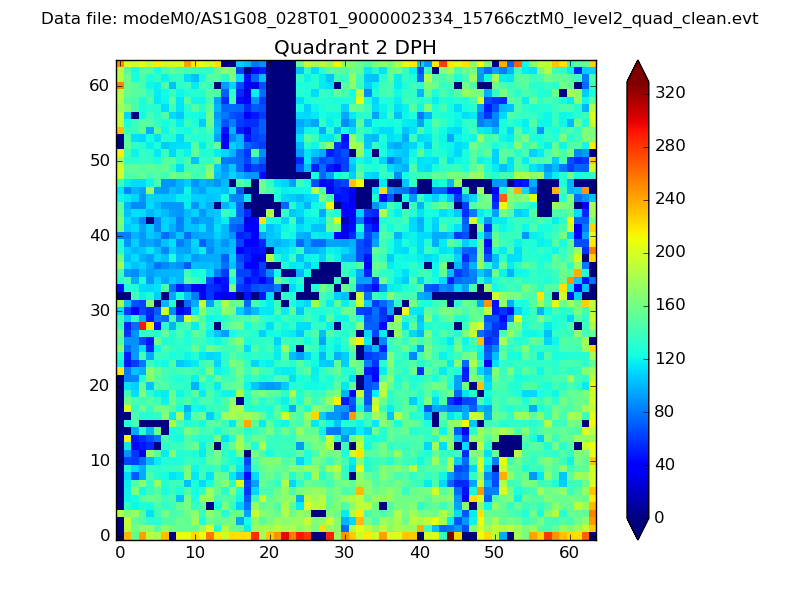
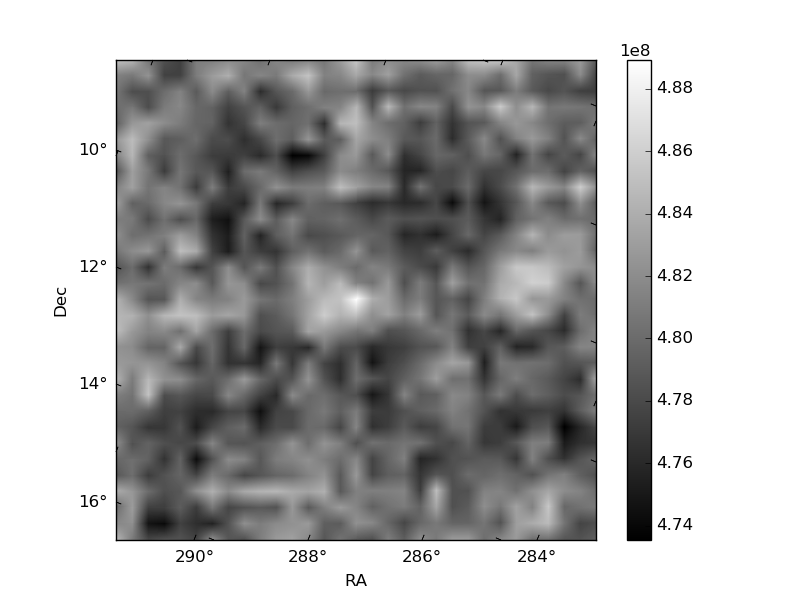
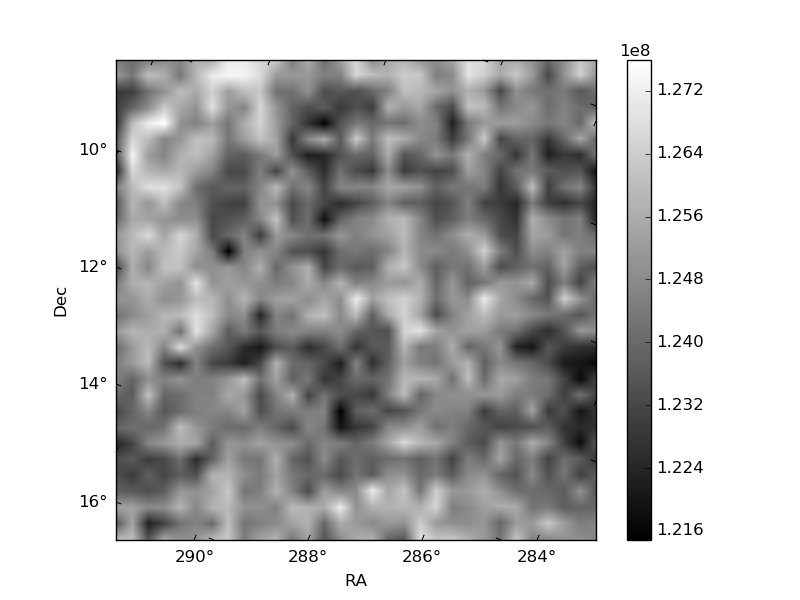
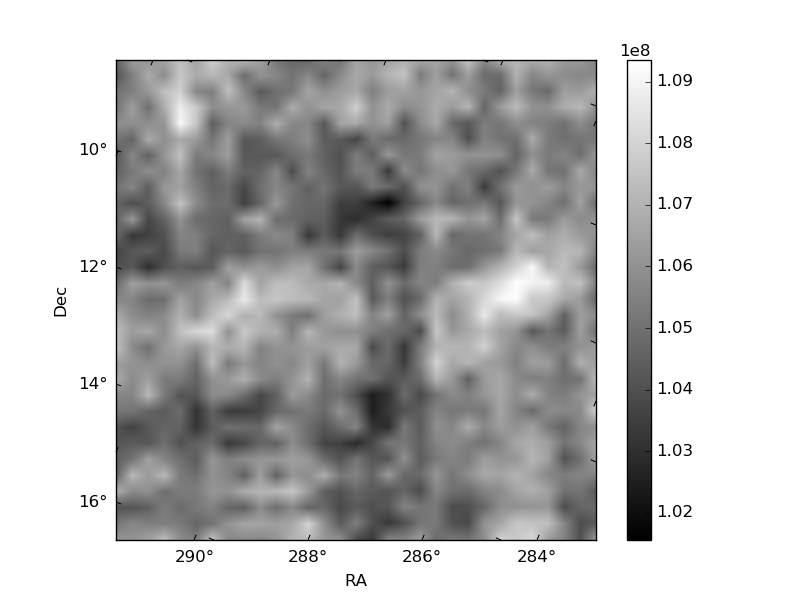
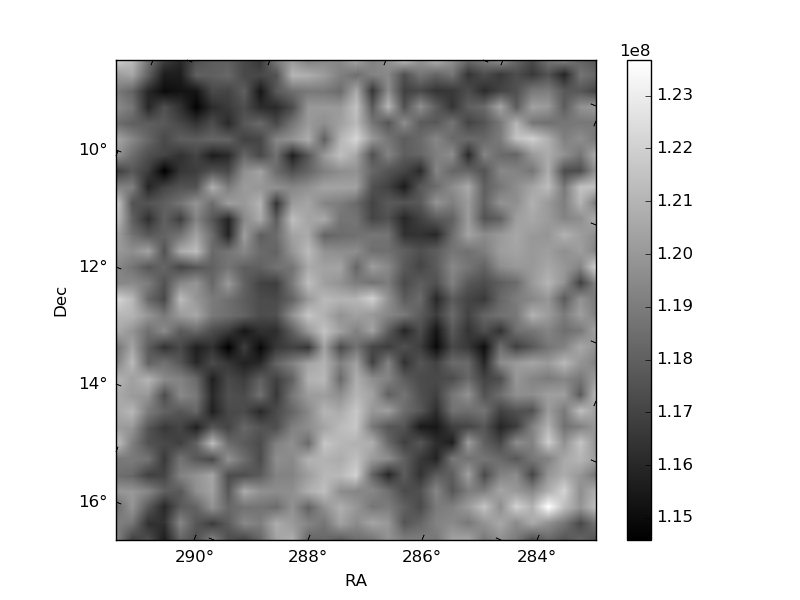
Histogram calculated using DETX and DETY for each event in the final _common_clean file
| Quadrant A | 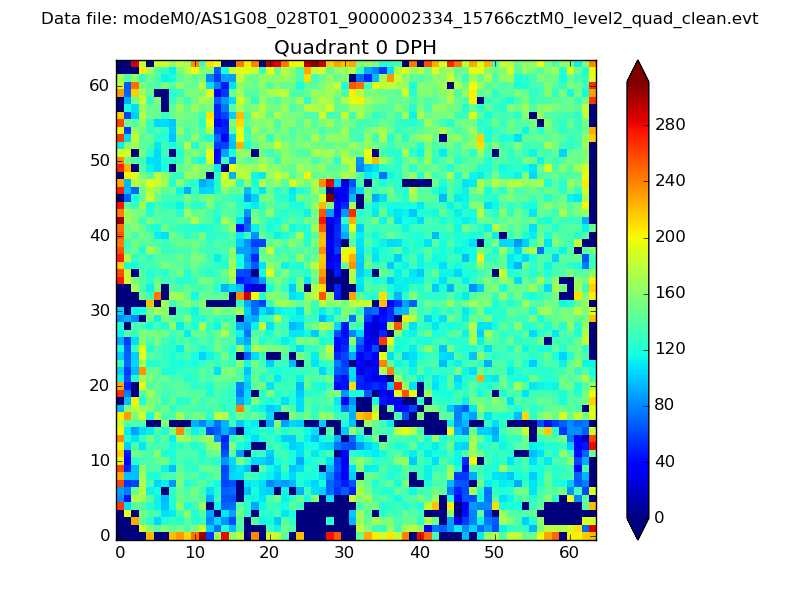 |
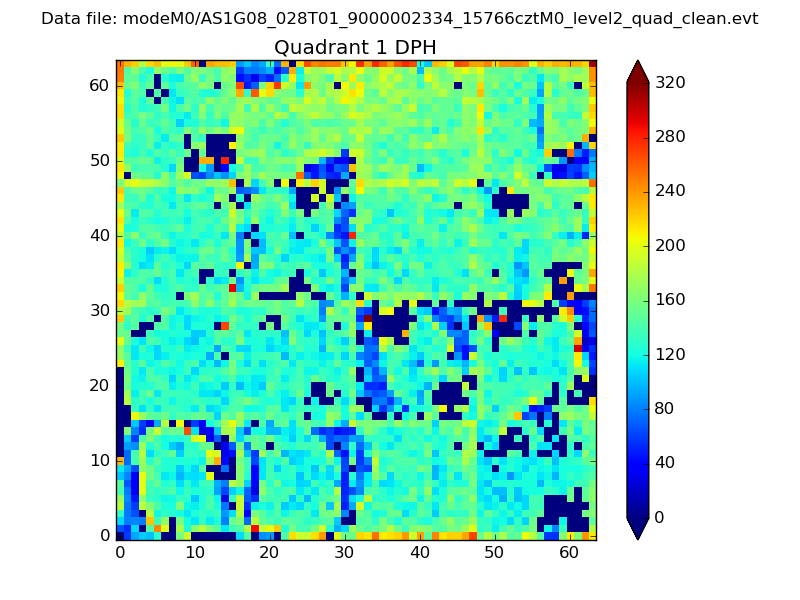 |
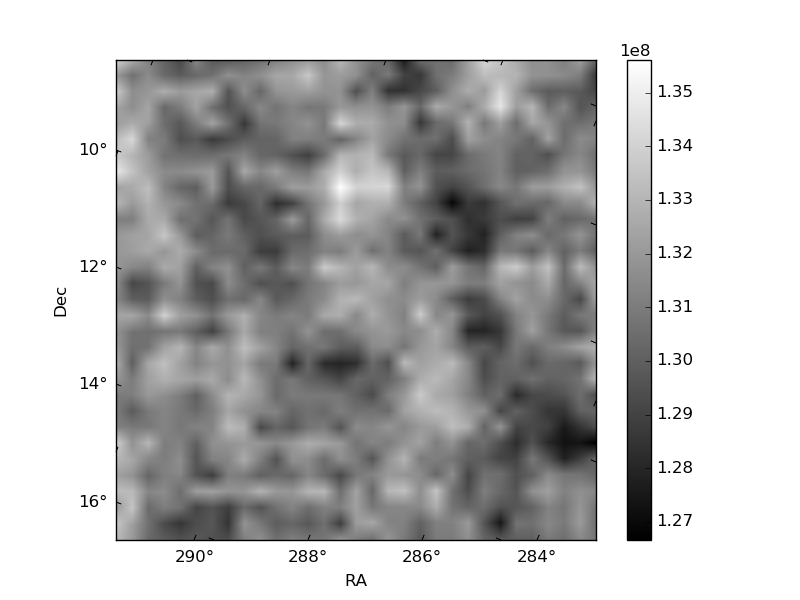
Quadrant B |
|---|---|---|---|
| Quadrant D | 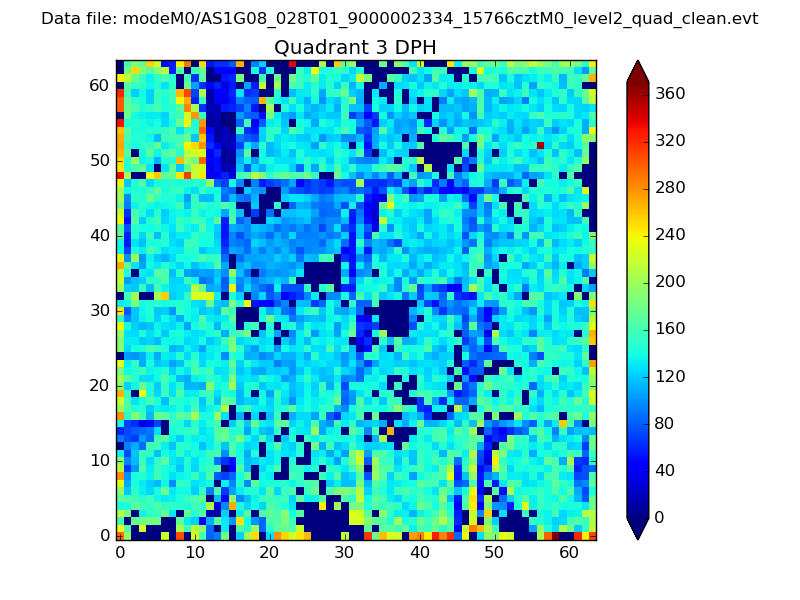 |
 |
Quadrant C |
| Plot type | Count rate plots | Images |
|---|---|---|
| Comparison with Poisson distribution Blue bars denote a histogram of data divided into 1 sec bins. Red curve is a Poisson curve with rate = median count rate of data. |
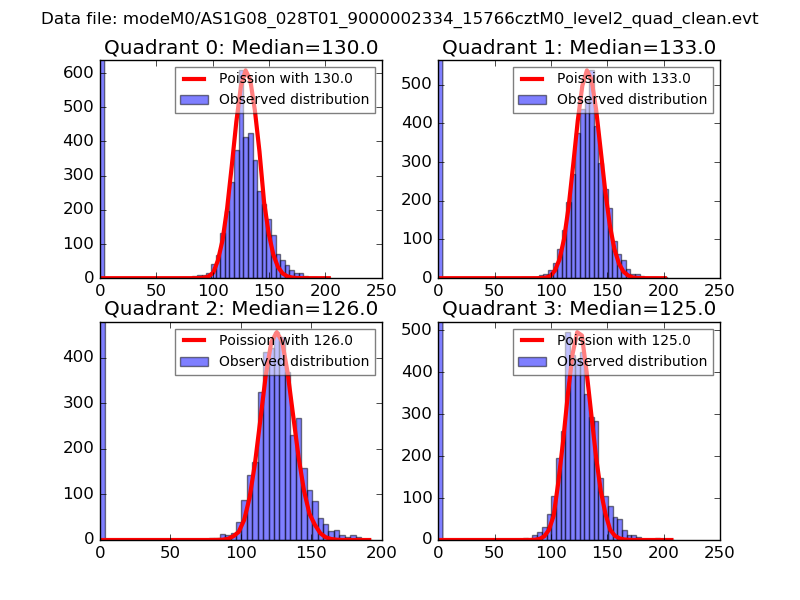 |
 |
| Quadrant-wise count rates Data is divided into 100 sec bins |
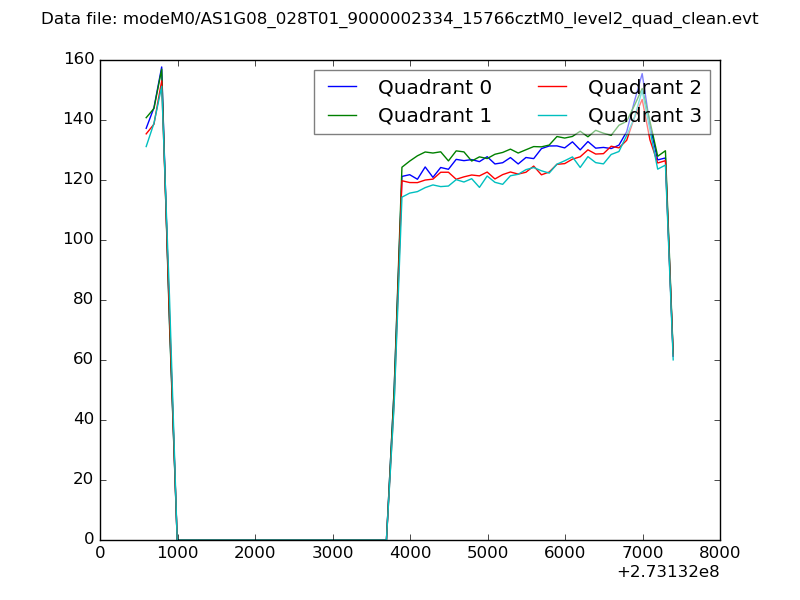 |
|
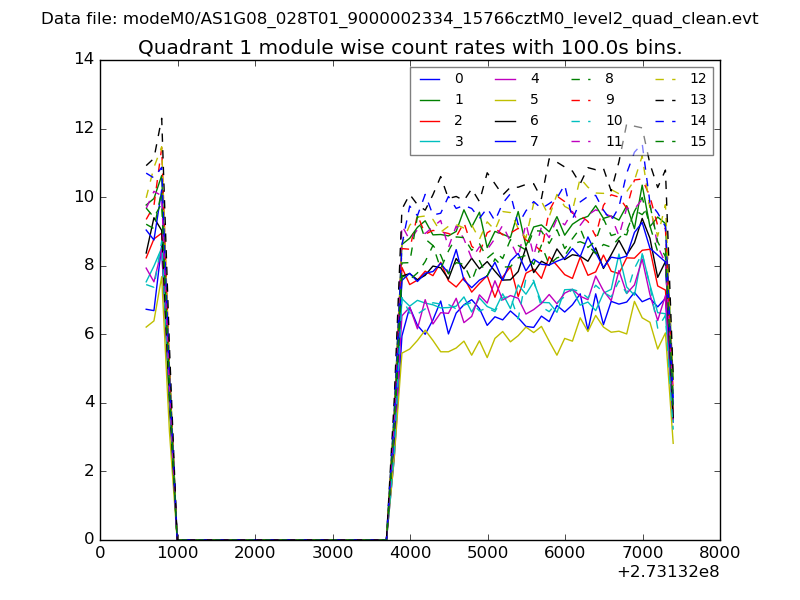
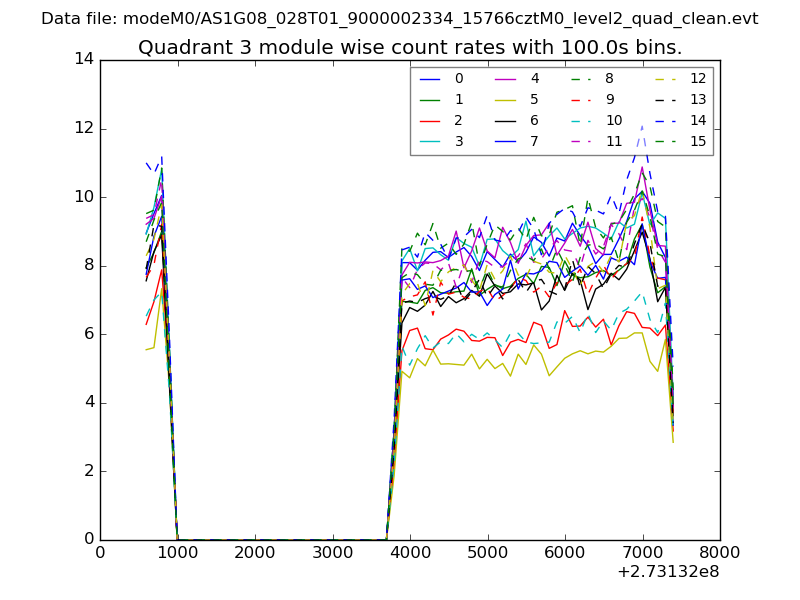
| Module-wise count rates for Quadrant A Data is divided into 100 sec bins |
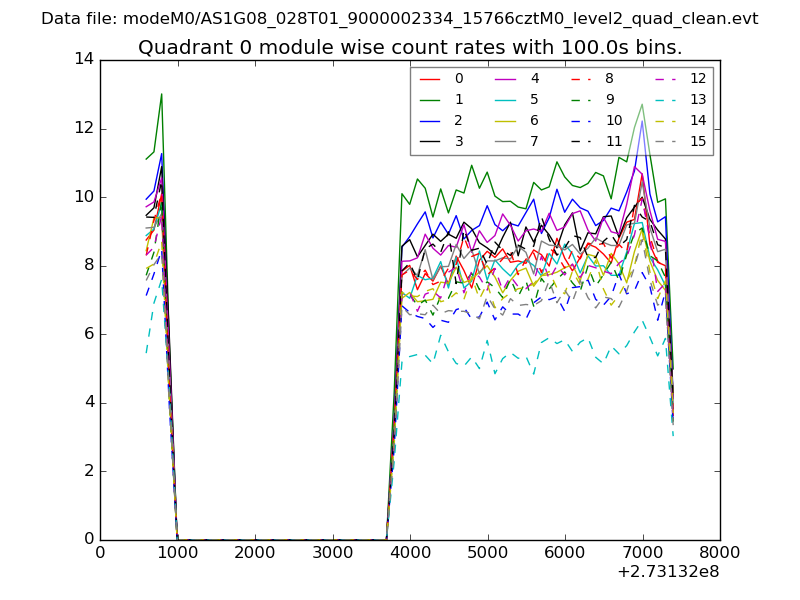 |
 |
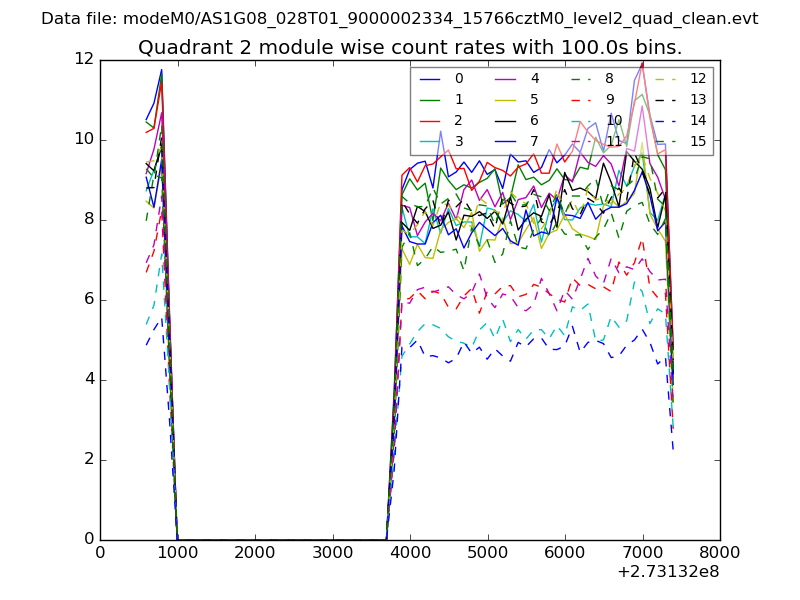
| Module-wise count rates for Quadrant B Data is divided into 100 sec bins |
 |
 |
| Module-wise count rates for Quadrant C Data is divided into 100 sec bins |
 |
 |
| Module-wise count rates for Quadrant D Data is divided into 100 sec bins |
 |
 |
| Parameter | Plot |
|---|---|
| CZT HV Monitor | 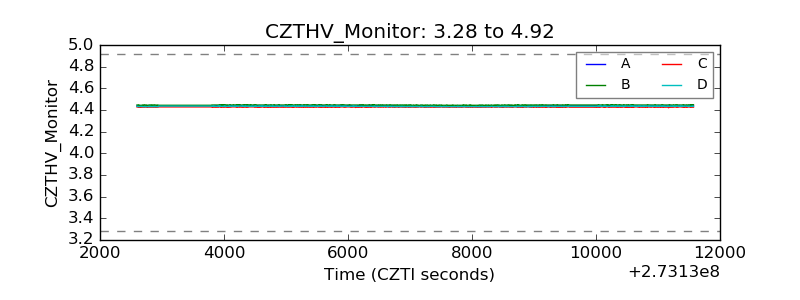 |
| D_VDD | 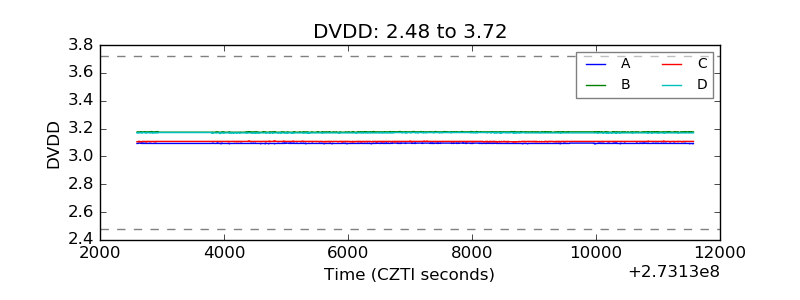 |
| Temperature 1 | 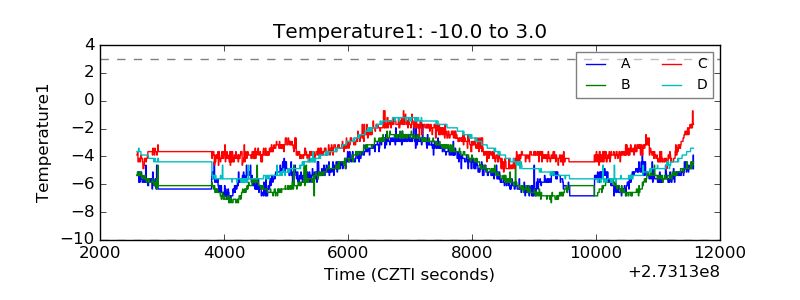 |
| Veto HV Monitor |  |
| Veto LLD | 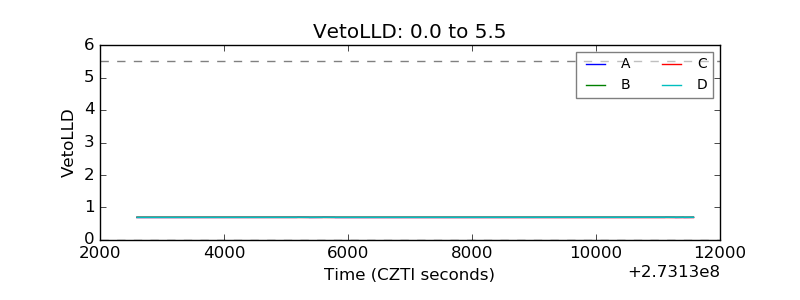 |
| Alpha Counter | 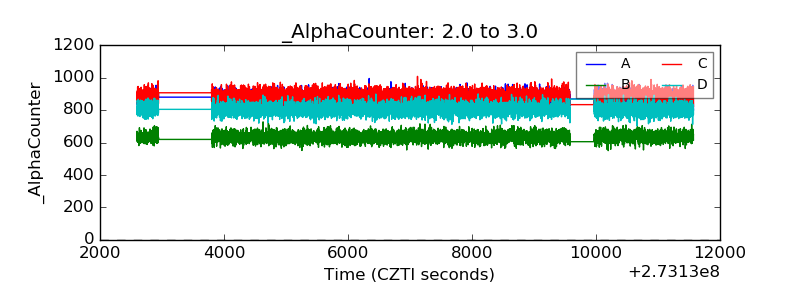 |
| _CPM_Rate |  |
| CZT Counter | 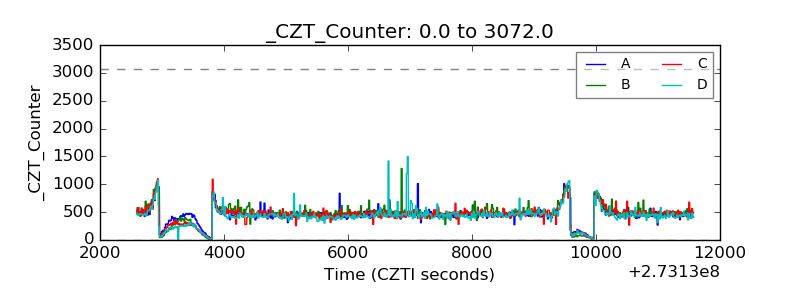 |
| +2.5 Volts monitor | 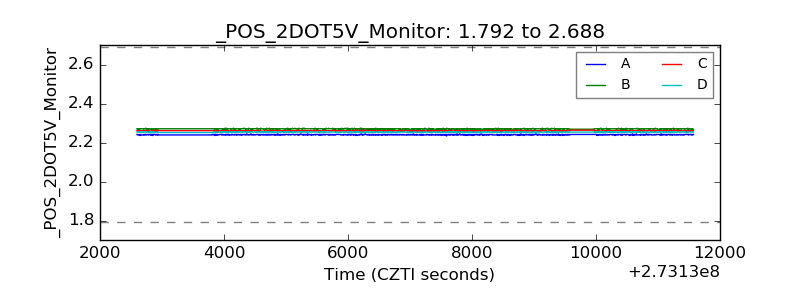 |
| +5 Volts monitor | 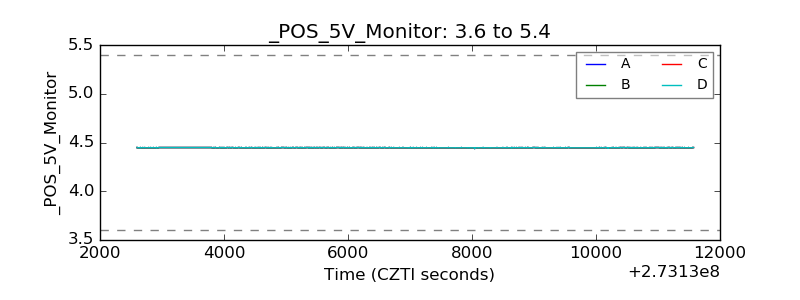 |
| _ROLL_ROT | 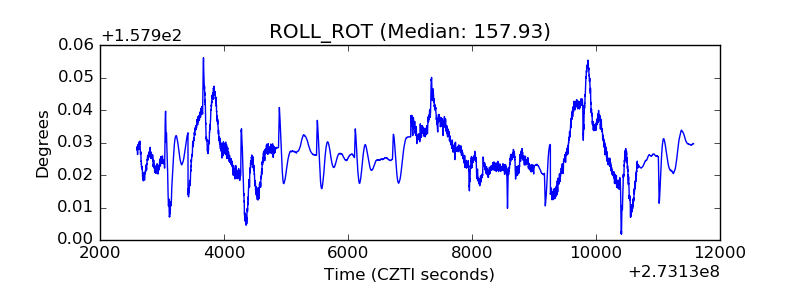 |
| _Roll_DEC | 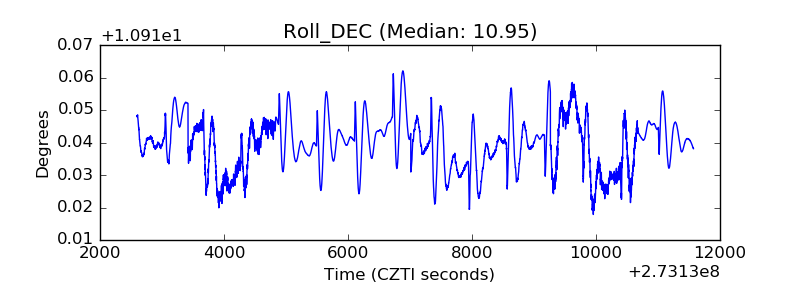 |
| _Roll_RA | 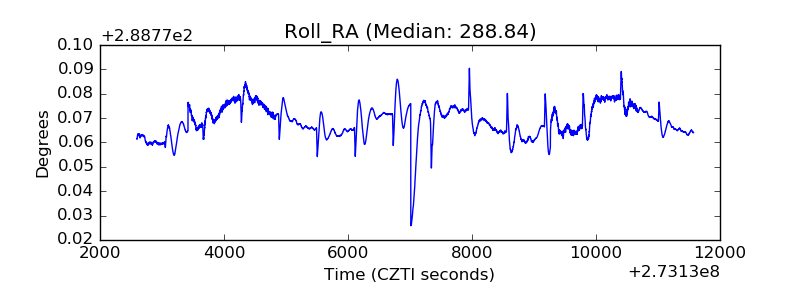 |
| Veto Counter | 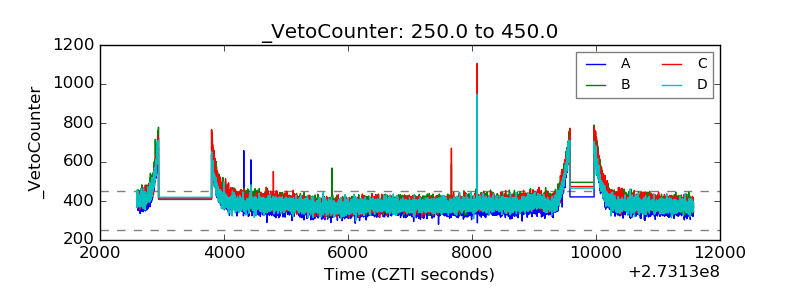 |