| Param | Original file | Final file |
|---|---|---|
| Filename | modeM0/AS1G08_028T01_9000002334_15767cztM0_level2.evt | modeM0/AS1G08_028T01_9000002334_15767cztM0_level2_quad_clean.evt |
| Size (bytes) | 532,791,360 | 81,688,320 |
| Size | 508.1 MB | 77.9 MB |
| Events in quadrant A | 3,712,518 | 486,400 |
| Events in quadrant B | 3,874,103 | 502,928 |
| Events in quadrant C | 3,831,161 | 476,766 |
| Events in quadrant D | 4,187,283 | 464,811 |
| Mode SS | |||
|---|---|---|---|
| Quadrant | BADHDUFLAG | Total packets | Discarded packets |
| A | 0 | 160 | 0 |
| B | 0 | 160 | 0 |
| C | 0 | 160 | 0 |
| D | 0 | 160 | 0 |
| Mode M0 | |||
|---|---|---|---|
| Quadrant | BADHDUFLAG | Total packets | Discarded packets |
| A | 0 | 16240 | 4 |
| B | 0 | 16429 | 3 |
| C | 0 | 16336 | 3 |
| D | 0 | 17799 | 3 |
| Mode M9 | |||
|---|---|---|---|
| Quadrant | BADHDUFLAG | Total packets | Discarded packets |
| A | 0 | 5 | 0 |
| B | 0 | 5 | 0 |
| C | 0 | 5 | 0 |
| D | 0 | 5 | 0 |
| Quadrant | Total seconds | Saturated seconds | Saturation percentage |
|---|---|---|---|
| A | 7805 | 332 | 4.253684% |
| B | 7805 | 361 | 4.625240% |
| C | 7805 | 343 | 4.394619% |
| D | 7805 | 309 | 3.959001% |
Noise dominated data is calculated using 1-second bins in cleaned event files. If a bin has >2000 counts, and if more than 50% of those come from <1% of pixels, then it is considered to be noise-dominated and hence unusable.
| Quadrant | # 1 sec bins | Bins with >0 counts | Bins with >2000 counts | High rate bins dominated by noise | Noise dominated (total time) | Noise dominated (detector-on time) | Marked lightcurve |
|---|---|---|---|---|---|---|---|
| A | 8331 | 7809 | 0 | 0 | 0.00% | 0.00% | 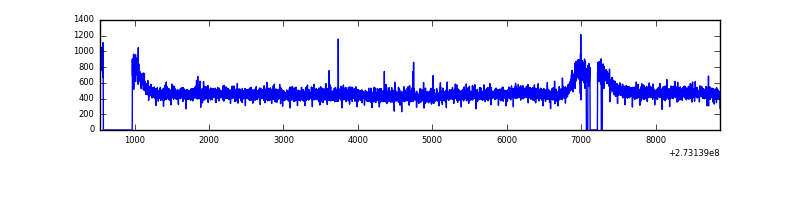 |
| B | 8331 | 7809 | 0 | 0 | 0.00% | 0.00% | 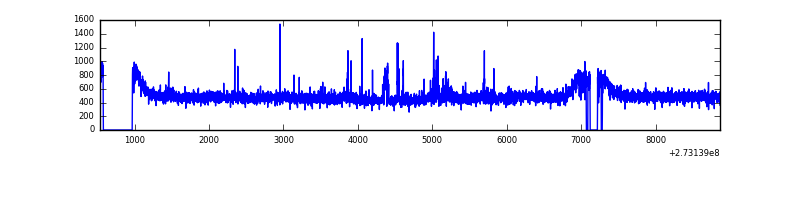 |
| C | 8331 | 7809 | 1 | 1 | 0.01% | 0.01% | 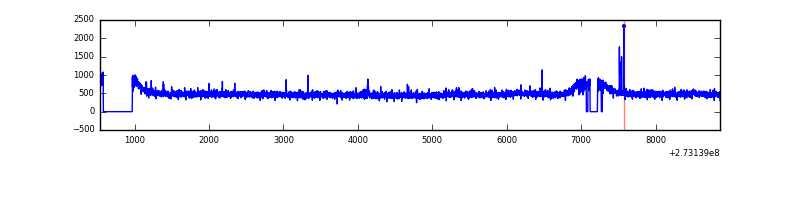 |
| D | 8331 | 7809 | 30 | 30 | 0.36% | 0.38% | 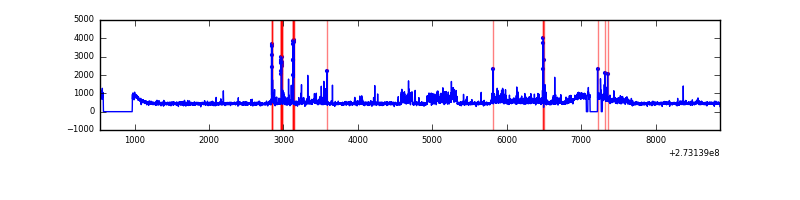 |
Top three noisy pixels from each quadrant. If the there are fewer than three noisy pixels in the level2.evt file, extra rows are filled as -1
| Pixel properties | Quadrant properties | ||||||
|---|---|---|---|---|---|---|---|
| Quadrant | DetID | PixID | Counts | Sigma | Mean | Median | Sigma |
| A | 0 | 226 | 8401 | 37.88 | 964 | 940 | 197.0 |
| A | 3 | 137 | 7084 | 31.19 | 964 | 940 | 197.0 |
| A | 12 | 194 | 7022 | 30.88 | 964 | 940 | 197.0 |
| B | 0 | 190 | 24691 | 127.26 | 966 | 938 | 186.7 |
| B | 12 | 111 | 22781 | 117.02 | 966 | 938 | 186.7 |
| B | 11 | 111 | 19762 | 100.85 | 966 | 938 | 186.7 |
| C | 14 | 238 | 141863 | 644.39 | 929 | 933 | 218.7 |
| C | 3 | 233 | 34709 | 154.44 | 929 | 933 | 218.7 |
| C | 10 | 187 | 14179 | 60.57 | 929 | 933 | 218.7 |
| D | 1 | 52 | 482441 | 1924.59 | 929 | 908 | 250.2 |
| D | 10 | 70 | 99986 | 395.99 | 929 | 908 | 250.2 |
| D | 5 | 51 | 54411 | 213.84 | 929 | 908 | 250.2 |
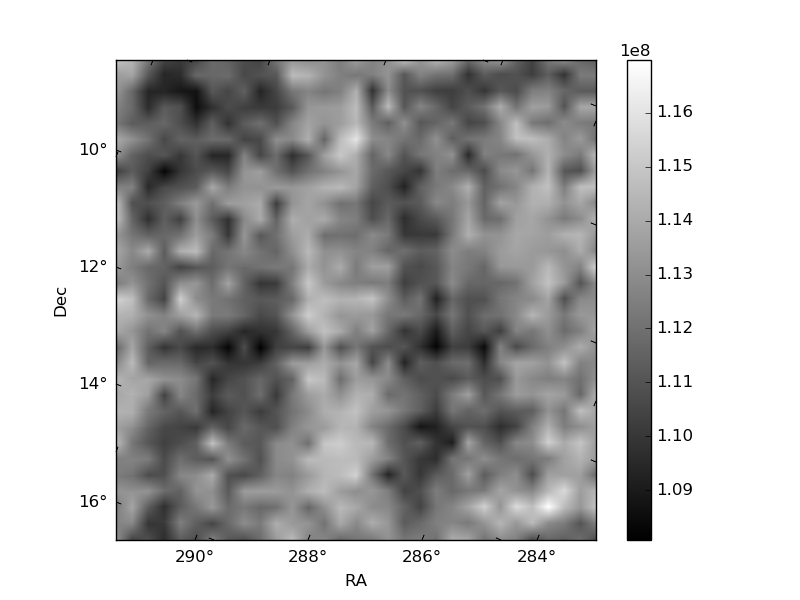
Histogram calculated using DETX and DETY for each event in the final _common_clean file
| Quadrant A | 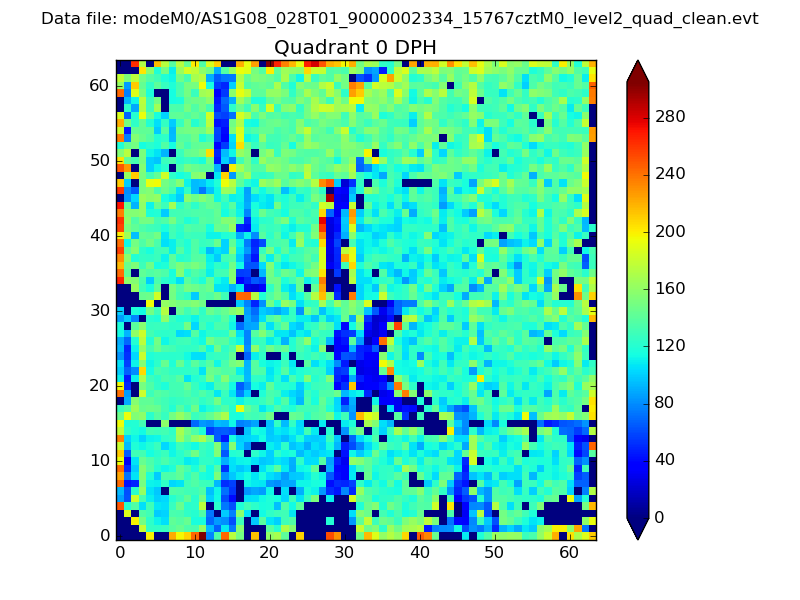 |
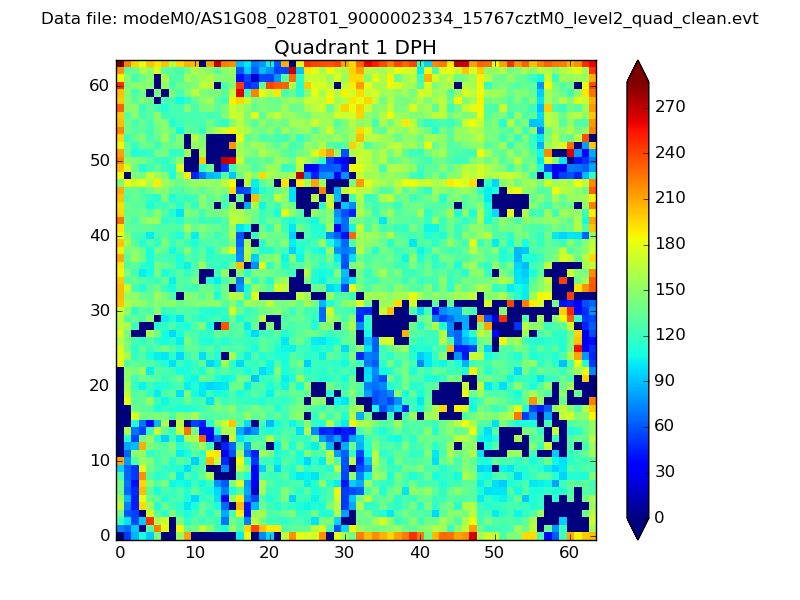 |
Quadrant B |
|---|---|---|---|
| Quadrant D |  |
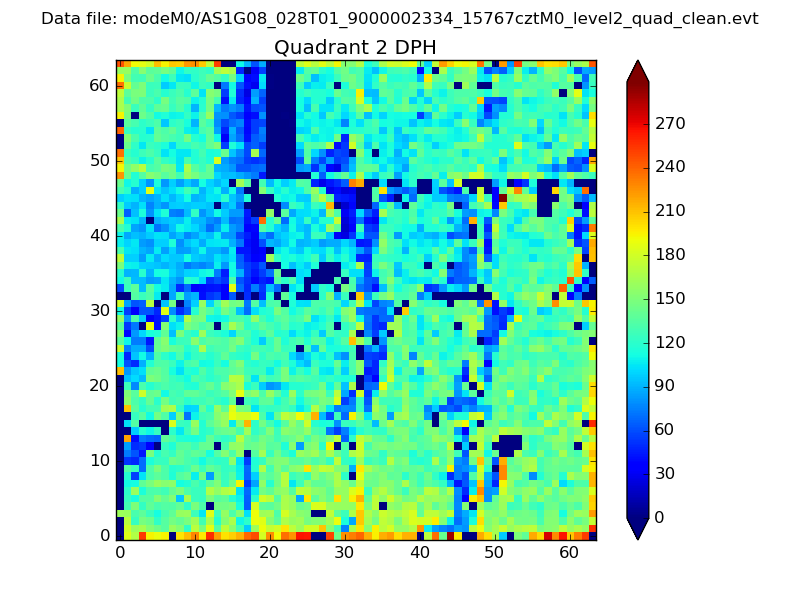 |
Quadrant C |
| Plot type | Count rate plots | Images |
|---|---|---|
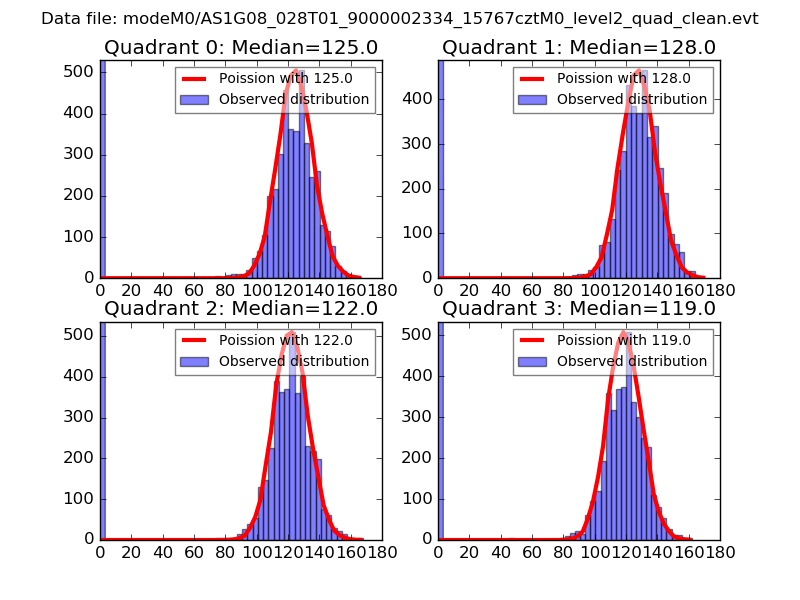
| Comparison with Poisson distribution Blue bars denote a histogram of data divided into 1 sec bins. Red curve is a Poisson curve with rate = median count rate of data. |
 |
 |
| Quadrant-wise count rates Data is divided into 100 sec bins |
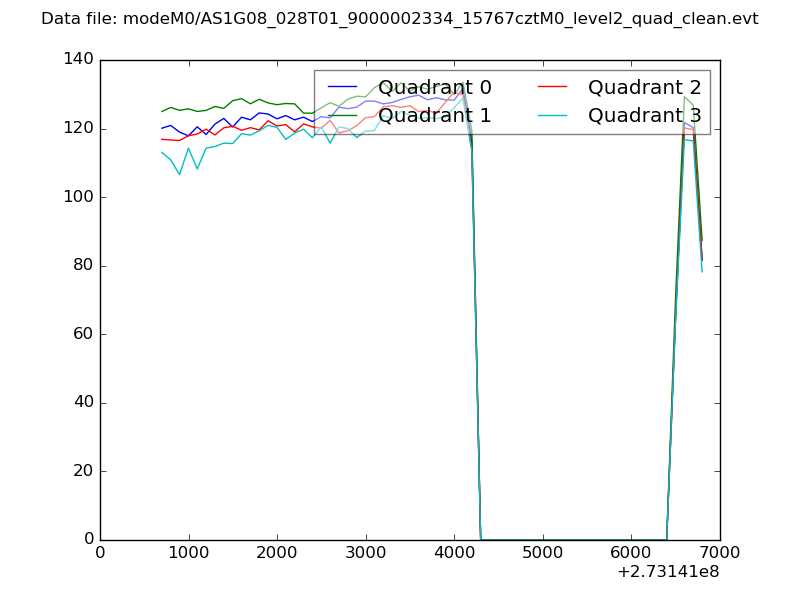 |
|
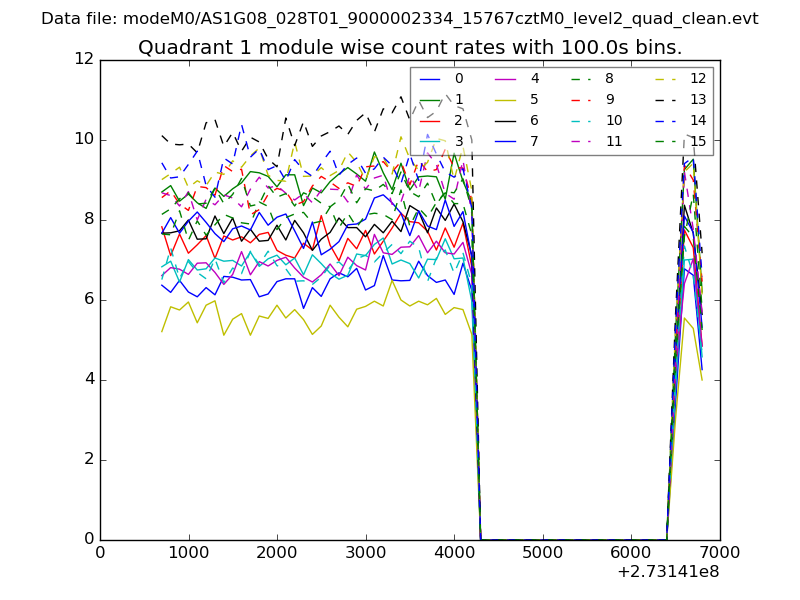
| Module-wise count rates for Quadrant A Data is divided into 100 sec bins |
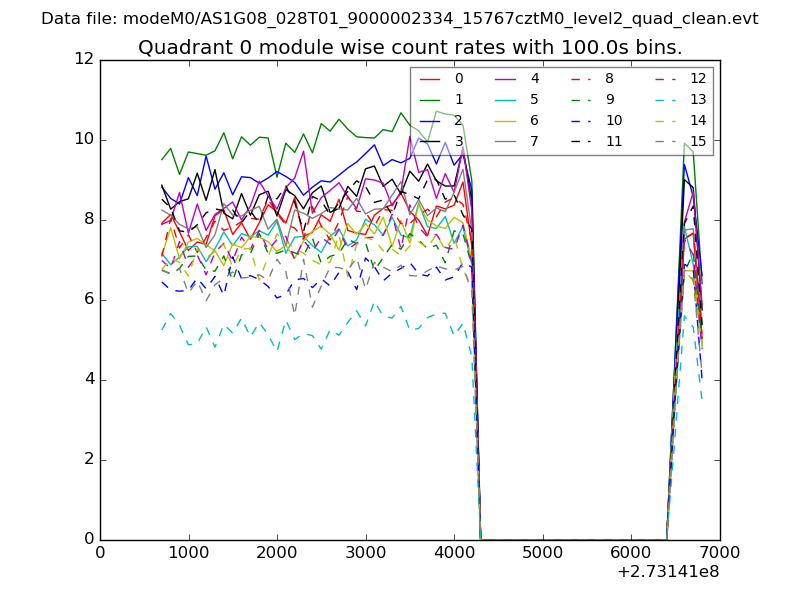 |
 |
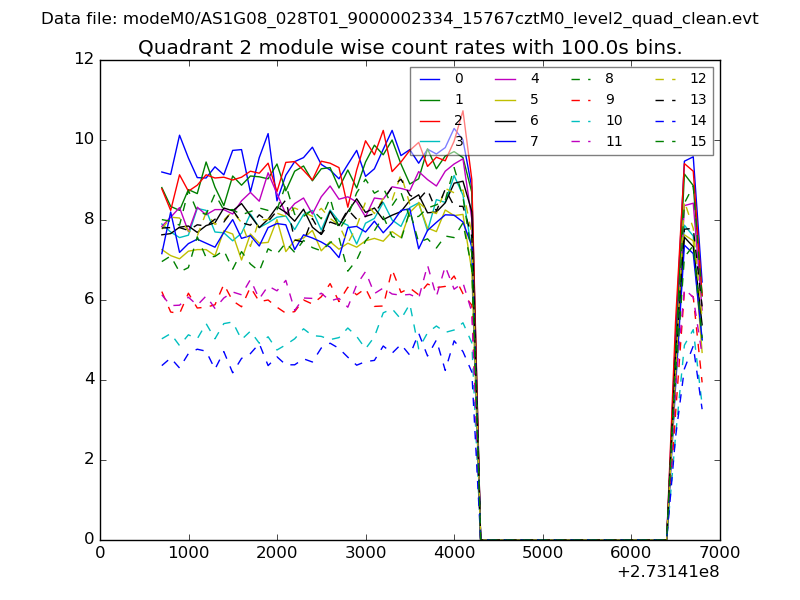
| Module-wise count rates for Quadrant B Data is divided into 100 sec bins |
 |
 |
| Module-wise count rates for Quadrant C Data is divided into 100 sec bins |
 |
 |
| Module-wise count rates for Quadrant D Data is divided into 100 sec bins |
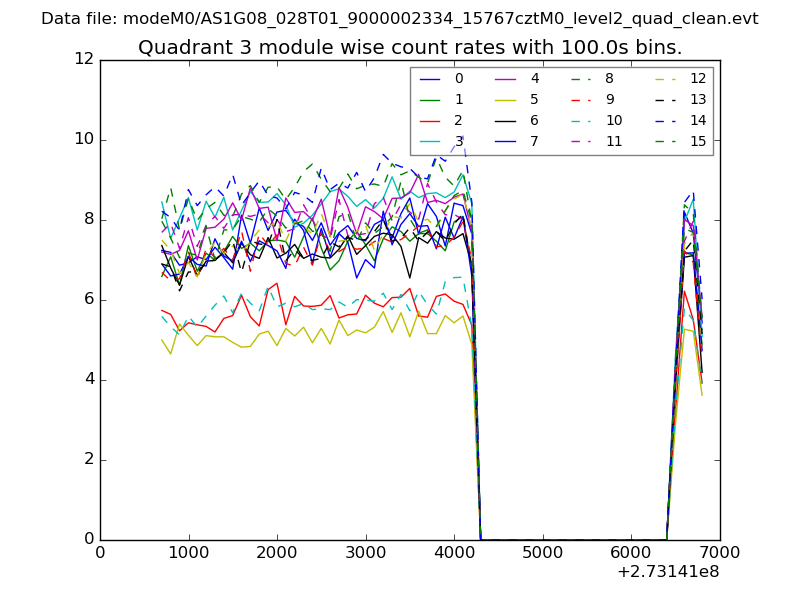 |
 |
| Parameter | Plot |
|---|---|
| CZT HV Monitor | 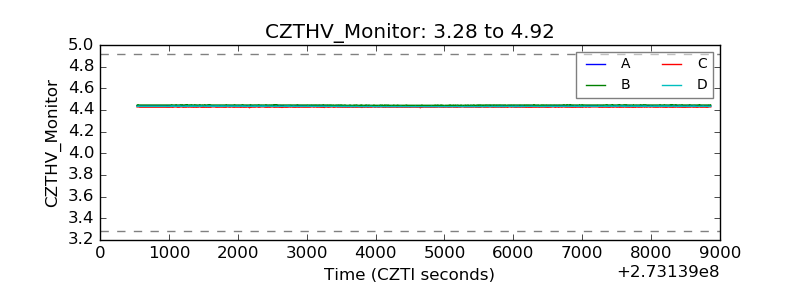 |
| D_VDD | 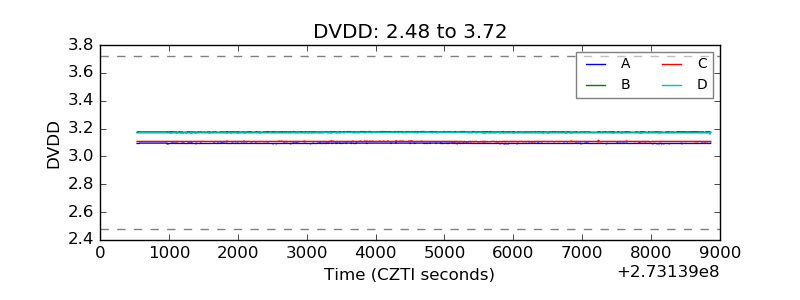 |
| Temperature 1 | 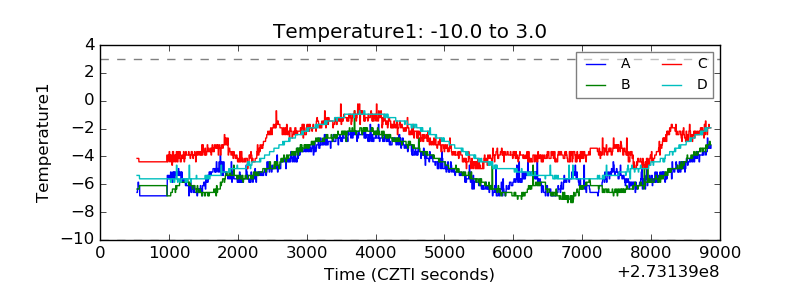 |
| Veto HV Monitor | 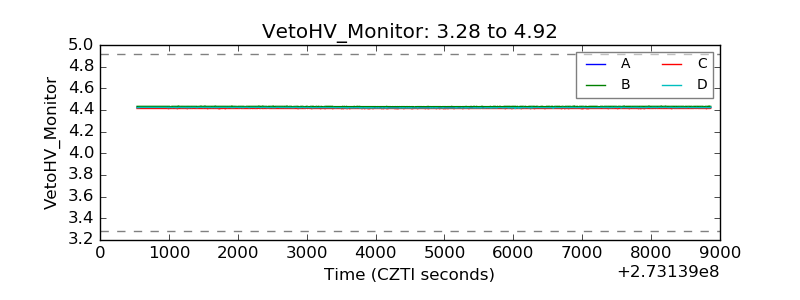 |
| Veto LLD | 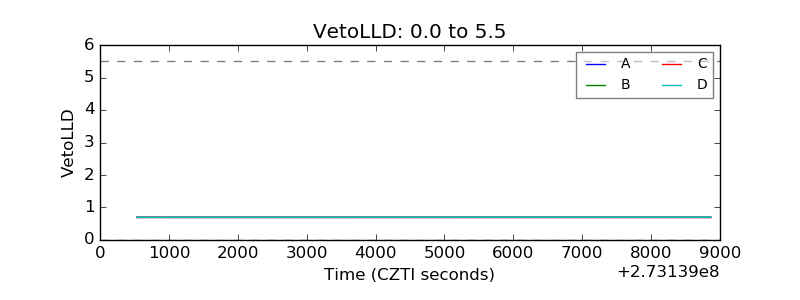 |
| Alpha Counter | 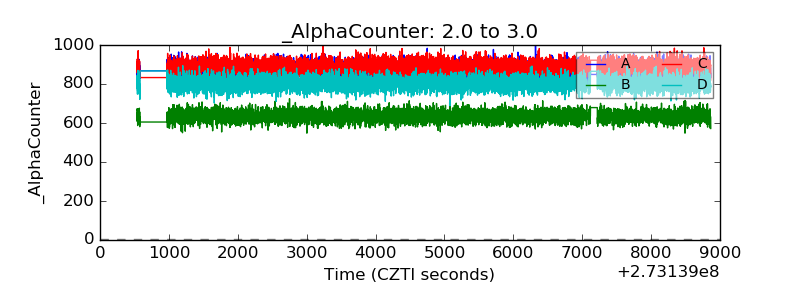 |
| _CPM_Rate | 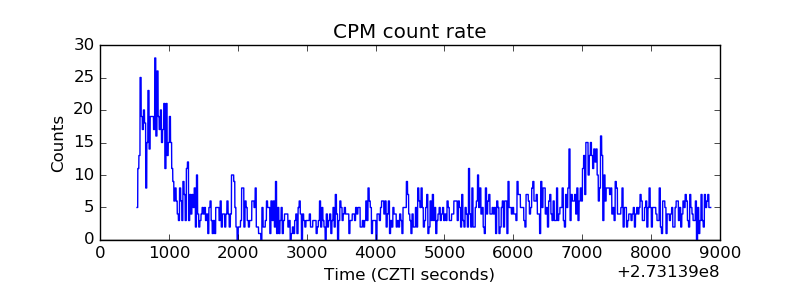 |
| CZT Counter | 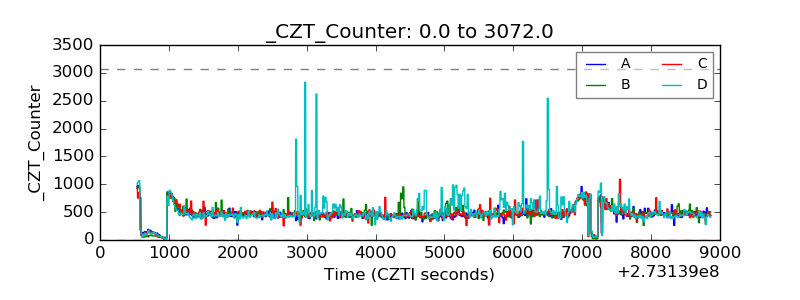 |
| +2.5 Volts monitor |  |
| +5 Volts monitor |  |
| _ROLL_ROT | 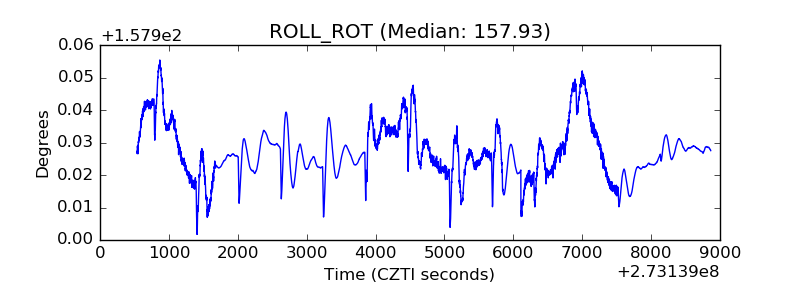 |
| _Roll_DEC | 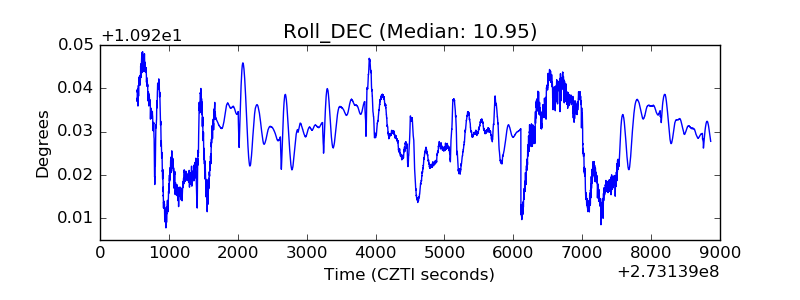 |
| _Roll_RA | 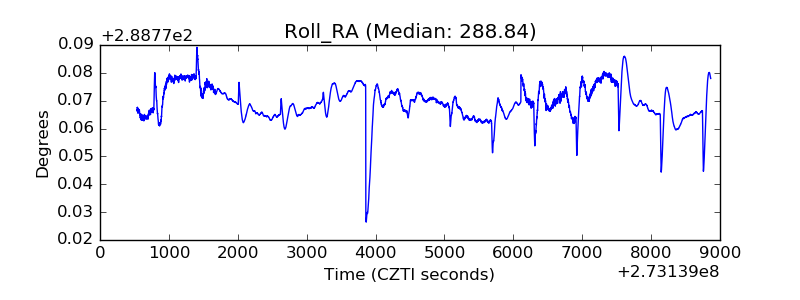 |
| Veto Counter | 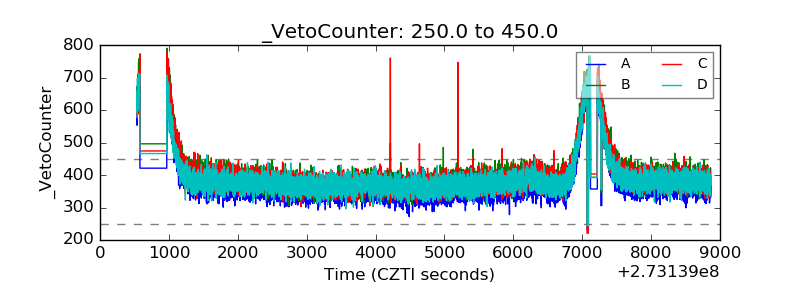 |