| Param | Original file | Final file |
|---|---|---|
| Filename | modeM0/AS1G08_028T01_9000002334_15768cztM0_level2.evt | modeM0/AS1G08_028T01_9000002334_15768cztM0_level2_quad_clean.evt |
| Size (bytes) | 529,174,080 | 89,847,360 |
| Size | 504.7 MB | 85.7 MB |
| Events in quadrant A | 3,788,801 | 546,194 |
| Events in quadrant B | 3,915,798 | 564,135 |
| Events in quadrant C | 3,851,439 | 535,317 |
| Events in quadrant D | 3,931,760 | 524,777 |
| Mode SS | |||
|---|---|---|---|
| Quadrant | BADHDUFLAG | Total packets | Discarded packets |
| A | 0 | 162 | 0 |
| B | 0 | 162 | 0 |
| C | 0 | 162 | 0 |
| D | 0 | 162 | 0 |
| Mode M0 | |||
|---|---|---|---|
| Quadrant | BADHDUFLAG | Total packets | Discarded packets |
| A | 0 | 16521 | 4 |
| B | 0 | 16643 | 3 |
| C | 0 | 16512 | 3 |
| D | 0 | 17135 | 3 |
| Mode M9 | |||
|---|---|---|---|
| Quadrant | BADHDUFLAG | Total packets | Discarded packets |
| A | 0 | 5 | 0 |
| B | 0 | 5 | 0 |
| C | 0 | 5 | 0 |
| D | 0 | 5 | 0 |
| Quadrant | Total seconds | Saturated seconds | Saturation percentage |
|---|---|---|---|
| A | 7917 | 351 | 4.433498% |
| B | 7917 | 374 | 4.724012% |
| C | 7917 | 377 | 4.761905% |
| D | 7917 | 319 | 4.029304% |
Noise dominated data is calculated using 1-second bins in cleaned event files. If a bin has >2000 counts, and if more than 50% of those come from <1% of pixels, then it is considered to be noise-dominated and hence unusable.
| Quadrant | # 1 sec bins | Bins with >0 counts | Bins with >2000 counts | High rate bins dominated by noise | Noise dominated (total time) | Noise dominated (detector-on time) | Marked lightcurve |
|---|---|---|---|---|---|---|---|
| A | 8373 | 7921 | 0 | 0 | 0.00% | 0.00% | 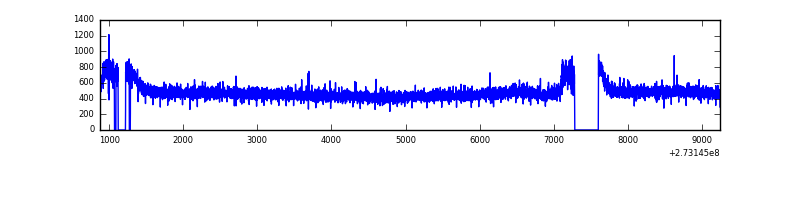 |
| B | 8373 | 7921 | 1 | 1 | 0.01% | 0.01% | 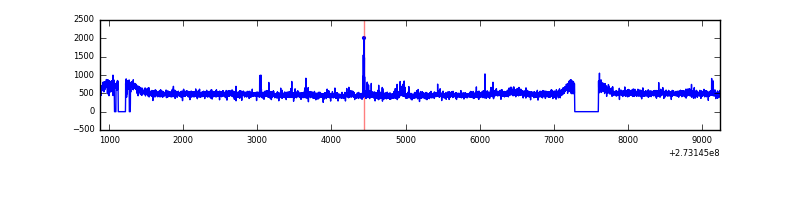 |
| C | 8373 | 7921 | 1 | 1 | 0.01% | 0.01% | 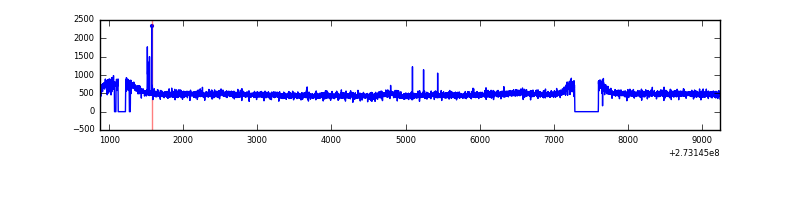 |
| D | 8373 | 7921 | 11 | 11 | 0.13% | 0.14% | 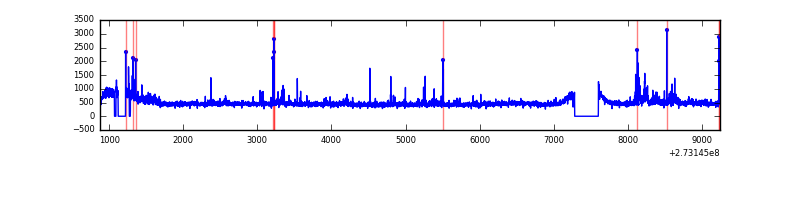 |
Top three noisy pixels from each quadrant. If the there are fewer than three noisy pixels in the level2.evt file, extra rows are filled as -1
| Pixel properties | Quadrant properties | ||||||
|---|---|---|---|---|---|---|---|
| Quadrant | DetID | PixID | Counts | Sigma | Mean | Median | Sigma |
| A | 15 | 239 | 16776 | 78.98 | 980 | 955 | 200.3 |
| A | 0 | 226 | 8673 | 38.53 | 980 | 955 | 200.3 |
| A | 12 | 194 | 7238 | 31.36 | 980 | 955 | 200.3 |
| B | 12 | 111 | 23190 | 116.58 | 980 | 952 | 190.7 |
| B | 3 | 209 | 20095 | 100.36 | 980 | 952 | 190.7 |
| B | 11 | 111 | 20077 | 100.26 | 980 | 952 | 190.7 |
| C | 14 | 238 | 142899 | 641.51 | 941 | 942 | 221.3 |
| C | 3 | 233 | 21995 | 95.14 | 941 | 942 | 221.3 |
| C | 10 | 187 | 13412 | 56.35 | 941 | 942 | 221.3 |
| D | 1 | 52 | 229948 | 898.16 | 949 | 926 | 255.0 |
| D | 2 | 234 | 30632 | 116.5 | 949 | 926 | 255.0 |
| D | 10 | 70 | 30174 | 114.7 | 949 | 926 | 255.0 |
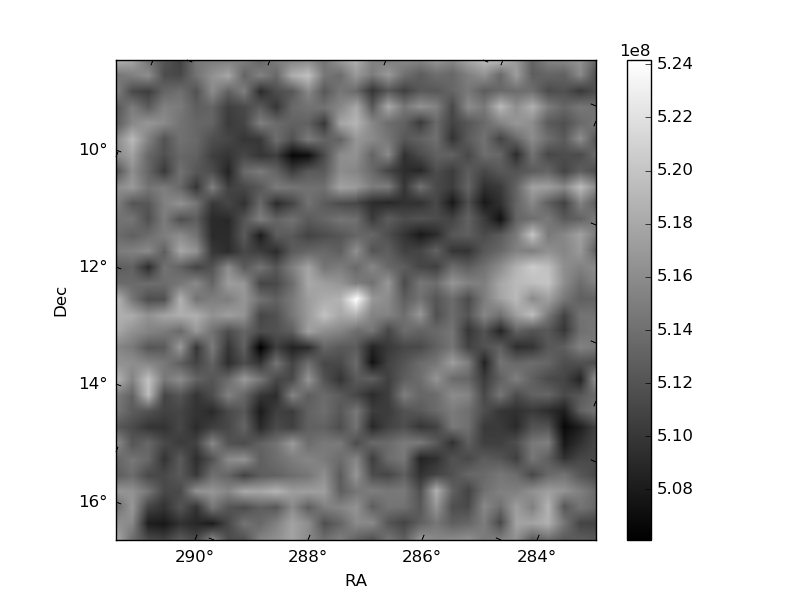
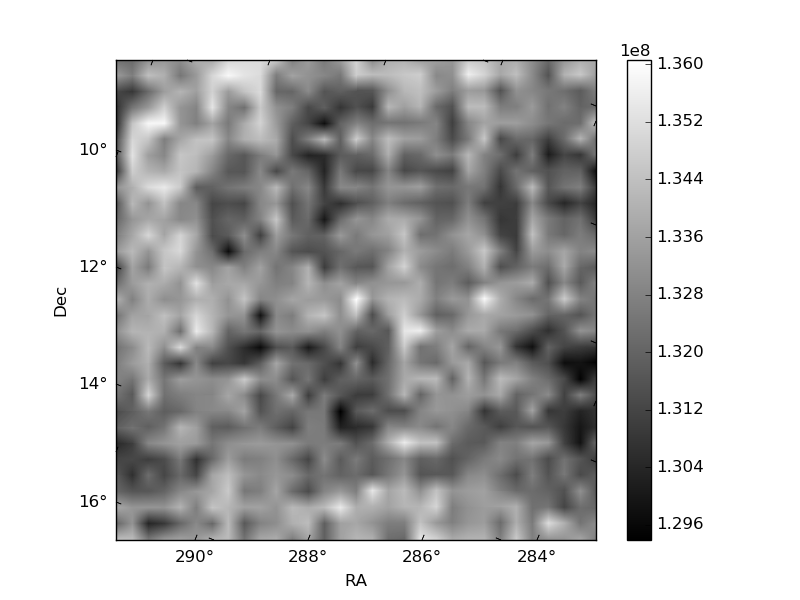
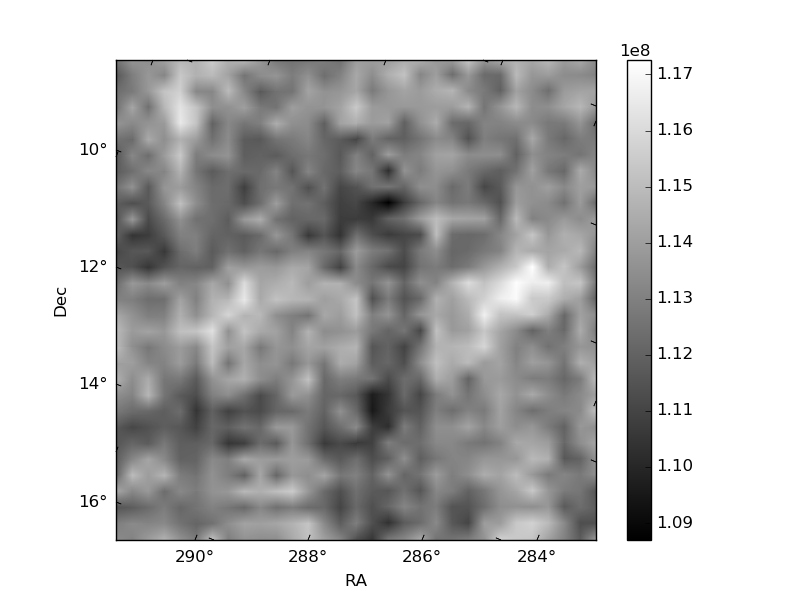
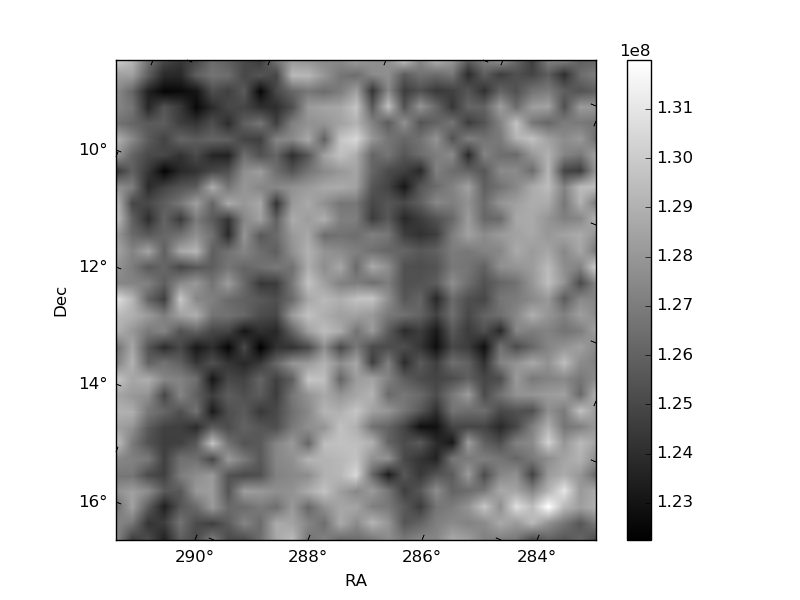
Histogram calculated using DETX and DETY for each event in the final _common_clean file
| Quadrant A | 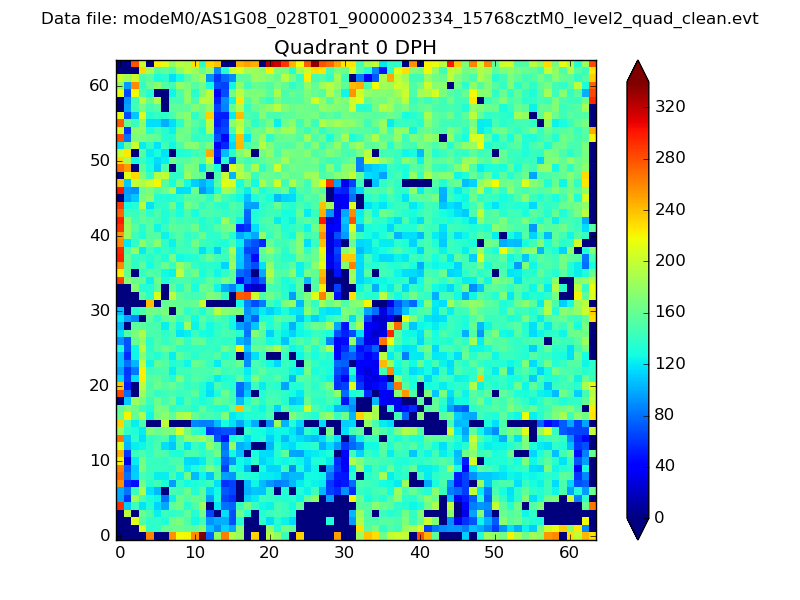 |
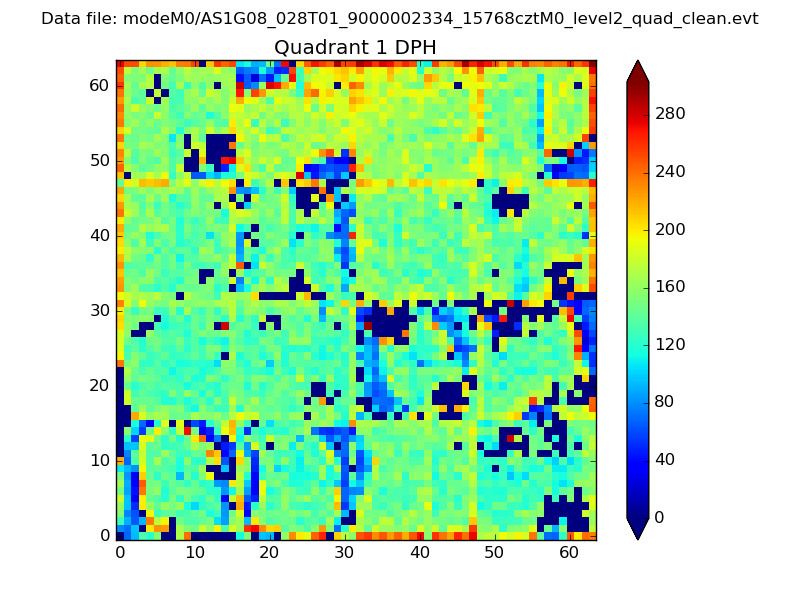 |
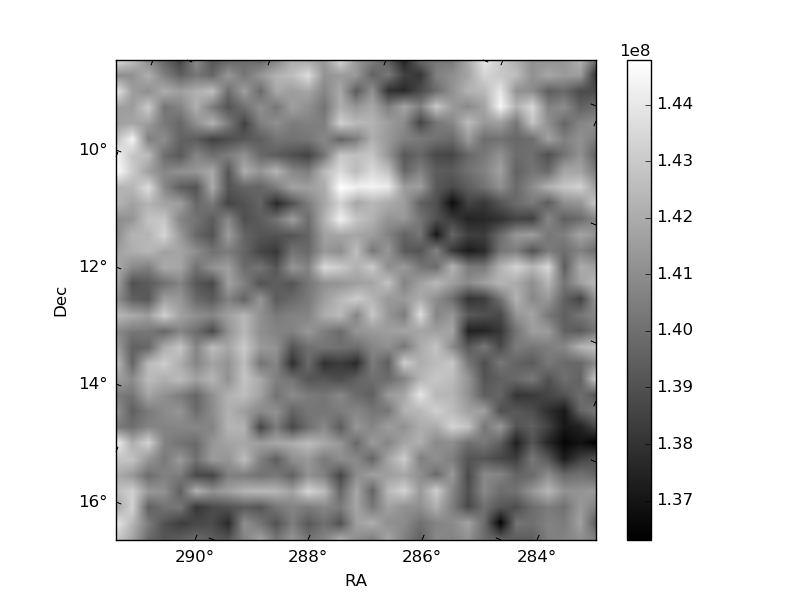
Quadrant B |
|---|---|---|---|
| Quadrant D | 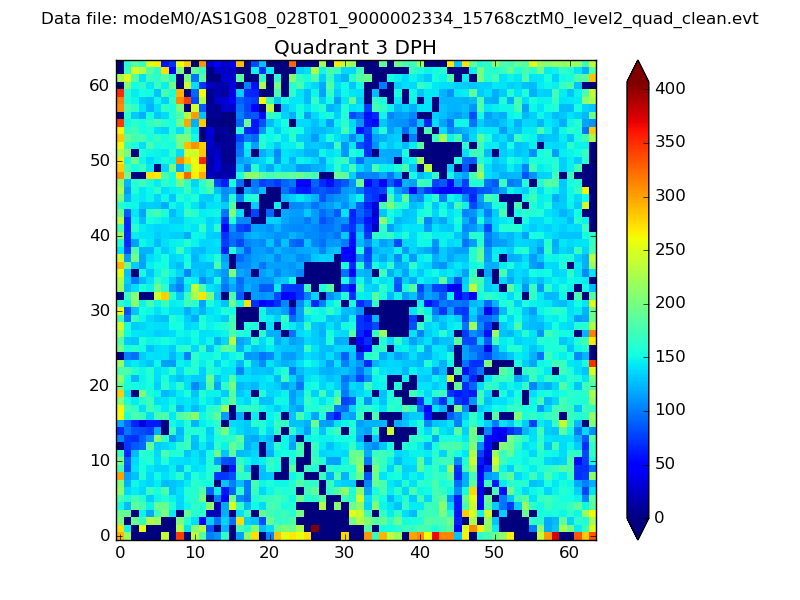 |
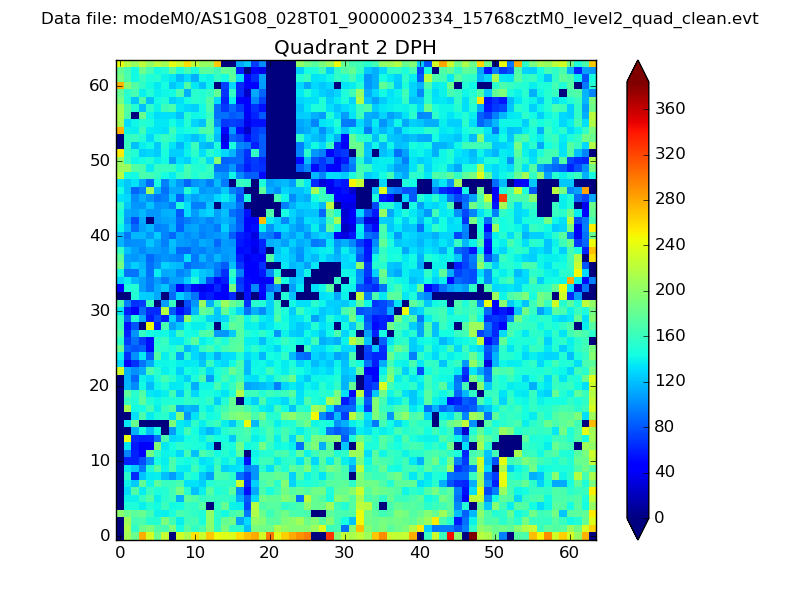 |
Quadrant C |
| Plot type | Count rate plots | Images |
|---|---|---|
| Comparison with Poisson distribution Blue bars denote a histogram of data divided into 1 sec bins. Red curve is a Poisson curve with rate = median count rate of data. |
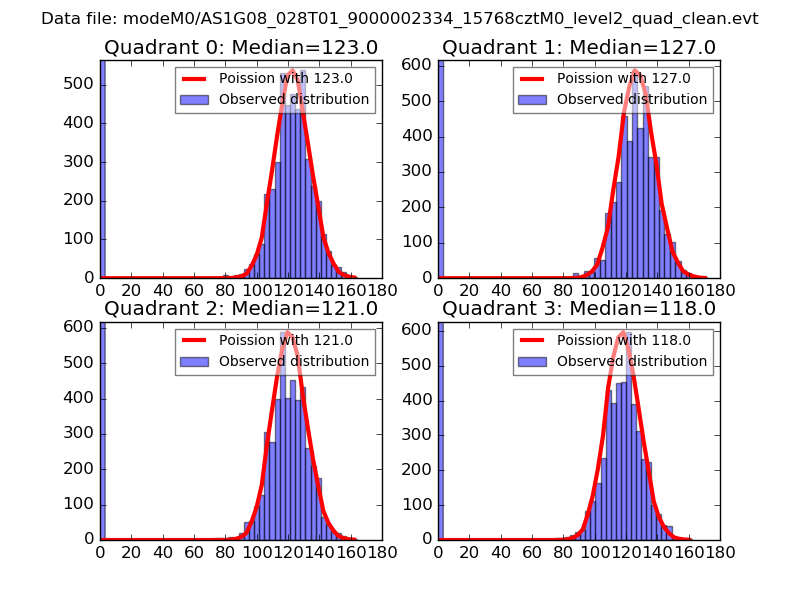 |
 |
| Quadrant-wise count rates Data is divided into 100 sec bins |
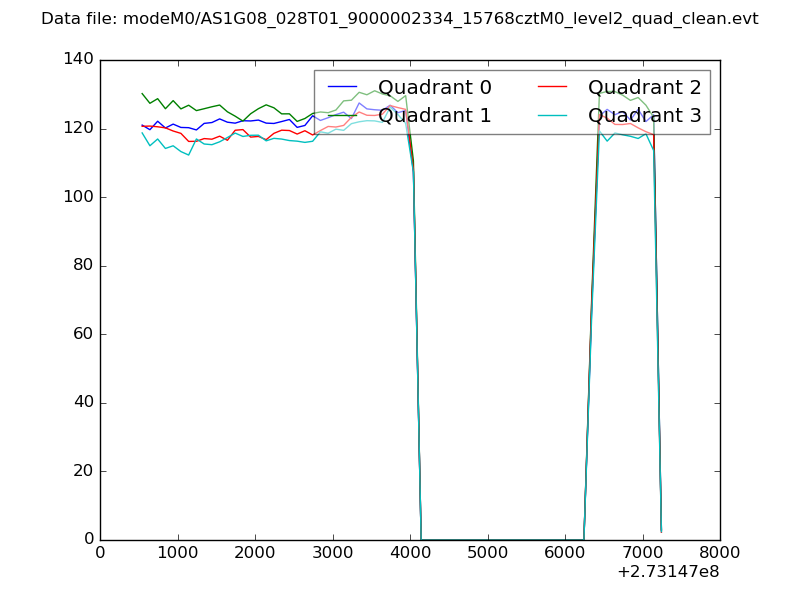 |
|
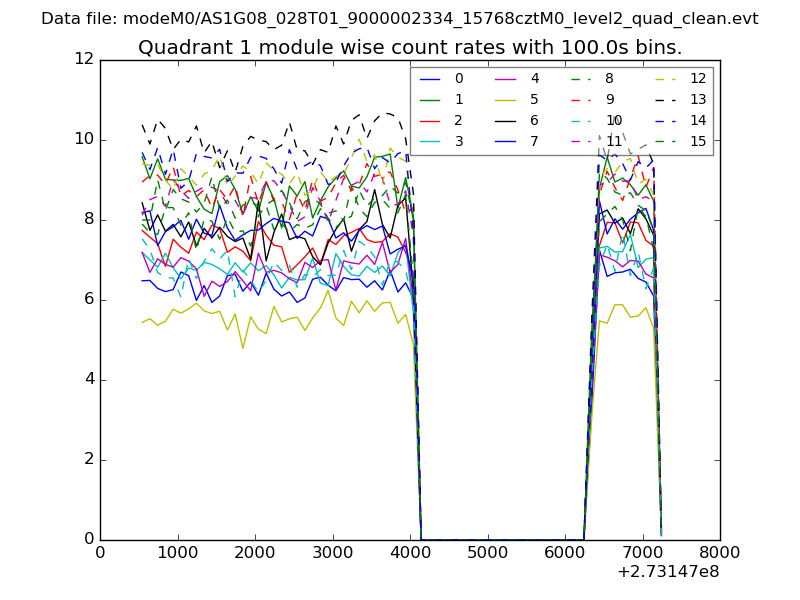
| Module-wise count rates for Quadrant A Data is divided into 100 sec bins |
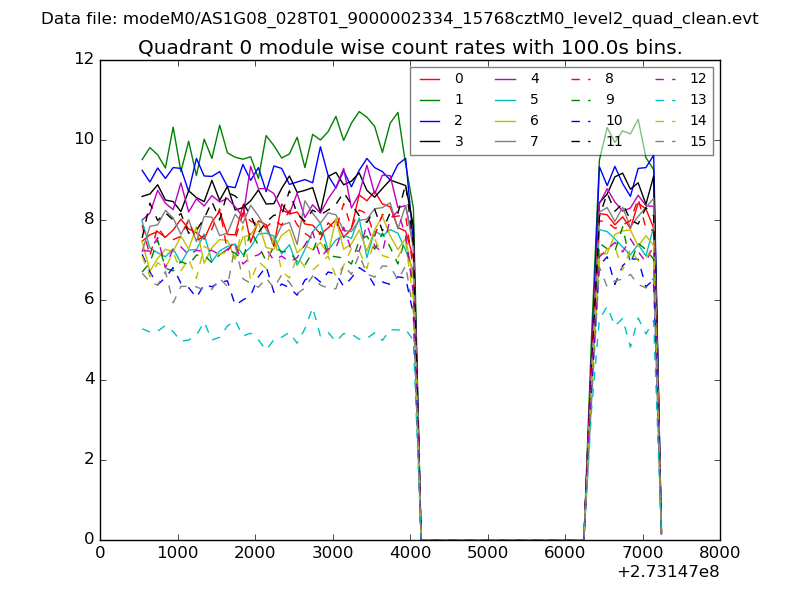 |
 |
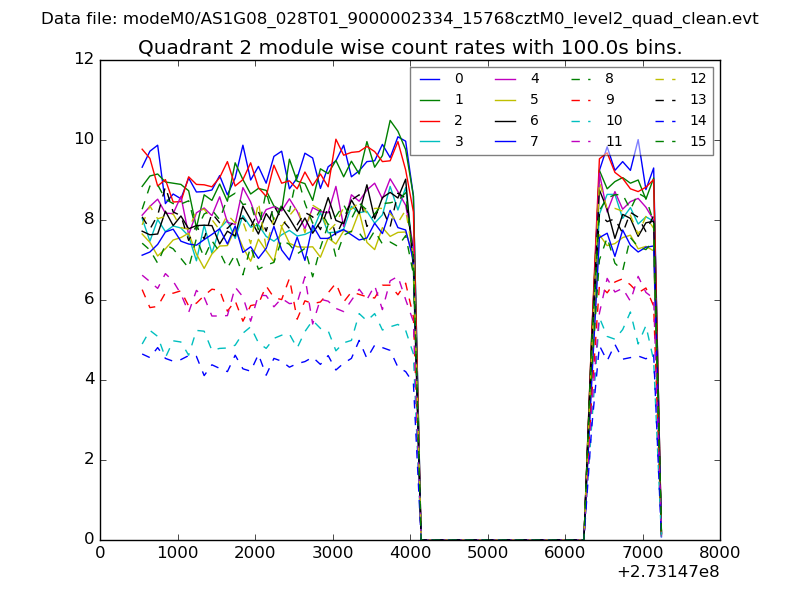
| Module-wise count rates for Quadrant B Data is divided into 100 sec bins |
 |
 |
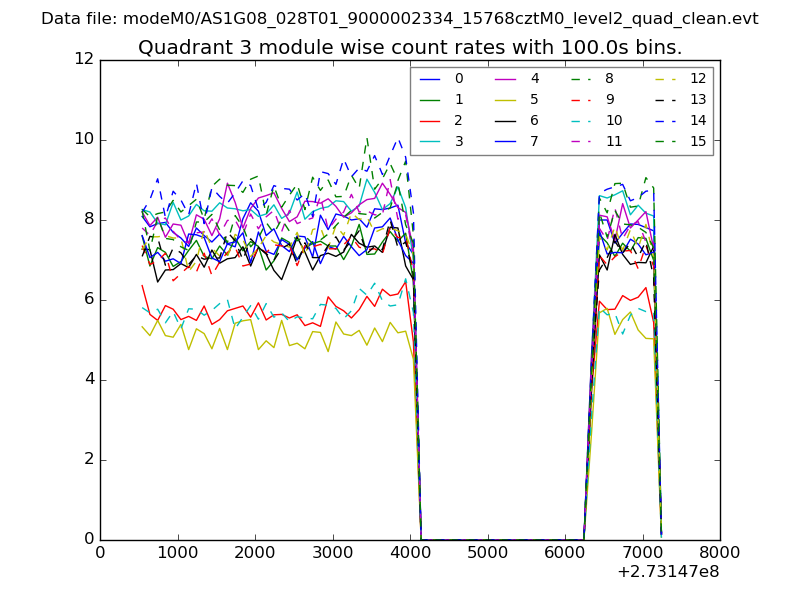
| Module-wise count rates for Quadrant C Data is divided into 100 sec bins |
 |
 |
| Module-wise count rates for Quadrant D Data is divided into 100 sec bins |
 |
 |
| Parameter | Plot |
|---|---|
| CZT HV Monitor | 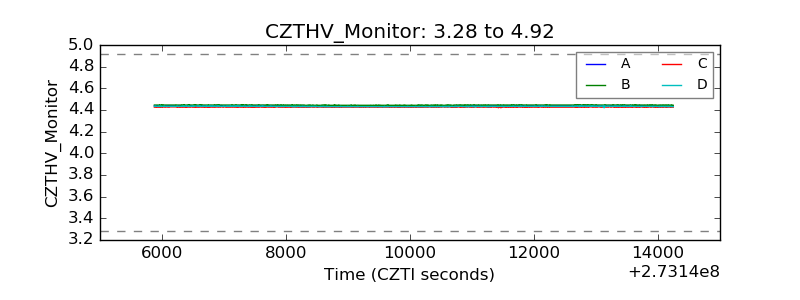 |
| D_VDD | 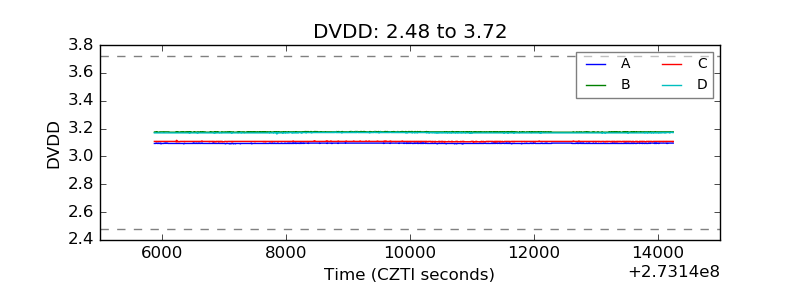 |
| Temperature 1 | 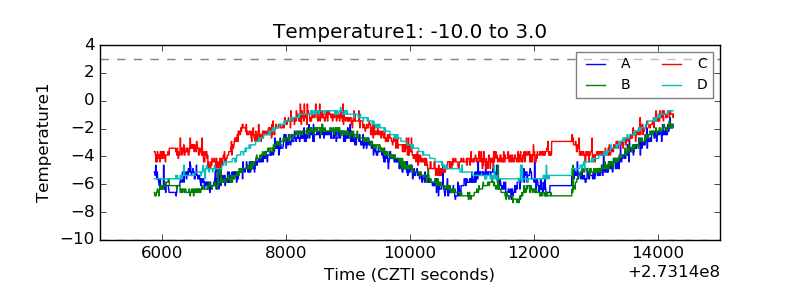 |
| Veto HV Monitor |  |
| Veto LLD |  |
| Alpha Counter | 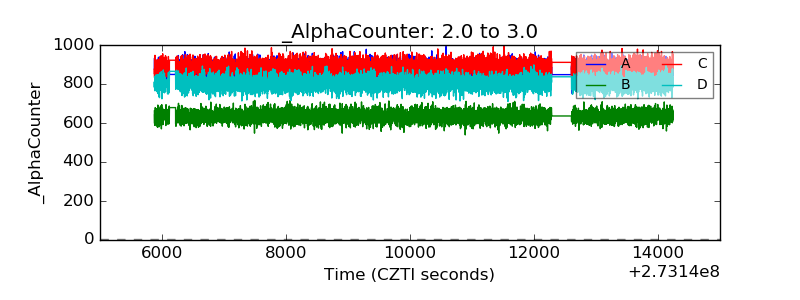 |
| _CPM_Rate | 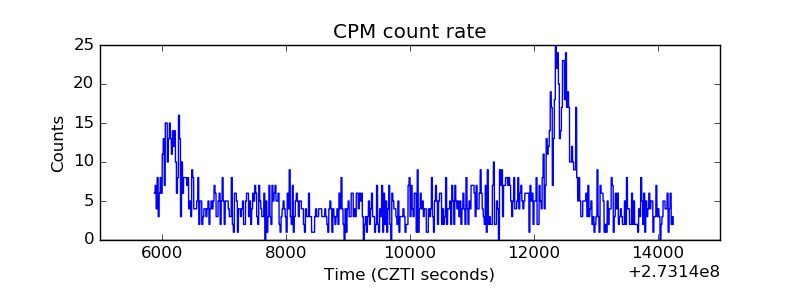 |
| CZT Counter | 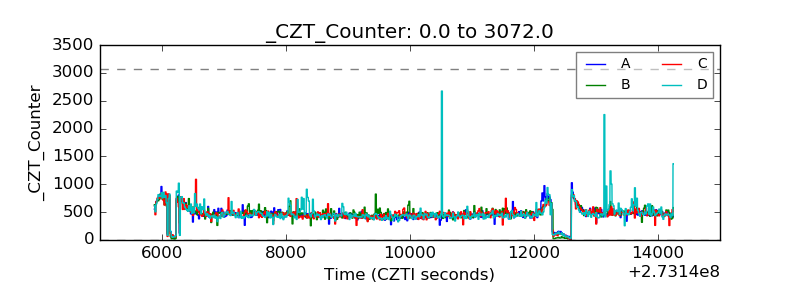 |
| +2.5 Volts monitor |  |
| +5 Volts monitor |  |
| _ROLL_ROT | 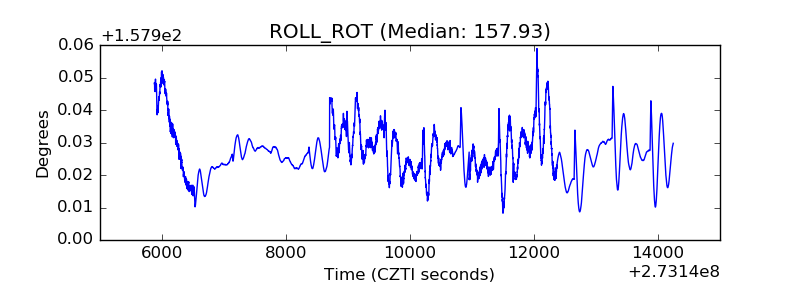 |
| _Roll_DEC | 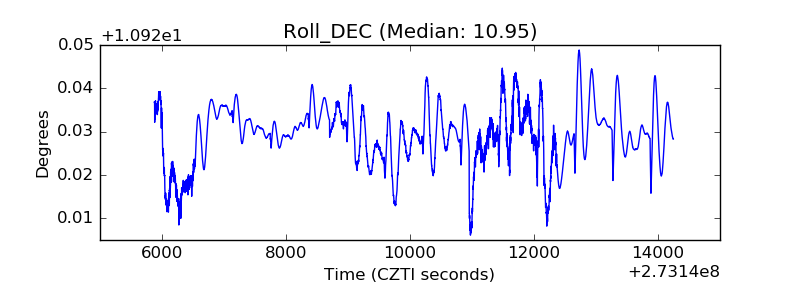 |
| _Roll_RA | 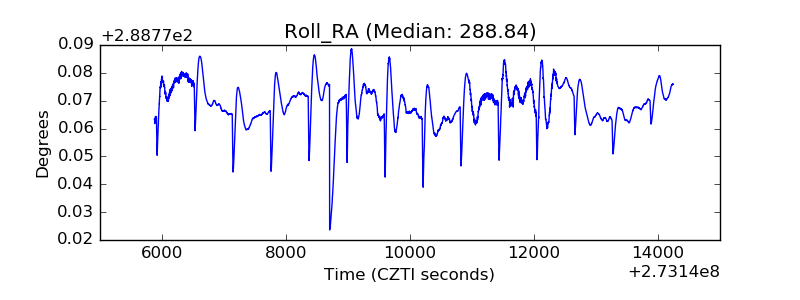 |
| Veto Counter | 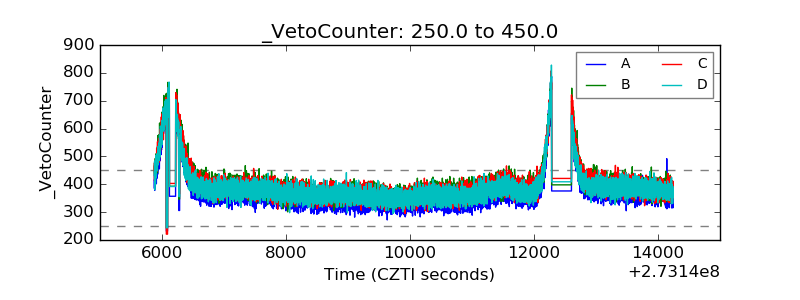 |