| Param | Original file | Final file |
|---|---|---|
| Filename | modeM0/AS1G08_028T01_9000002334_15771cztM0_level2.evt | modeM0/AS1G08_028T01_9000002334_15771cztM0_level2_quad_clean.evt |
| Size (bytes) | 234,950,400 | 50,722,560 |
| Size | 224.1 MB | 48.4 MB |
| Events in quadrant A | 1,530,373 | 329,566 |
| Events in quadrant B | 1,670,639 | 337,063 |
| Events in quadrant C | 1,540,401 | 322,124 |
| Events in quadrant D | 2,142,903 | 307,608 |
| Mode SS | |||
|---|---|---|---|
| Quadrant | BADHDUFLAG | Total packets | Discarded packets |
| A | 0 | 68 | 0 |
| B | 0 | 68 | 0 |
| C | 0 | 68 | 0 |
| D | 0 | 68 | 0 |
| Mode M0 | |||
|---|---|---|---|
| Quadrant | BADHDUFLAG | Total packets | Discarded packets |
| A | 0 | 6779 | 0 |
| B | 0 | 7055 | 0 |
| C | 0 | 6780 | 0 |
| D | 0 | 8660 | 0 |
| Quadrant | Total seconds | Saturated seconds | Saturation percentage |
|---|---|---|---|
| A | 3371 | 2 | 0.059330% |
| B | 3371 | 11 | 0.326313% |
| C | 3371 | 16 | 0.474637% |
| D | 3371 | 153 | 4.538713% |
Noise dominated data is calculated using 1-second bins in cleaned event files. If a bin has >2000 counts, and if more than 50% of those come from <1% of pixels, then it is considered to be noise-dominated and hence unusable.
| Quadrant | # 1 sec bins | Bins with >0 counts | Bins with >2000 counts | High rate bins dominated by noise | Noise dominated (total time) | Noise dominated (detector-on time) | Marked lightcurve |
|---|---|---|---|---|---|---|---|
| A | 3372 | 3372 | 0 | 0 | 0.00% | 0.00% | 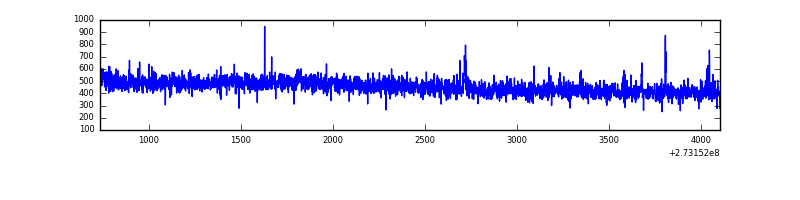 |
| B | 3372 | 3372 | 2 | 2 | 0.06% | 0.06% | 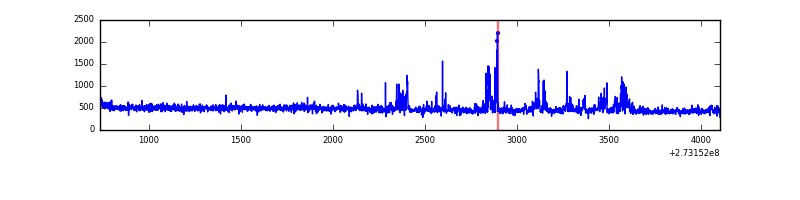 |
| C | 3372 | 3372 | 0 | 0 | 0.00% | 0.00% | 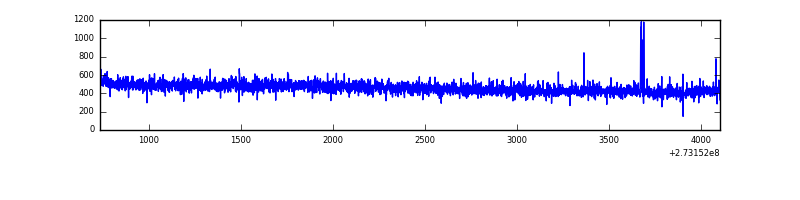 |
| D | 3372 | 3372 | 142 | 142 | 4.21% | 4.21% | 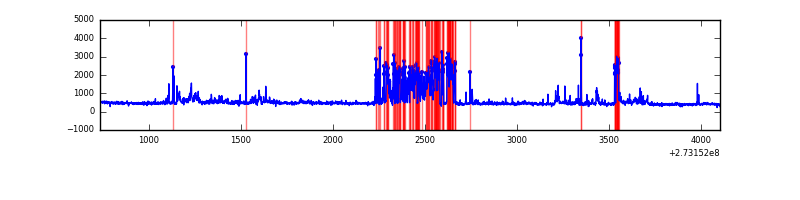 |
Top three noisy pixels from each quadrant. If the there are fewer than three noisy pixels in the level2.evt file, extra rows are filled as -1
| Pixel properties | Quadrant properties | ||||||
|---|---|---|---|---|---|---|---|
| Quadrant | DetID | PixID | Counts | Sigma | Mean | Median | Sigma |
| A | 15 | 239 | 12165 | 146.91 | 392 | 383 | 80.2 |
| A | 0 | 226 | 3545 | 39.42 | 392 | 383 | 80.2 |
| A | 15 | 69 | 3496 | 38.81 | 392 | 383 | 80.2 |
| B | 3 | 209 | 58346 | 763.66 | 390 | 381 | 75.9 |
| B | 5 | 236 | 36283 | 472.99 | 390 | 381 | 75.9 |
| B | 4 | 216 | 19726 | 254.86 | 390 | 381 | 75.9 |
| C | 14 | 238 | 58235 | 651.94 | 375 | 377 | 88.7 |
| C | 7 | 247 | 8711 | 93.9 | 375 | 377 | 88.7 |
| C | 15 | 127 | 6484 | 68.81 | 375 | 377 | 88.7 |
| D | 1 | 52 | 637694 | 6561.43 | 376 | 366 | 97.1 |
| D | 10 | 70 | 31754 | 323.15 | 376 | 366 | 97.1 |
| D | 15 | 145 | 14846 | 149.07 | 376 | 366 | 97.1 |
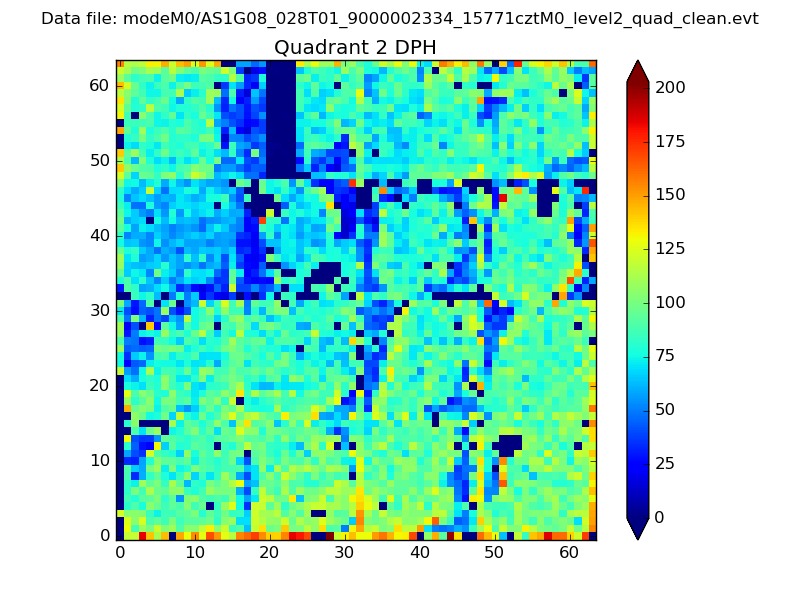
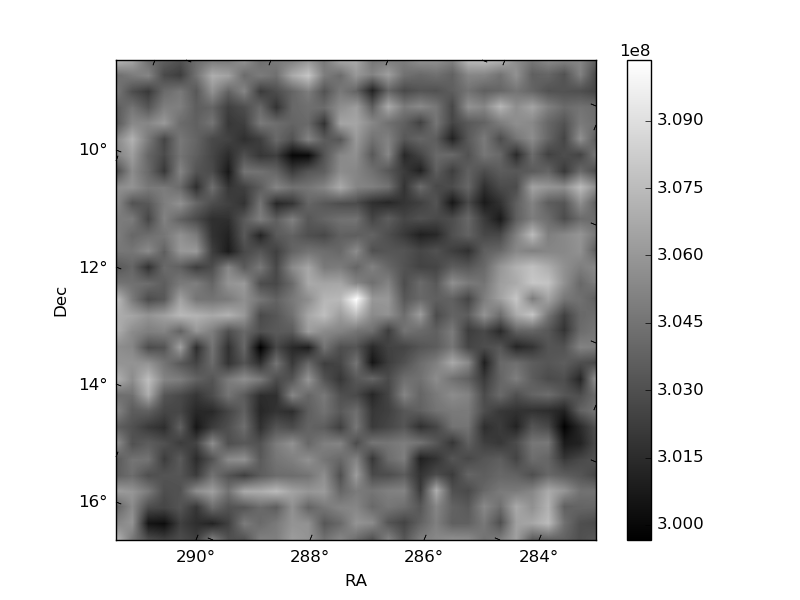
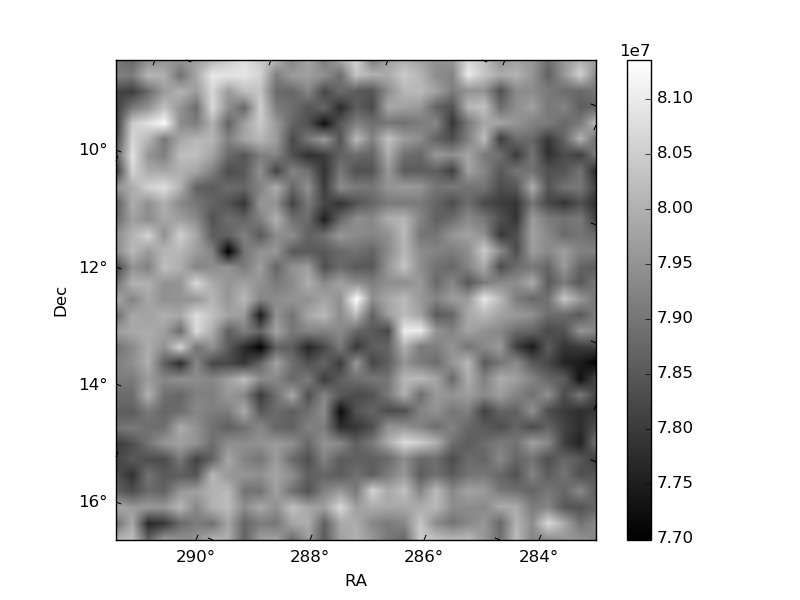
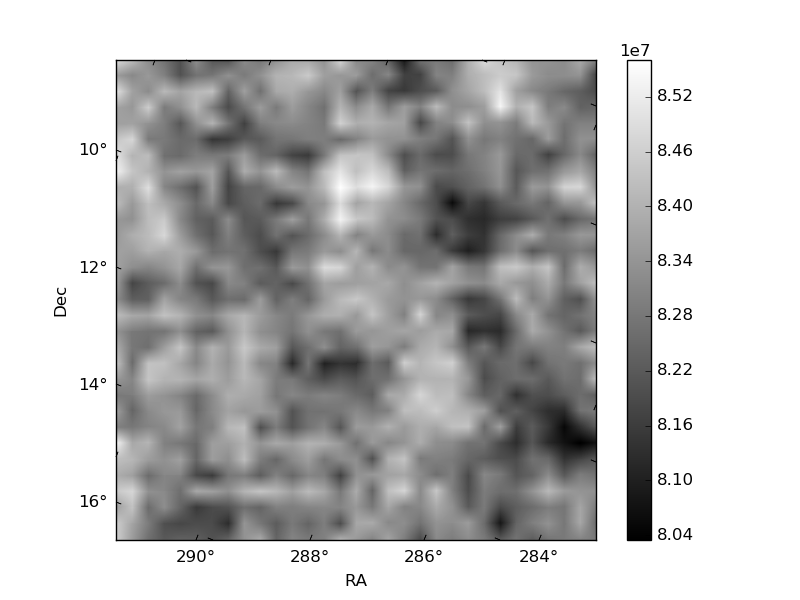
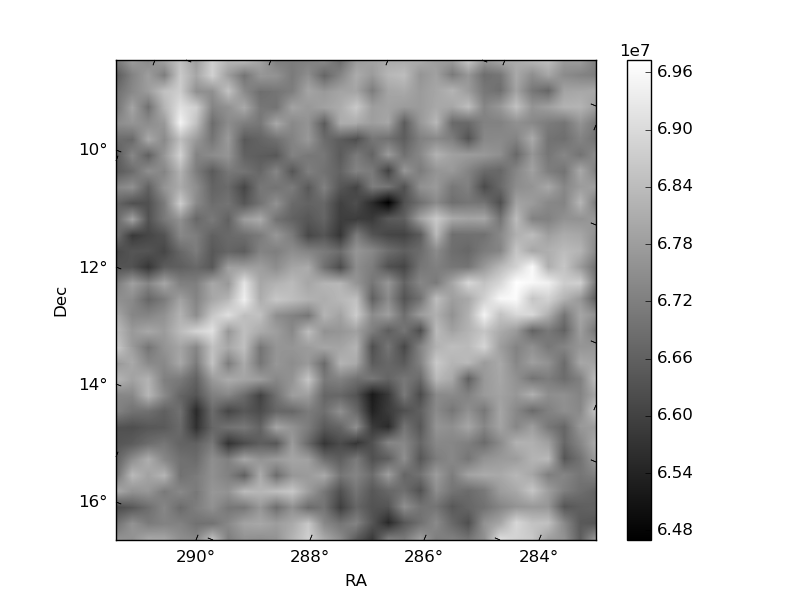
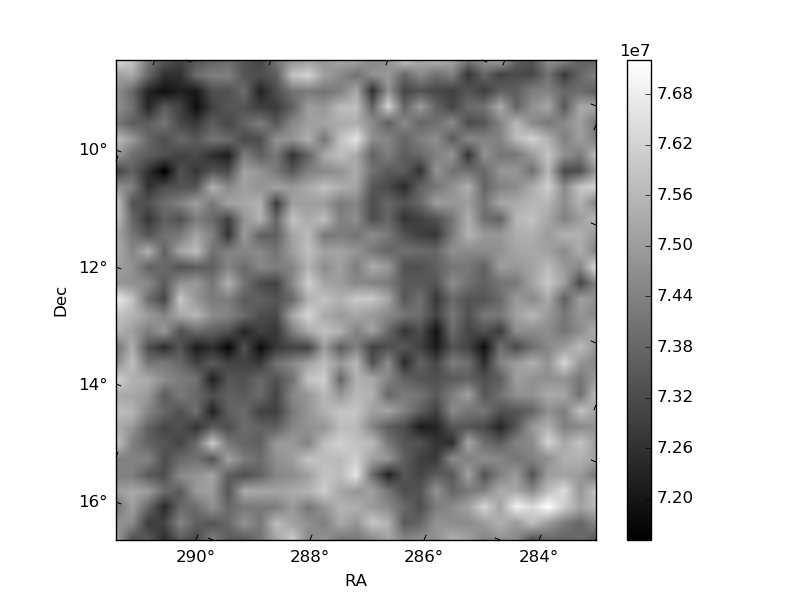
Histogram calculated using DETX and DETY for each event in the final _common_clean file
| Quadrant A | 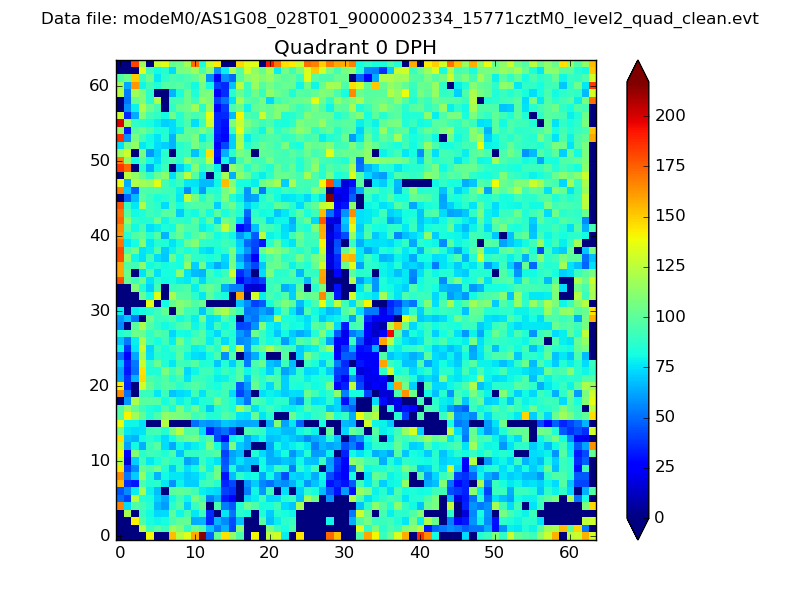 |
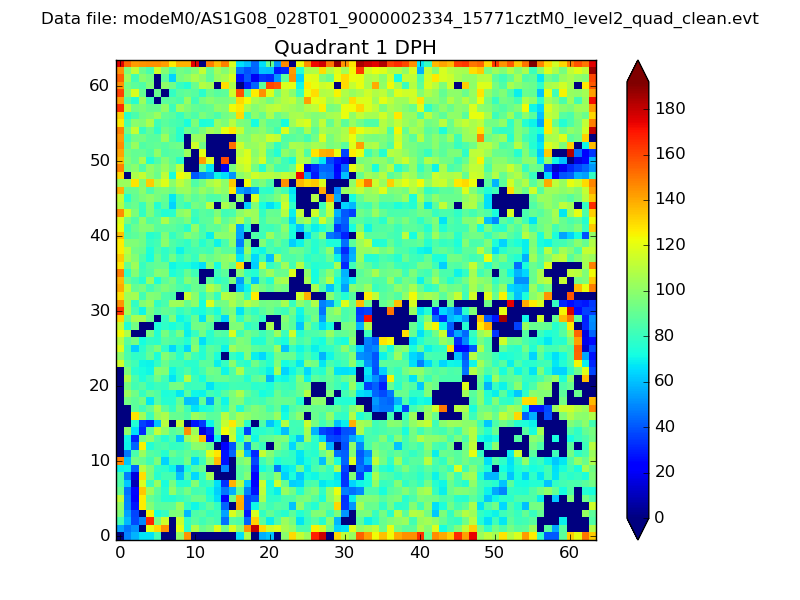 |
Quadrant B |
|---|---|---|---|
| Quadrant D | 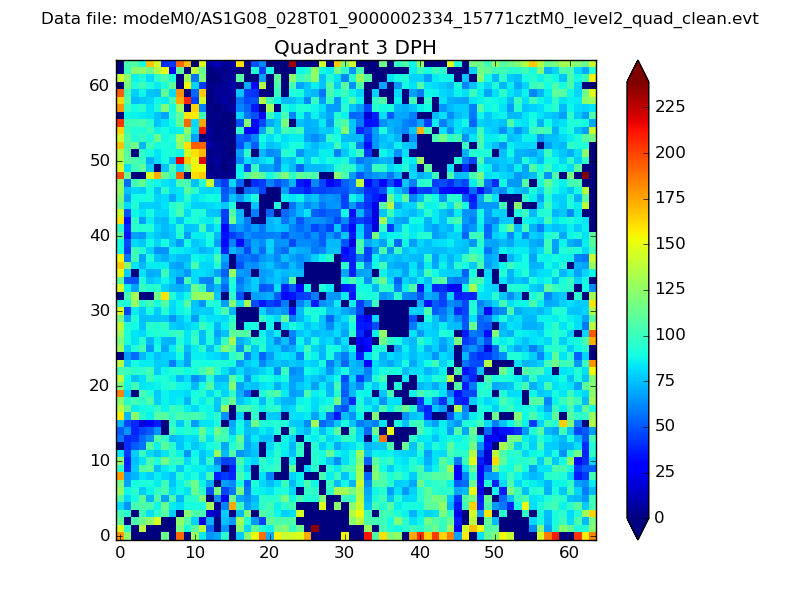 |
 |
Quadrant C |
| Plot type | Count rate plots | Images |
|---|---|---|
| Comparison with Poisson distribution Blue bars denote a histogram of data divided into 1 sec bins. Red curve is a Poisson curve with rate = median count rate of data. |
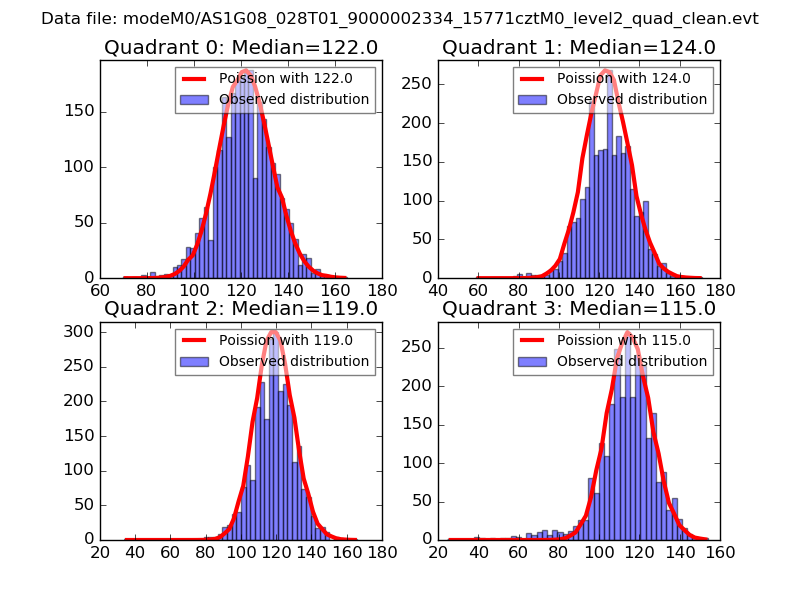 |
 |
| Quadrant-wise count rates Data is divided into 100 sec bins |
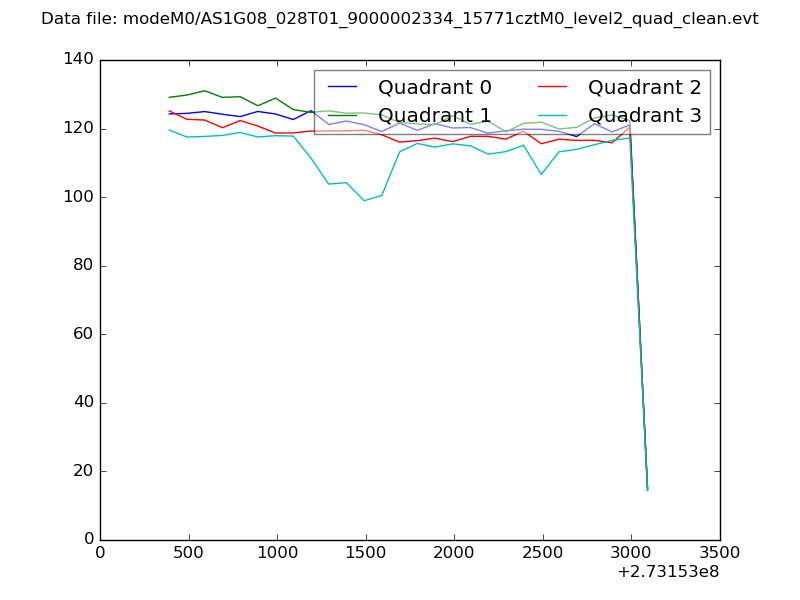 |
|
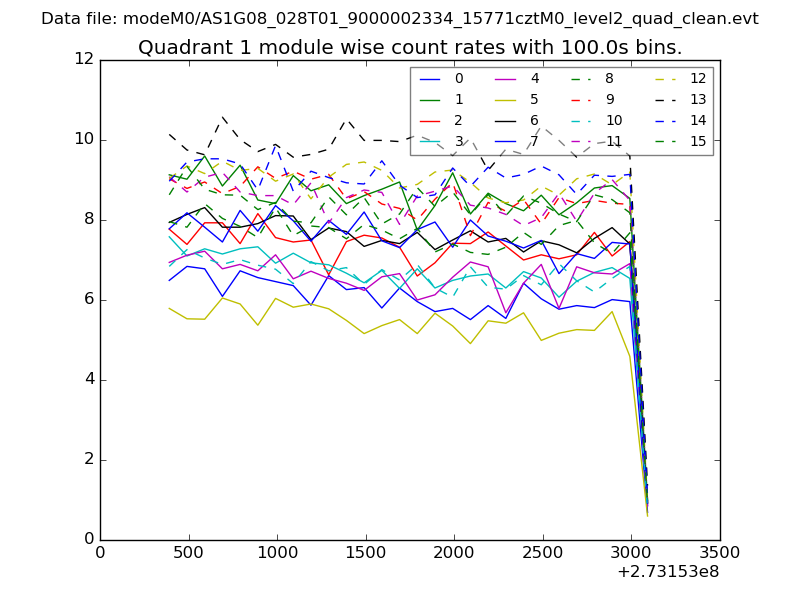
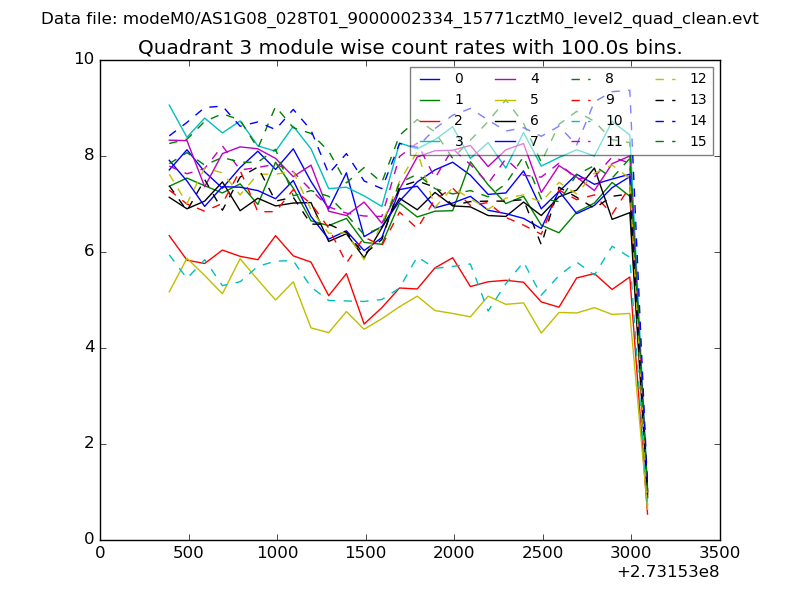
| Module-wise count rates for Quadrant A Data is divided into 100 sec bins |
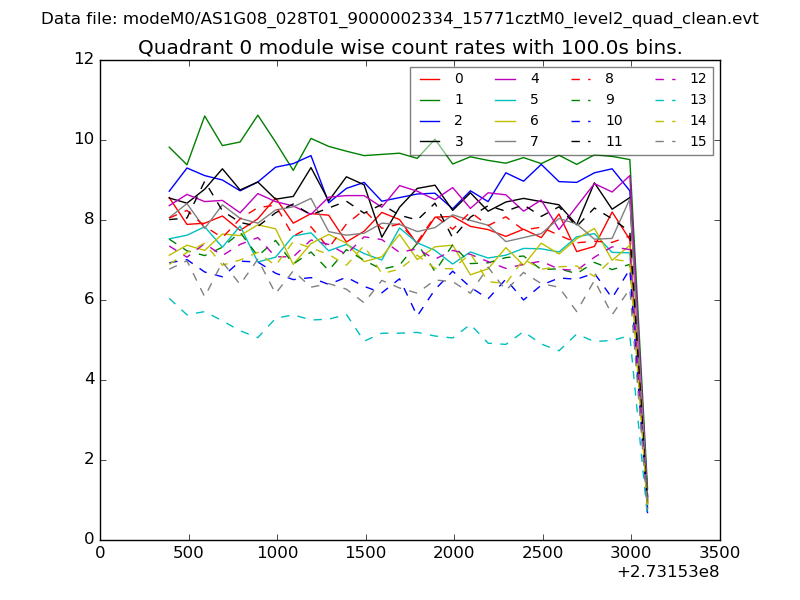 |
 |
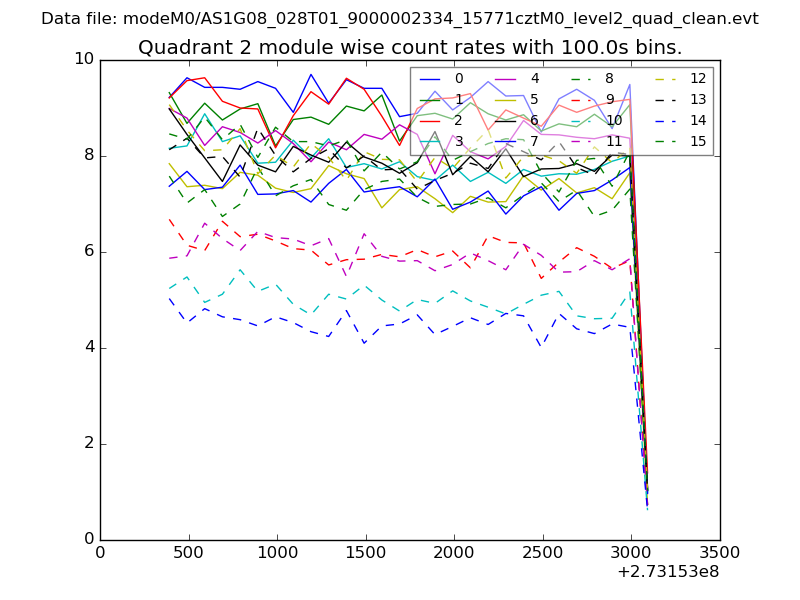
| Module-wise count rates for Quadrant B Data is divided into 100 sec bins |
 |
 |
| Module-wise count rates for Quadrant C Data is divided into 100 sec bins |
 |
 |
| Module-wise count rates for Quadrant D Data is divided into 100 sec bins |
 |
 |
| Parameter | Plot |
|---|---|
| CZT HV Monitor | 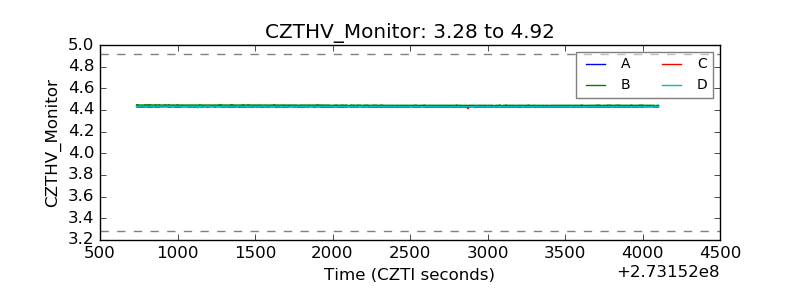 |
| D_VDD | 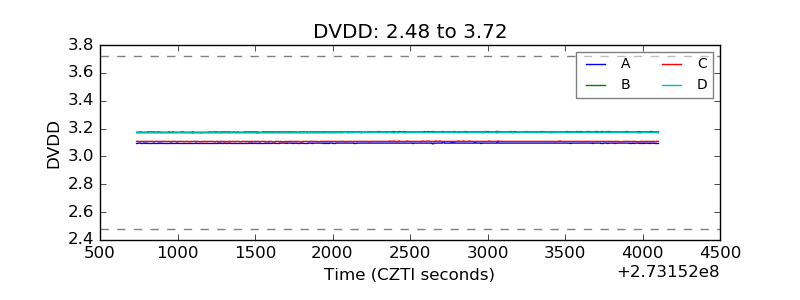 |
| Temperature 1 | 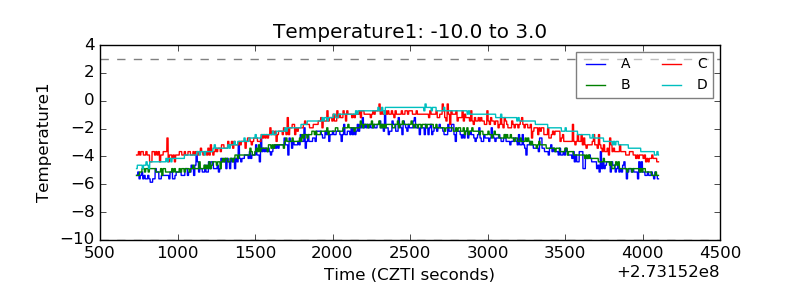 |
| Veto HV Monitor | 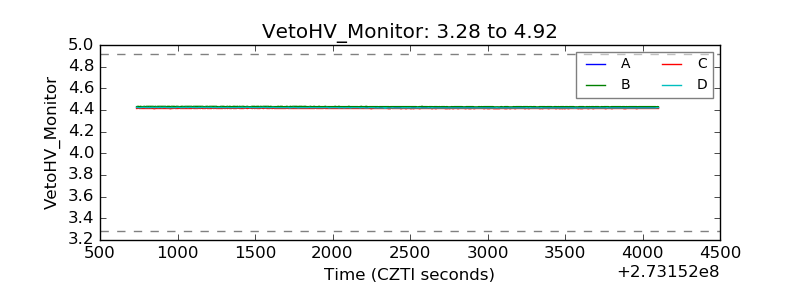 |
| Veto LLD | 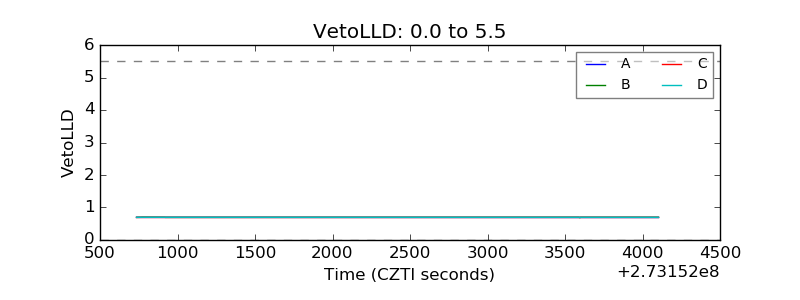 |
| Alpha Counter | 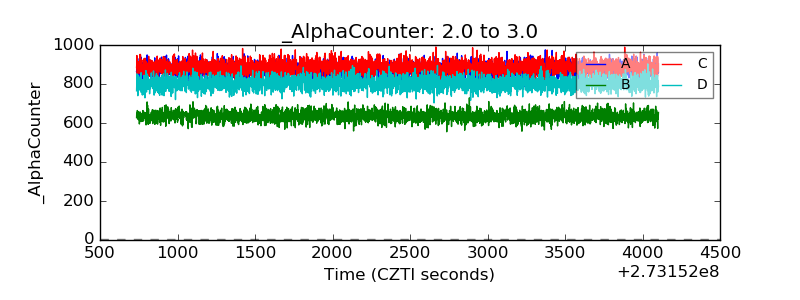 |
| _CPM_Rate | 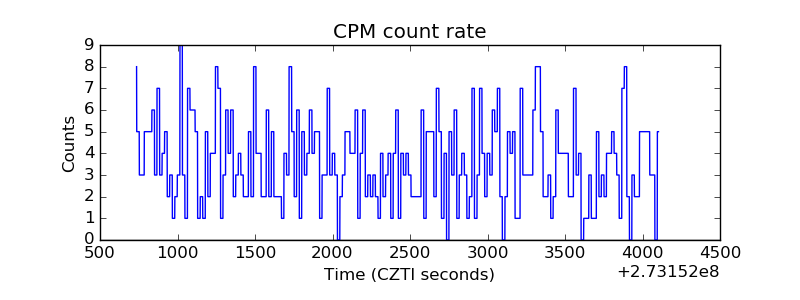 |
| CZT Counter |  |
| +2.5 Volts monitor |  |
| +5 Volts monitor |  |
| _ROLL_ROT | 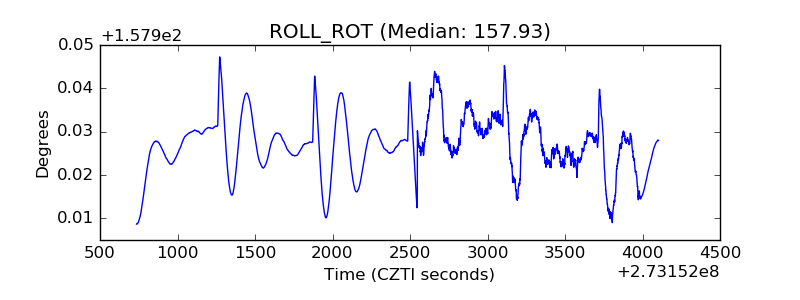 |
| _Roll_DEC | 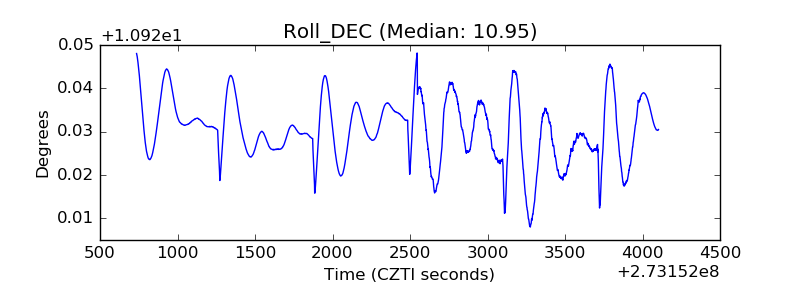 |
| _Roll_RA | 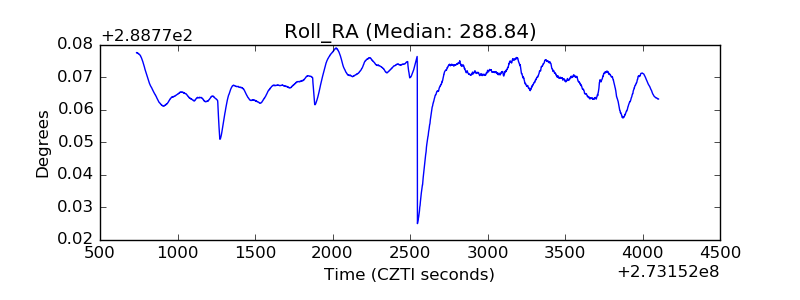 |
| Veto Counter | 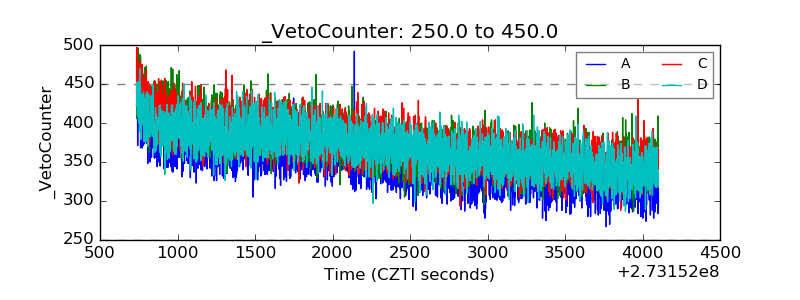 |