| Param | Original file | Final file |
|---|---|---|
| Filename | modeM0/AS1T02_058T01_9000002338_15797cztM0_level2.evt | modeM0/AS1T02_058T01_9000002338_15797cztM0_level2_quad_clean.evt |
| Size (bytes) | 180,270,720 | 46,376,640 |
| Size | 171.9 MB | 44.2 MB |
| Events in quadrant A | 1,270,268 | 307,369 |
| Events in quadrant B | 1,320,964 | 312,814 |
| Events in quadrant C | 1,468,040 | 300,082 |
| Events in quadrant D | 1,219,473 | 295,788 |
| Mode SS | |||
|---|---|---|---|
| Quadrant | BADHDUFLAG | Total packets | Discarded packets |
| A | 0 | 56 | 0 |
| B | 0 | 56 | 0 |
| C | 0 | 56 | 0 |
| D | 0 | 56 | 0 |
| Mode M9 | |||
|---|---|---|---|
| Quadrant | BADHDUFLAG | Total packets | Discarded packets |
| A | 0 | 3 | 0 |
| B | 0 | 3 | 0 |
| C | 0 | 3 | 0 |
| D | 0 | 3 | 0 |
| Mode M0 | |||
|---|---|---|---|
| Quadrant | BADHDUFLAG | Total packets | Discarded packets |
| A | 0 | 5431 | 3 |
| B | 0 | 5506 | 2 |
| C | 0 | 5980 | 2 |
| D | 0 | 5434 | 2 |
| Quadrant | Total seconds | Saturated seconds | Saturation percentage |
|---|---|---|---|
| A | 2618 | 83 | 3.170359% |
| B | 2618 | 73 | 2.788388% |
| C | 2618 | 93 | 3.552330% |
| D | 2618 | 64 | 2.444614% |
Noise dominated data is calculated using 1-second bins in cleaned event files. If a bin has >2000 counts, and if more than 50% of those come from <1% of pixels, then it is considered to be noise-dominated and hence unusable.
| Quadrant | # 1 sec bins | Bins with >0 counts | Bins with >2000 counts | High rate bins dominated by noise | Noise dominated (total time) | Noise dominated (detector-on time) | Marked lightcurve |
|---|---|---|---|---|---|---|---|
| A | 2979 | 2621 | 0 | 0 | 0.00% | 0.00% | 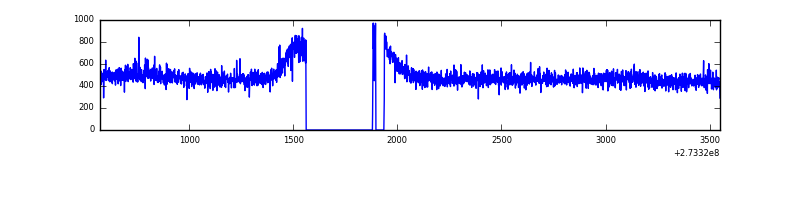 |
| B | 2979 | 2621 | 0 | 0 | 0.00% | 0.00% | 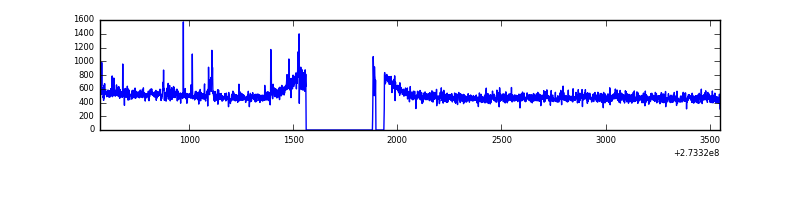 |
| C | 2979 | 2621 | 0 | 0 | 0.00% | 0.00% | 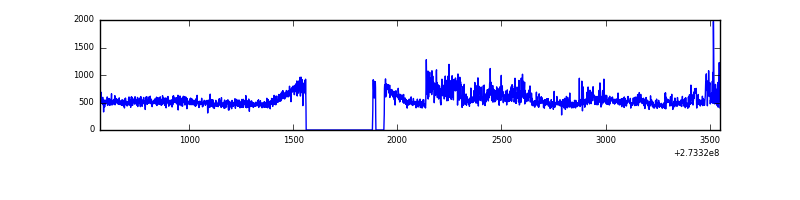 |
| D | 2979 | 2621 | 1 | 1 | 0.03% | 0.04% | 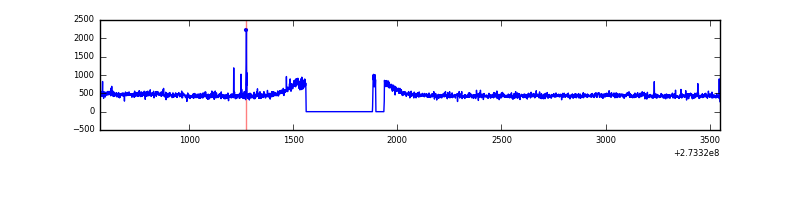 |
Top three noisy pixels from each quadrant. If the there are fewer than three noisy pixels in the level2.evt file, extra rows are filled as -1
| Pixel properties | Quadrant properties | ||||||
|---|---|---|---|---|---|---|---|
| Quadrant | DetID | PixID | Counts | Sigma | Mean | Median | Sigma |
| A | 0 | 226 | 2914 | 36.99 | 329 | 323 | 70.0 |
| A | 12 | 194 | 2435 | 30.15 | 329 | 323 | 70.0 |
| A | 3 | 137 | 2301 | 28.24 | 329 | 323 | 70.0 |
| B | 0 | 189 | 11125 | 163.07 | 329 | 321 | 66.3 |
| B | 4 | 173 | 10386 | 151.92 | 329 | 321 | 66.3 |
| B | 12 | 111 | 7599 | 109.85 | 329 | 321 | 66.3 |
| C | 7 | 247 | 189666 | 2506.25 | 314 | 317 | 75.6 |
| C | 14 | 238 | 48254 | 634.5 | 314 | 317 | 75.6 |
| C | 13 | 61 | 2197 | 24.88 | 314 | 317 | 75.6 |
| D | 2 | 234 | 10257 | 114.96 | 318 | 310 | 86.5 |
| D | 2 | 120 | 7541 | 83.57 | 318 | 310 | 86.5 |
| D | 12 | 221 | 3551 | 37.46 | 318 | 310 | 86.5 |
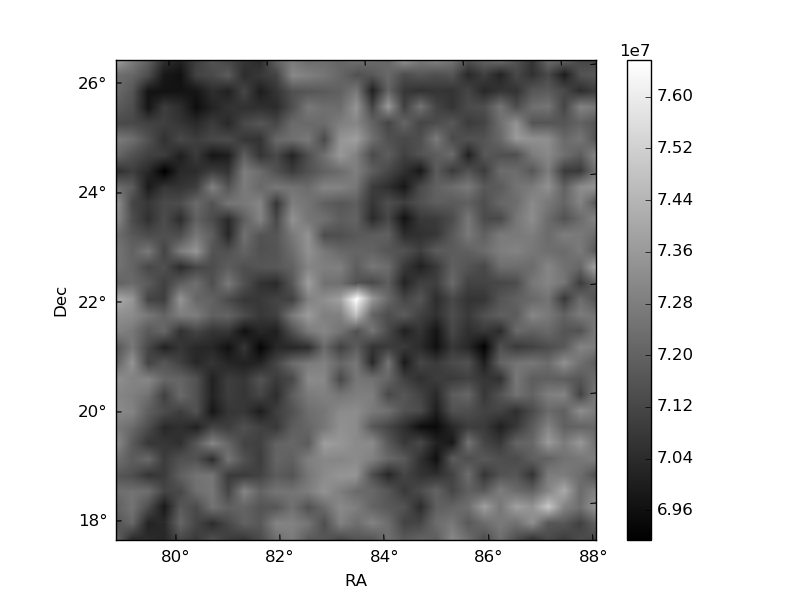
Histogram calculated using DETX and DETY for each event in the final _common_clean file
| Quadrant A | 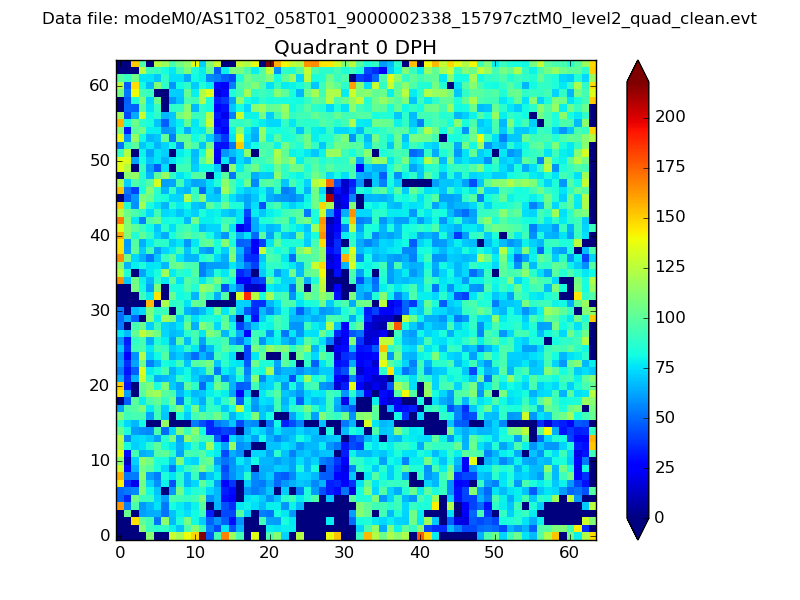 |
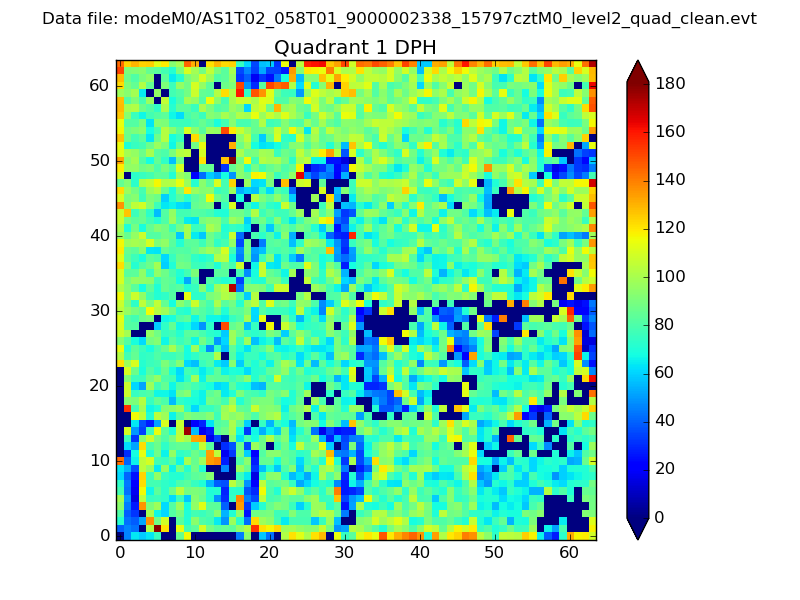 |
Quadrant B |
|---|---|---|---|
| Quadrant D | 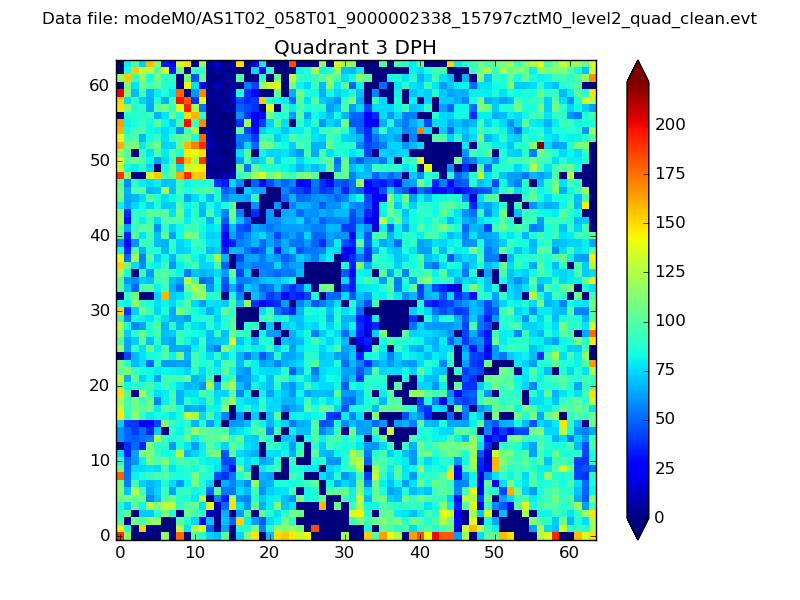 |
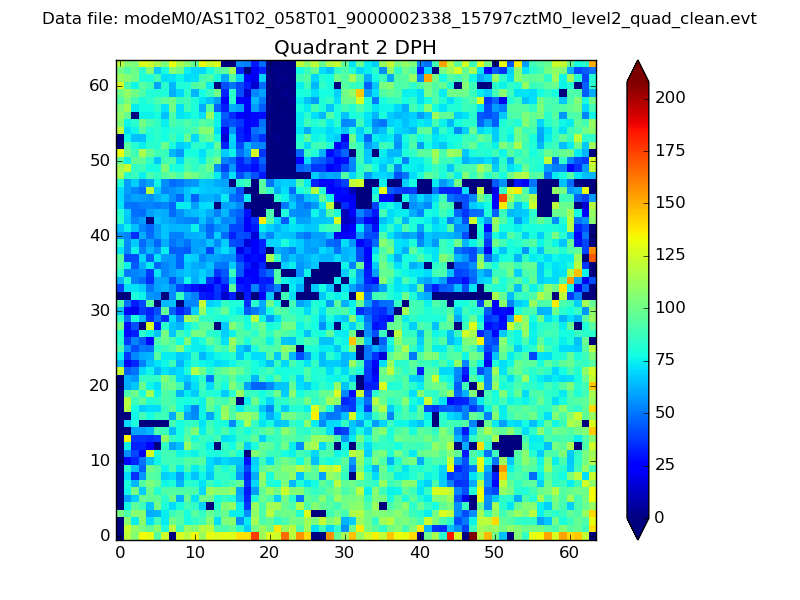 |
Quadrant C |
| Plot type | Count rate plots | Images |
|---|---|---|
| Comparison with Poisson distribution Blue bars denote a histogram of data divided into 1 sec bins. Red curve is a Poisson curve with rate = median count rate of data. |
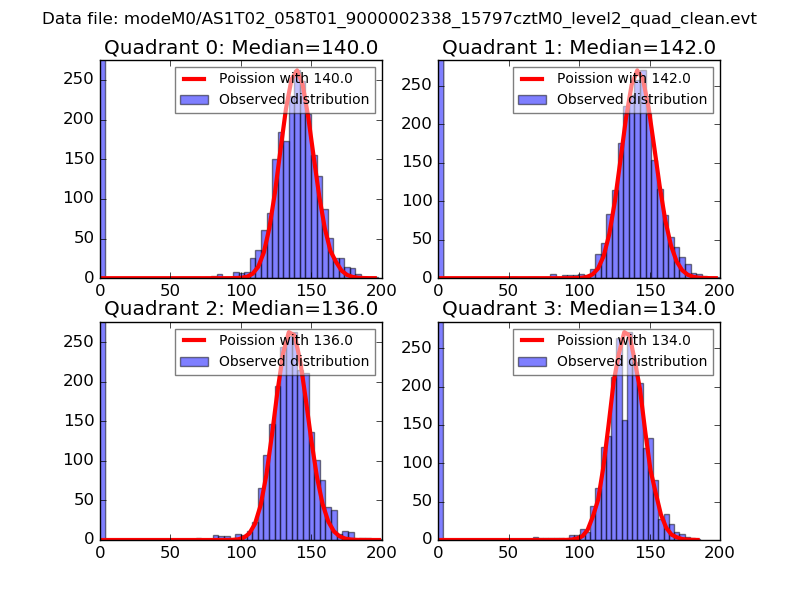 |
 |
| Quadrant-wise count rates Data is divided into 100 sec bins |
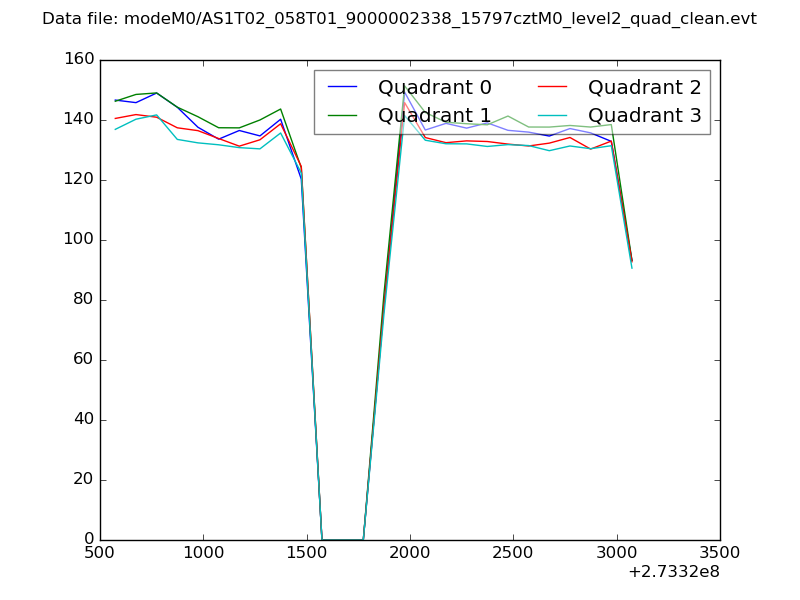 |
|
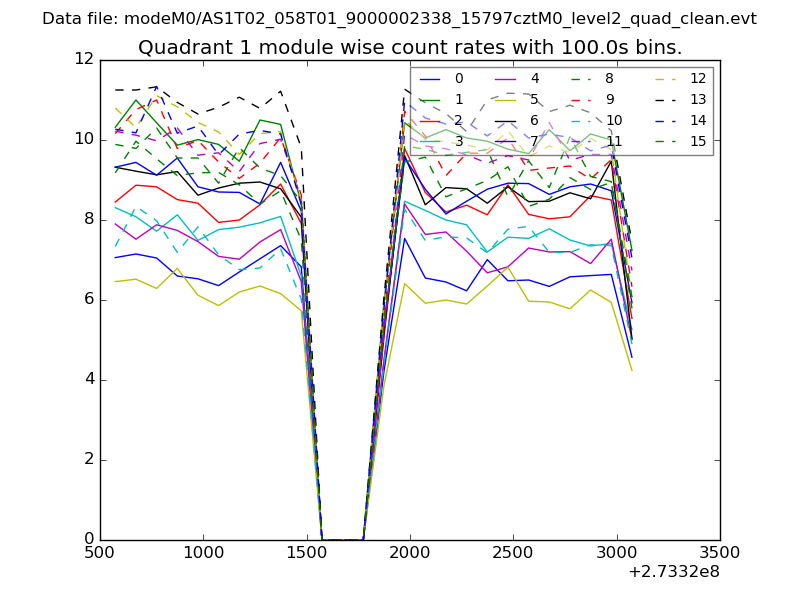
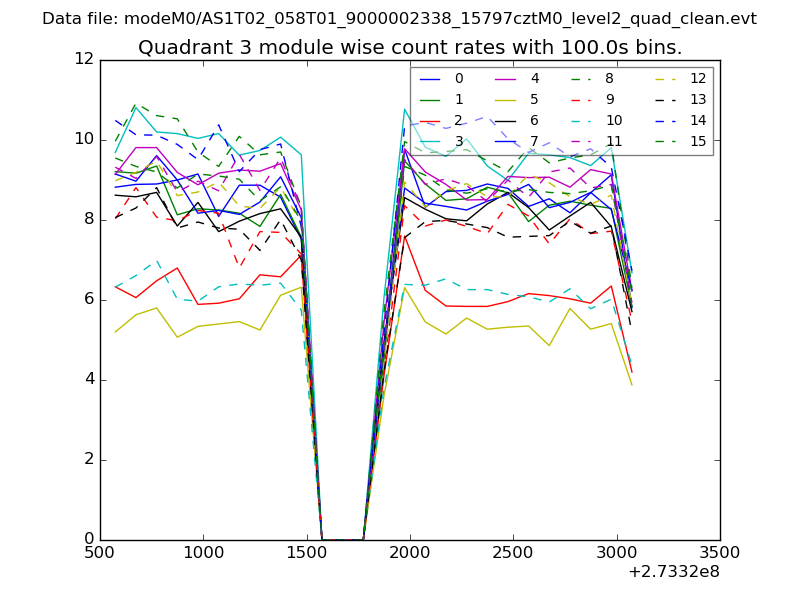
| Module-wise count rates for Quadrant A Data is divided into 100 sec bins |
 |
 |
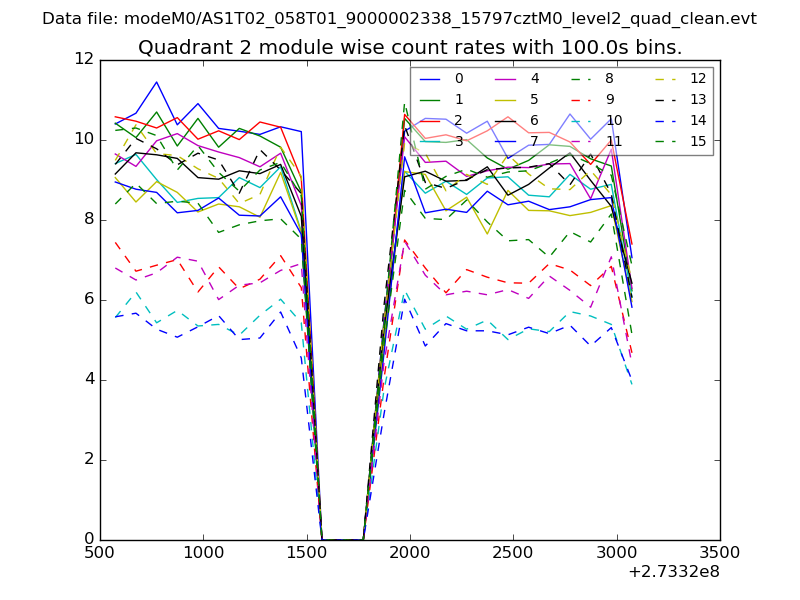
| Module-wise count rates for Quadrant B Data is divided into 100 sec bins |
 |
 |
| Module-wise count rates for Quadrant C Data is divided into 100 sec bins |
 |
 |
| Module-wise count rates for Quadrant D Data is divided into 100 sec bins |
 |
 |
| Parameter | Plot |
|---|---|
| CZT HV Monitor | 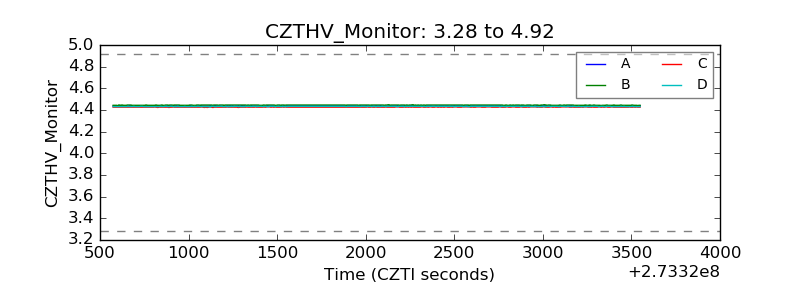 |
| D_VDD | 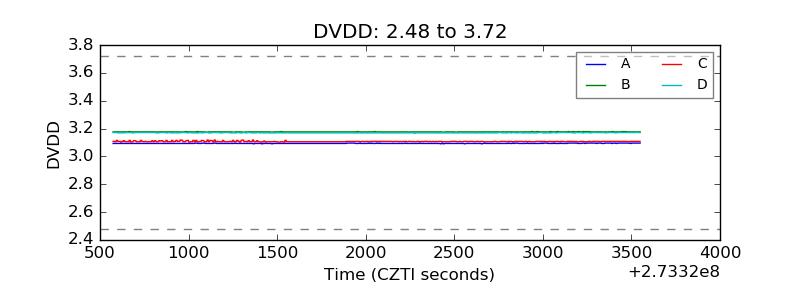 |
| Temperature 1 | 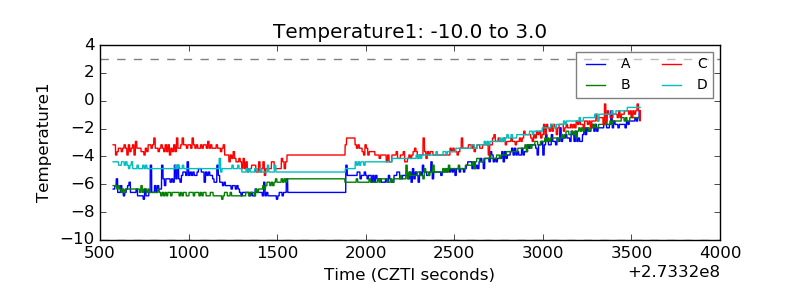 |
| Veto HV Monitor | 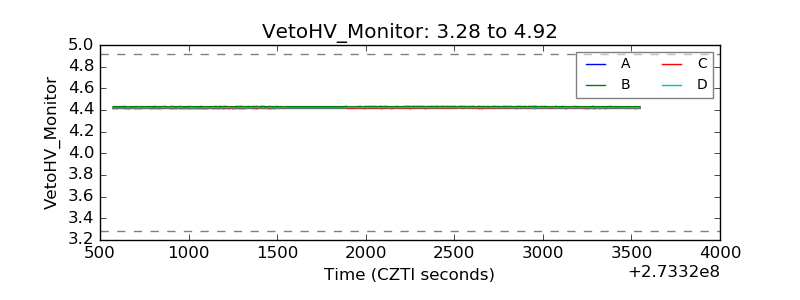 |
| Veto LLD | 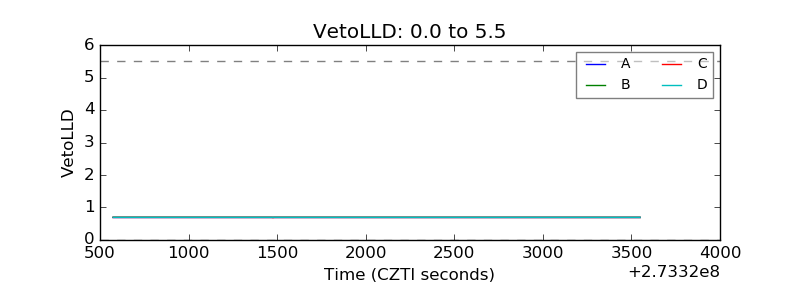 |
| Alpha Counter | 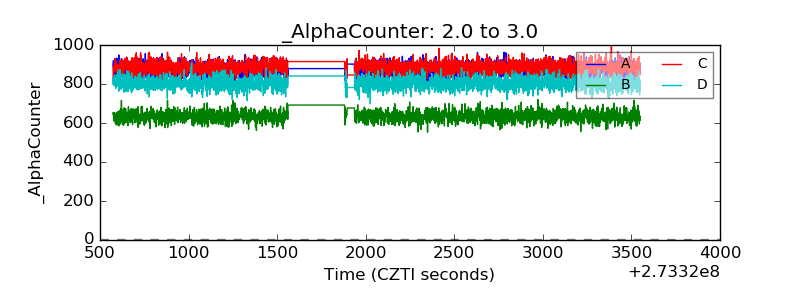 |
| _CPM_Rate | 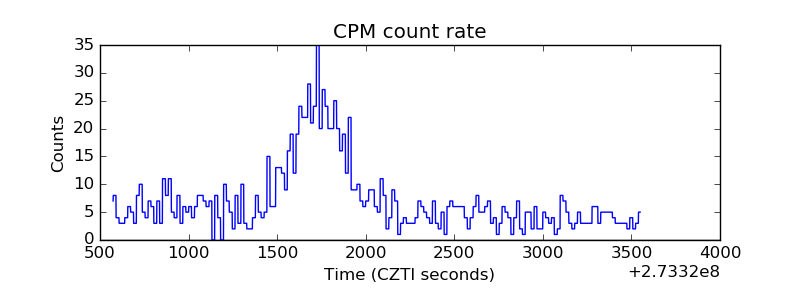 |
| CZT Counter | 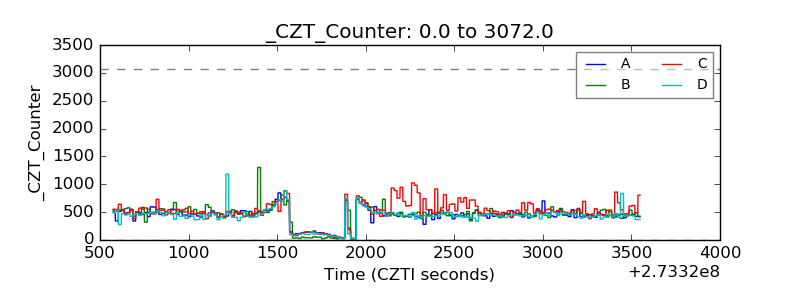 |
| +2.5 Volts monitor | 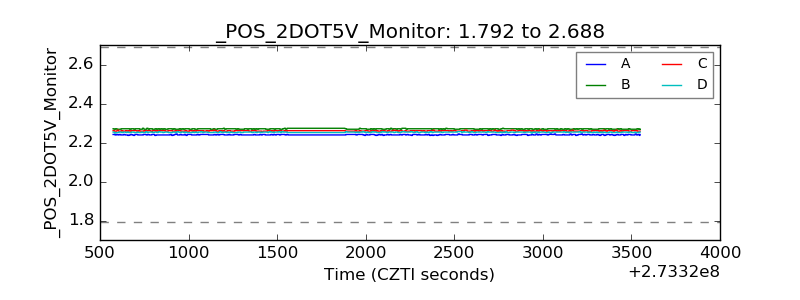 |
| +5 Volts monitor |  |
| _ROLL_ROT | 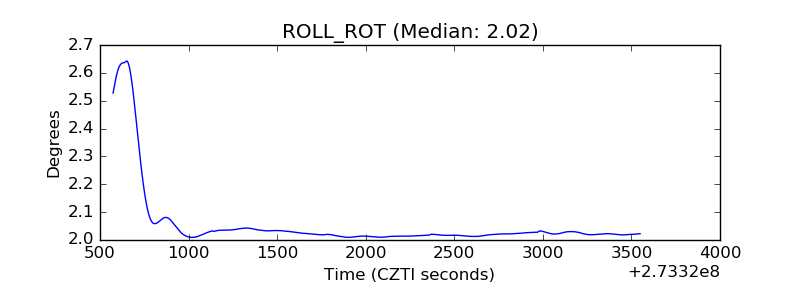 |
| _Roll_DEC | 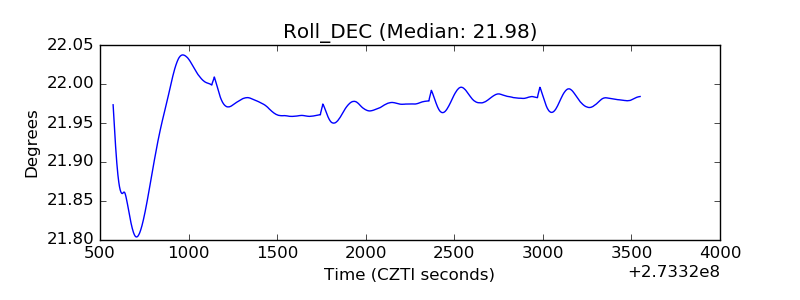 |
| _Roll_RA | 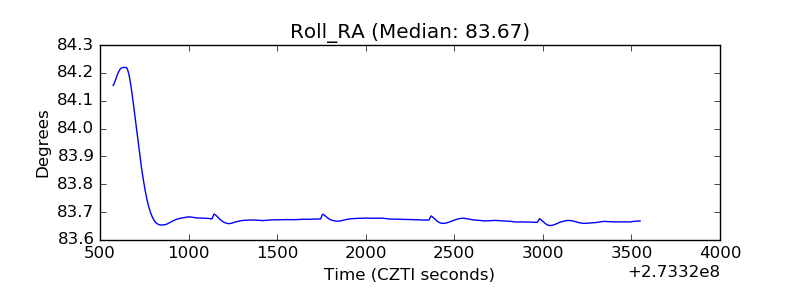 |
| Veto Counter | 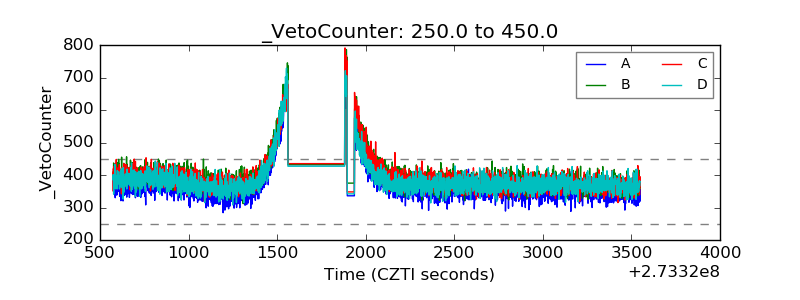 |