| Param | Original file | Final file |
|---|---|---|
| Filename | modeM0/AS1T02_058T01_9000002338_15799cztM0_level2.evt | modeM0/AS1T02_058T01_9000002338_15799cztM0_level2_quad_clean.evt |
| Size (bytes) | 408,939,840 | 78,189,120 |
| Size | 390.0 MB | 74.6 MB |
| Events in quadrant A | 3,214,068 | 494,292 |
| Events in quadrant B | 3,144,318 | 500,923 |
| Events in quadrant C | 2,938,787 | 473,934 |
| Events in quadrant D | 2,690,434 | 491,193 |
| Mode SS | |||
|---|---|---|---|
| Quadrant | BADHDUFLAG | Total packets | Discarded packets |
| A | 0 | 136 | 14 |
| B | 0 | 136 | 20 |
| C | 0 | 136 | 20 |
| D | 0 | 136 | 8 |
| Mode M9 | |||
|---|---|---|---|
| Quadrant | BADHDUFLAG | Total packets | Discarded packets |
| A | 0 | 5 | 0 |
| B | 0 | 5 | 0 |
| C | 0 | 5 | 0 |
| D | 0 | 5 | 0 |
| Mode M0 | |||
|---|---|---|---|
| Quadrant | BADHDUFLAG | Total packets | Discarded packets |
| A | 0 | 15037 | 1827 |
| B | 0 | 14603 | 1811 |
| C | 0 | 14344 | 2159 |
| D | 0 | 13634 | 1678 |
| Quadrant | Total seconds | Saturated seconds | Saturation percentage |
|---|---|---|---|
| A | 5832 | 245 | 4.200960% |
| B | 5832 | 91 | 1.560357% |
| C | 5749 | 89 | 1.548095% |
| D | 5851 | 57 | 0.974192% |
Noise dominated data is calculated using 1-second bins in cleaned event files. If a bin has >2000 counts, and if more than 50% of those come from <1% of pixels, then it is considered to be noise-dominated and hence unusable.
| Quadrant | # 1 sec bins | Bins with >0 counts | Bins with >2000 counts | High rate bins dominated by noise | Noise dominated (total time) | Noise dominated (detector-on time) | Marked lightcurve |
|---|---|---|---|---|---|---|---|
| A | 7225 | 6253 | 128 | 128 | 1.77% | 2.05% | 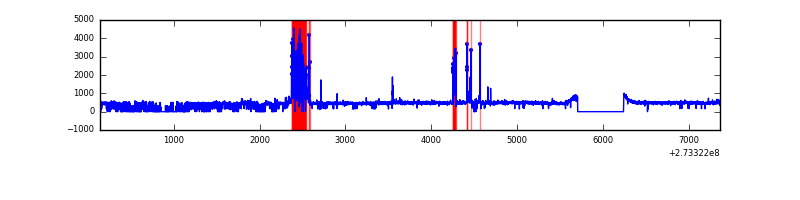 |
| B | 7225 | 6266 | 9 | 9 | 0.12% | 0.14% | 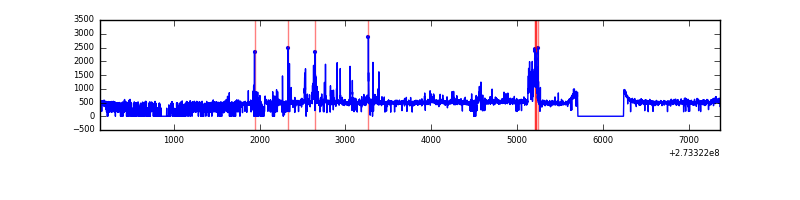 |
| C | 7225 | 6185 | 0 | 0 | 0.00% | 0.00% | 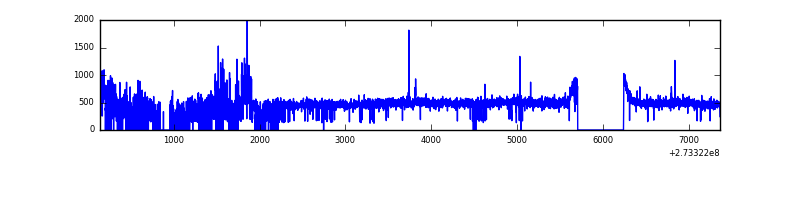 |
| D | 7225 | 6274 | 1 | 1 | 0.01% | 0.02% | 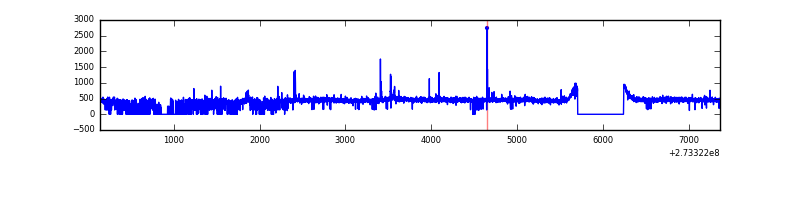 |
Top three noisy pixels from each quadrant. If the there are fewer than three noisy pixels in the level2.evt file, extra rows are filled as -1
| Pixel properties | Quadrant properties | ||||||
|---|---|---|---|---|---|---|---|
| Quadrant | DetID | PixID | Counts | Sigma | Mean | Median | Sigma |
| A | 15 | 239 | 478344 | 3277.62 | 705 | 690 | 145.7 |
| A | 14 | 254 | 24478 | 163.23 | 705 | 690 | 145.7 |
| A | 0 | 226 | 6235 | 38.05 | 705 | 690 | 145.7 |
| B | 10 | 245 | 148126 | 1041.79 | 715 | 697 | 141.5 |
| B | 7 | 220 | 59622 | 416.39 | 715 | 697 | 141.5 |
| B | 3 | 209 | 30974 | 213.95 | 715 | 697 | 141.5 |
| C | 7 | 247 | 183760 | 1140.81 | 677 | 684 | 160.5 |
| C | 14 | 238 | 103003 | 637.59 | 677 | 684 | 160.5 |
| C | 10 | 22 | 12406 | 73.04 | 677 | 684 | 160.5 |
| D | 2 | 234 | 26673 | 138.44 | 690 | 675 | 187.8 |
| D | 12 | 221 | 18012 | 92.32 | 690 | 675 | 187.8 |
| D | 2 | 152 | 13001 | 65.64 | 690 | 675 | 187.8 |
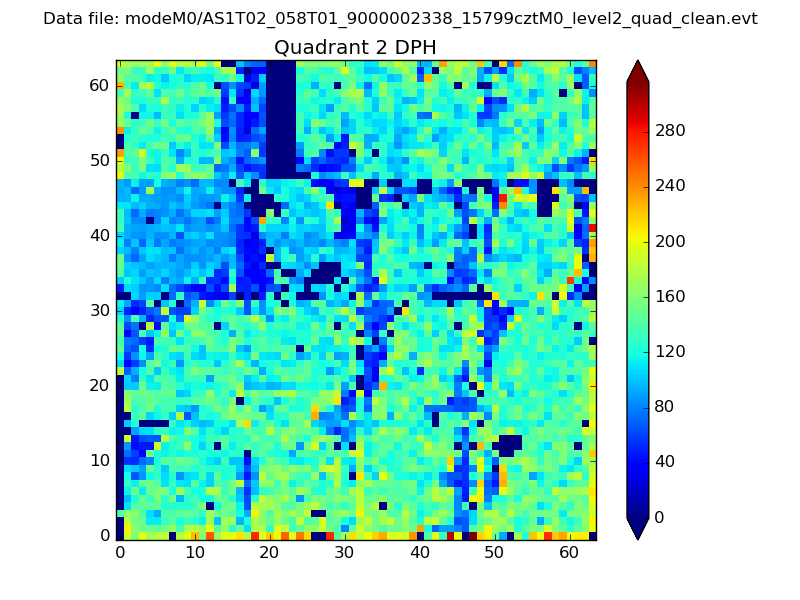
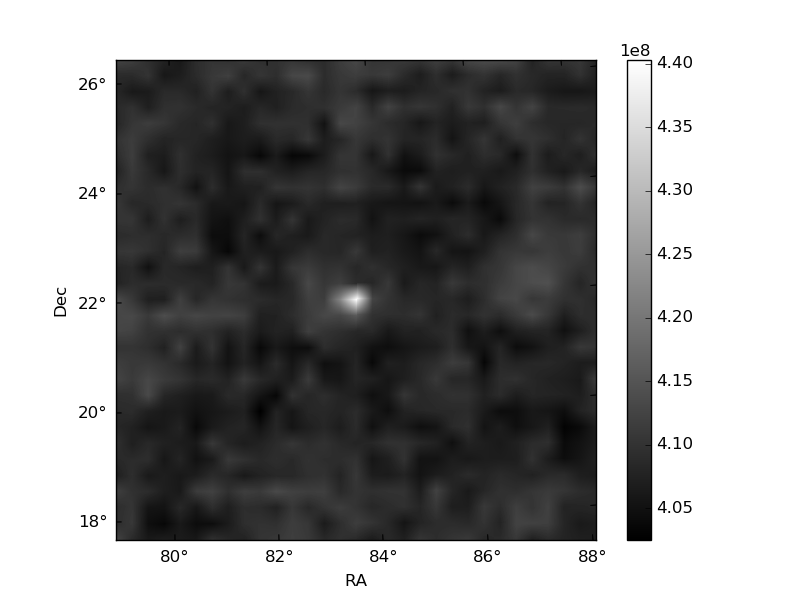
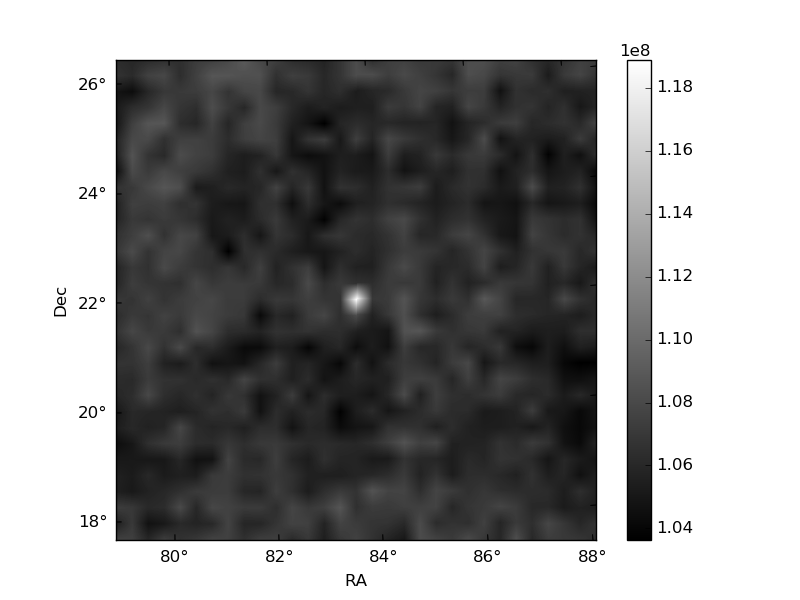
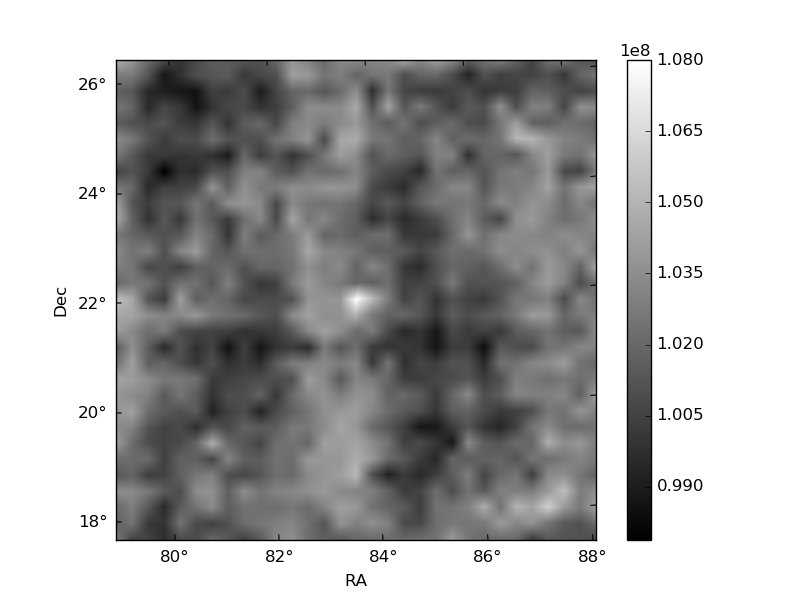
Histogram calculated using DETX and DETY for each event in the final _common_clean file
| Quadrant A | 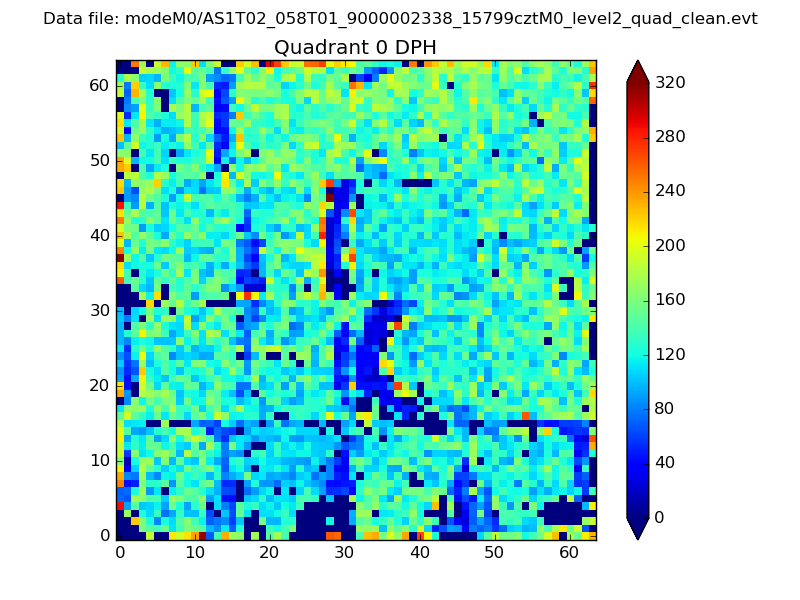 |
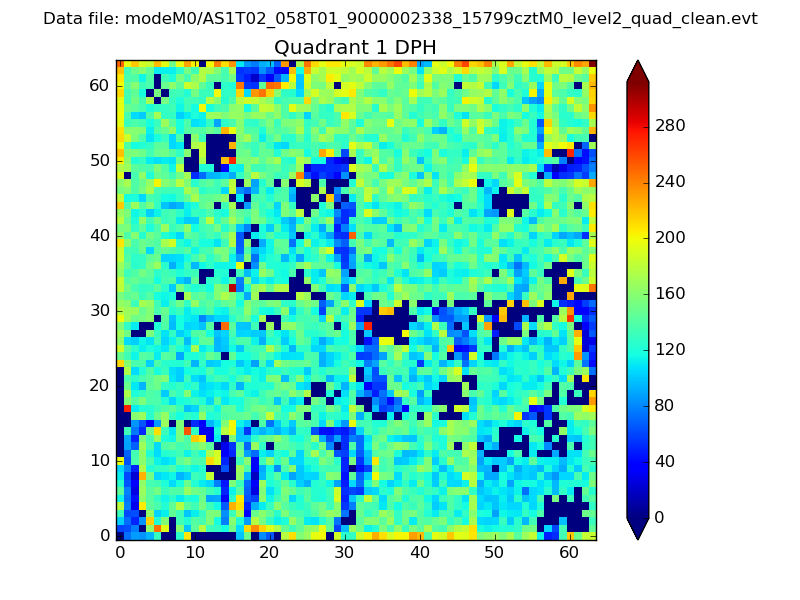 |
Quadrant B |
|---|---|---|---|
| Quadrant D | 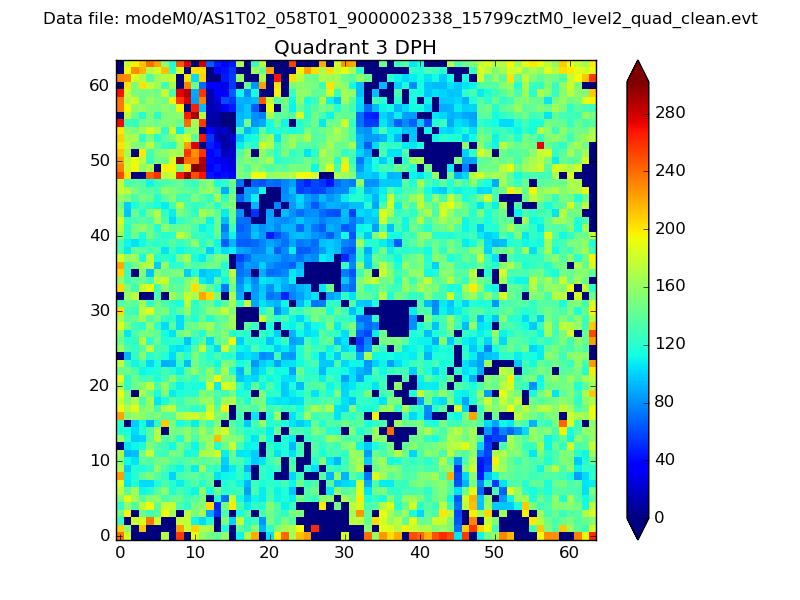 |
 |
Quadrant C |
| Plot type | Count rate plots | Images |
|---|---|---|
| Comparison with Poisson distribution Blue bars denote a histogram of data divided into 1 sec bins. Red curve is a Poisson curve with rate = median count rate of data. |
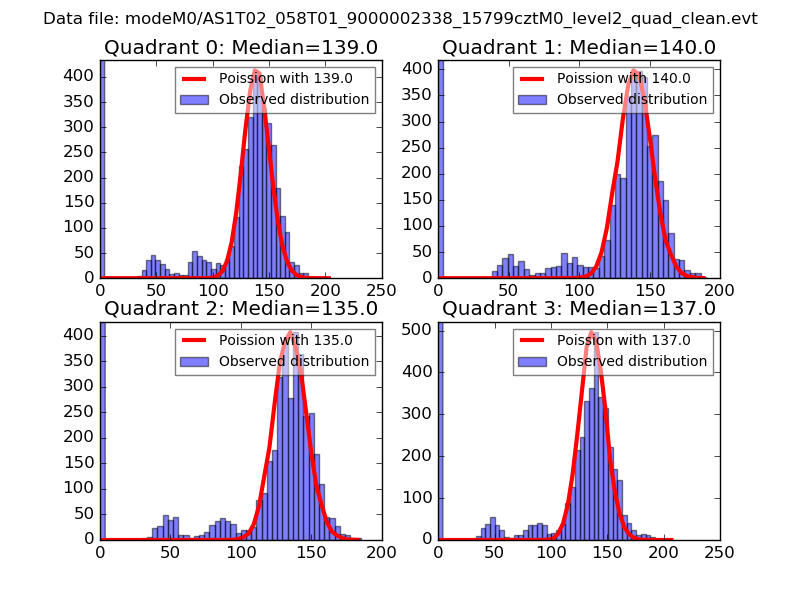 |
 |
| Quadrant-wise count rates Data is divided into 100 sec bins |
 |
|
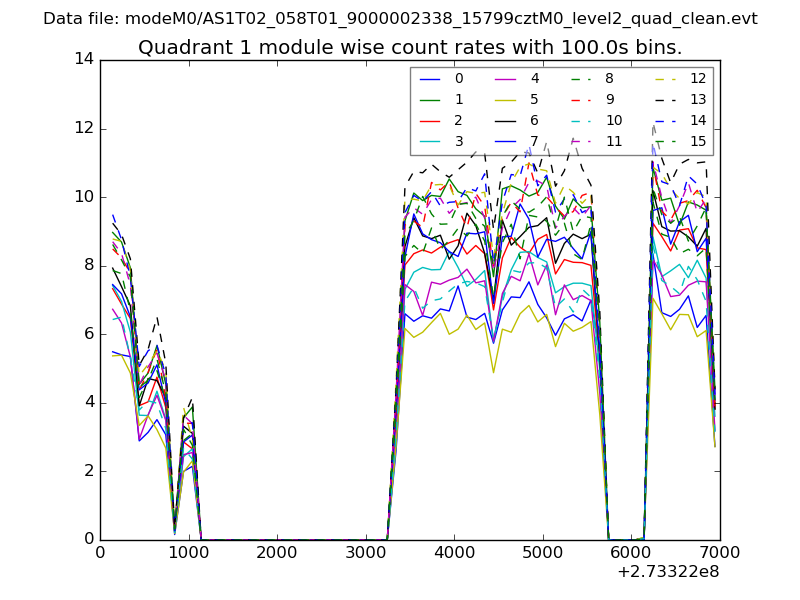
| Module-wise count rates for Quadrant A Data is divided into 100 sec bins |
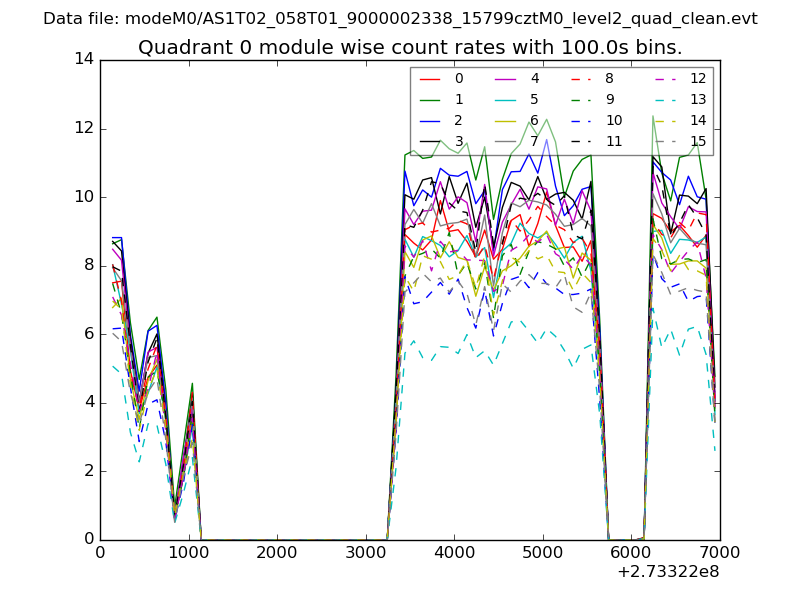 |
 |
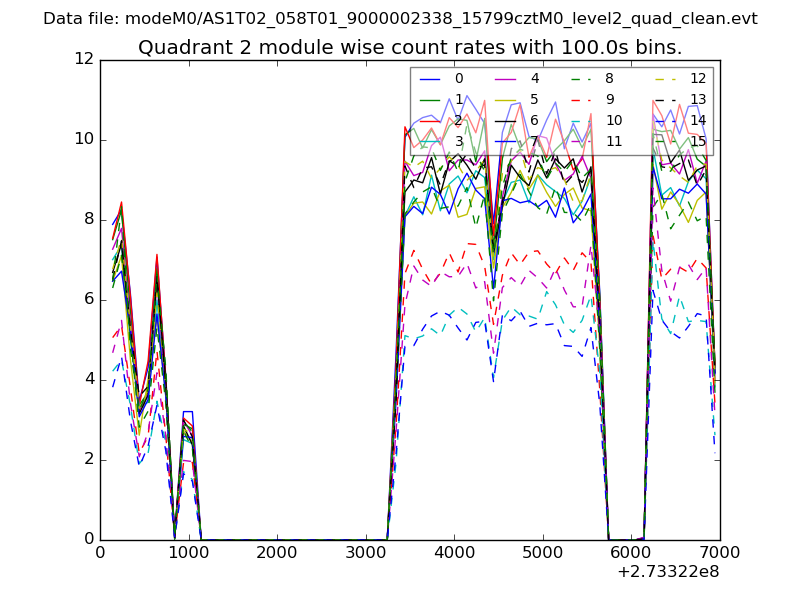
| Module-wise count rates for Quadrant B Data is divided into 100 sec bins |
 |
 |
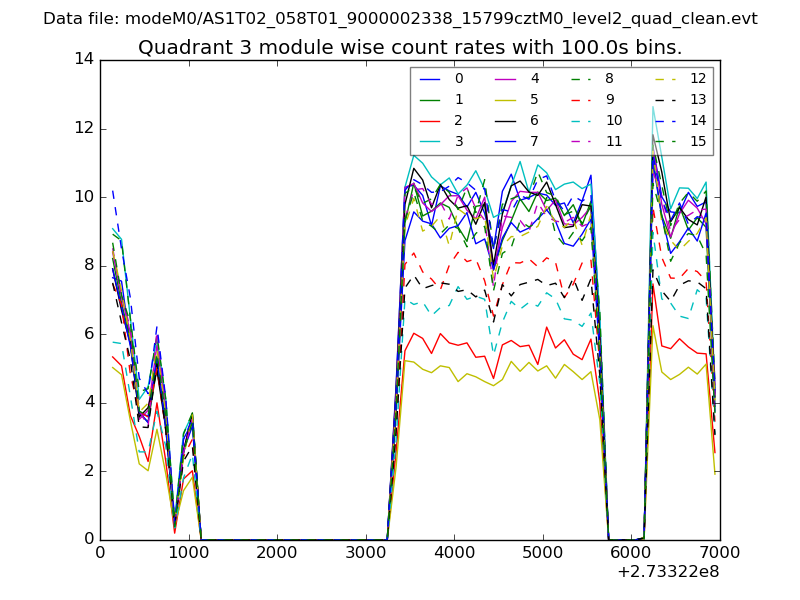
| Module-wise count rates for Quadrant C Data is divided into 100 sec bins |
 |
 |
| Module-wise count rates for Quadrant D Data is divided into 100 sec bins |
 |
 |
| Parameter | Plot |
|---|---|
| CZT HV Monitor | 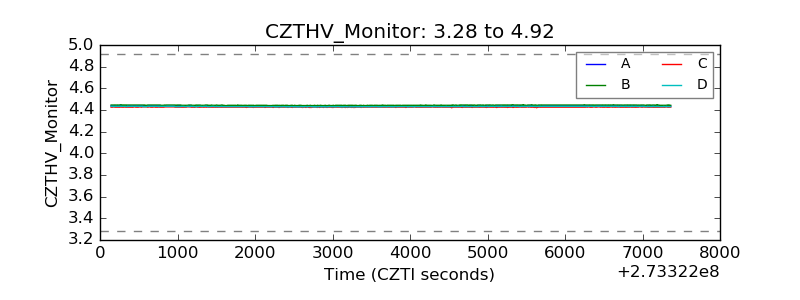 |
| D_VDD | 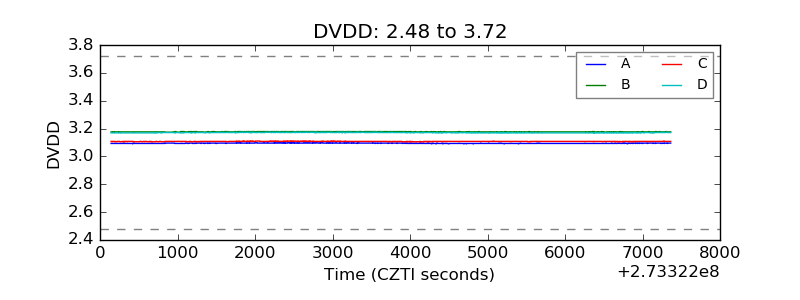 |
| Temperature 1 | 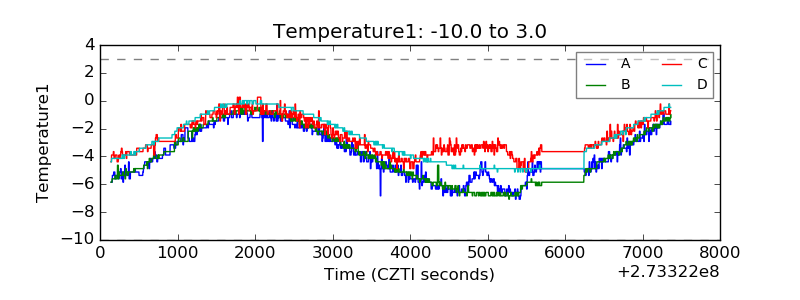 |
| Veto HV Monitor | 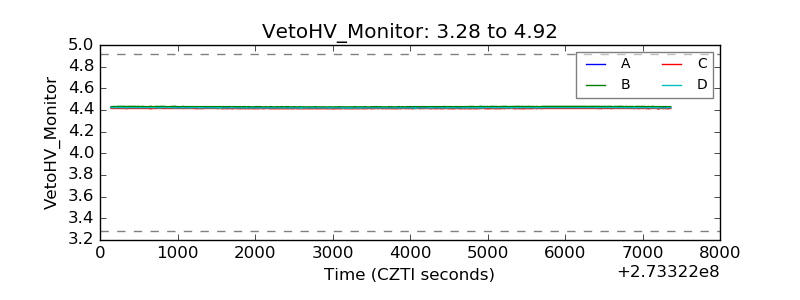 |
| Veto LLD | 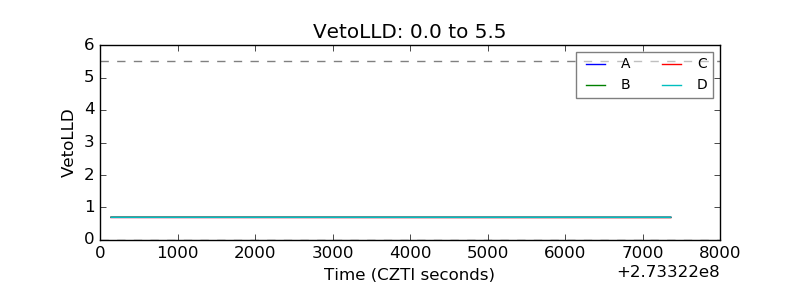 |
| Alpha Counter | 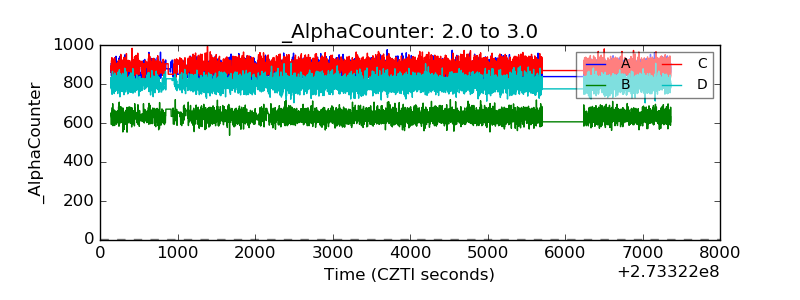 |
| _CPM_Rate |  |
| CZT Counter | 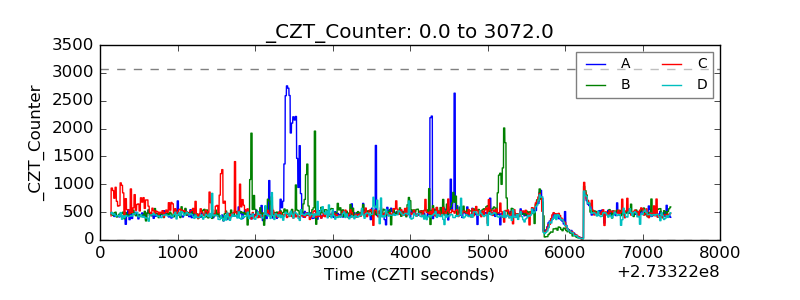 |
| +2.5 Volts monitor |  |
| +5 Volts monitor |  |
| _ROLL_ROT | 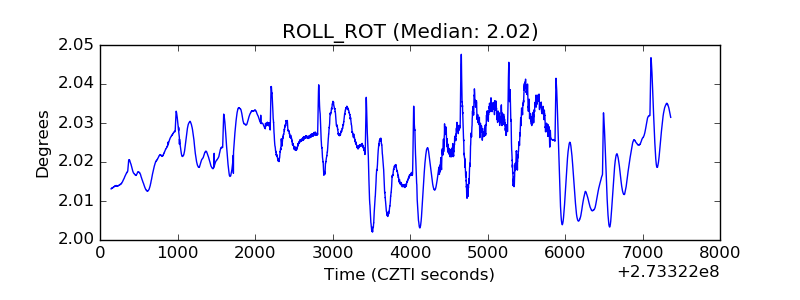 |
| _Roll_DEC | 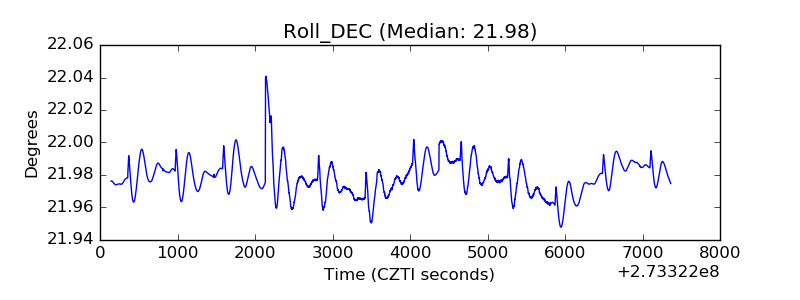 |
| _Roll_RA | 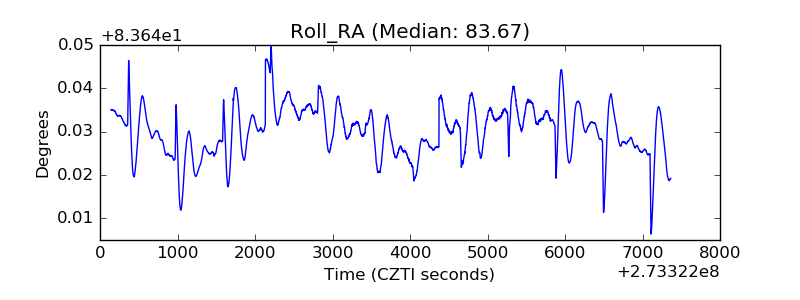 |
| Veto Counter | 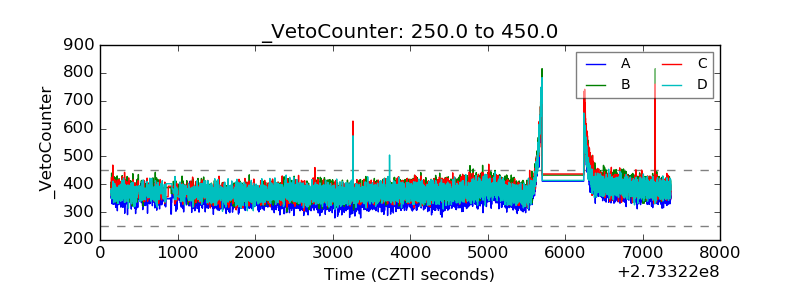 |