| Param | Original file | Final file |
|---|---|---|
| Filename | modeM0/AS1T02_058T01_9000002338_15800cztM0_level2.evt | modeM0/AS1T02_058T01_9000002338_15800cztM0_level2_quad_clean.evt |
| Size (bytes) | 1,225,045,440 | 205,663,680 |
| Size | 1.1 GB | 196.1 MB |
| Events in quadrant A | 9,619,257 | 1,272,763 |
| Events in quadrant B | 9,448,764 | 1,291,495 |
| Events in quadrant C | 8,623,761 | 1,240,284 |
| Events in quadrant D | 8,229,246 | 1,221,499 |
| Mode SS | |||
|---|---|---|---|
| Quadrant | BADHDUFLAG | Total packets | Discarded packets |
| A | 0 | 356 | 0 |
| B | 0 | 356 | 0 |
| C | 0 | 356 | 0 |
| D | 0 | 356 | 0 |
| Mode M9 | |||
|---|---|---|---|
| Quadrant | BADHDUFLAG | Total packets | Discarded packets |
| A | 0 | 21 | 0 |
| B | 0 | 21 | 0 |
| C | 0 | 21 | 0 |
| D | 0 | 21 | 0 |
| Mode M0 | |||
|---|---|---|---|
| Quadrant | BADHDUFLAG | Total packets | Discarded packets |
| A | 0 | 39519 | 6 |
| B | 0 | 38504 | 3 |
| C | 0 | 36140 | 3 |
| D | 0 | 36080 | 3 |
| Quadrant | Total seconds | Saturated seconds | Saturation percentage |
|---|---|---|---|
| A | 17440 | 551 | 3.159404% |
| B | 17441 | 259 | 1.485007% |
| C | 17441 | 217 | 1.244195% |
| D | 17441 | 155 | 0.888711% |
Noise dominated data is calculated using 1-second bins in cleaned event files. If a bin has >2000 counts, and if more than 50% of those come from <1% of pixels, then it is considered to be noise-dominated and hence unusable.
| Quadrant | # 1 sec bins | Bins with >0 counts | Bins with >2000 counts | High rate bins dominated by noise | Noise dominated (total time) | Noise dominated (detector-on time) | Marked lightcurve |
|---|---|---|---|---|---|---|---|
| A | 19602 | 17445 | 284 | 284 | 1.45% | 1.63% | 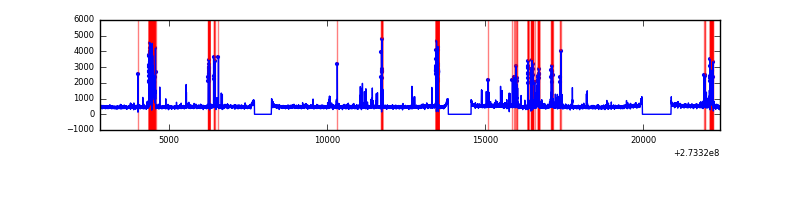 |
| B | 19602 | 17445 | 35 | 35 | 0.18% | 0.20% | 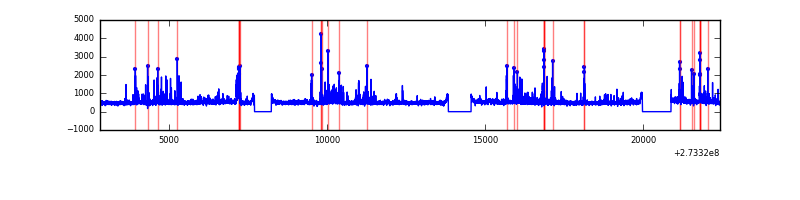 |
| C | 19602 | 17445 | 3 | 3 | 0.02% | 0.02% | 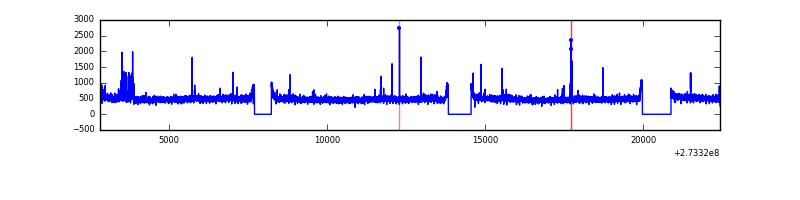 |
| D | 19602 | 17445 | 8 | 8 | 0.04% | 0.05% | 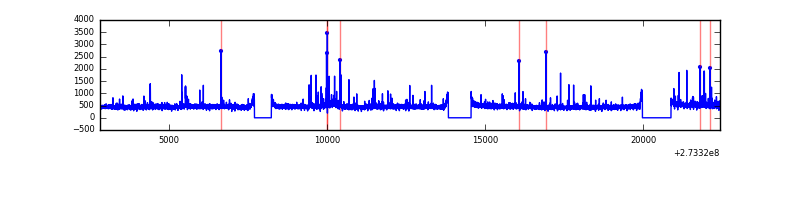 |
Top three noisy pixels from each quadrant. If the there are fewer than three noisy pixels in the level2.evt file, extra rows are filled as -1
| Pixel properties | Quadrant properties | ||||||
|---|---|---|---|---|---|---|---|
| Quadrant | DetID | PixID | Counts | Sigma | Mean | Median | Sigma |
| A | 15 | 239 | 1257257 | 2922.5 | 2120 | 2075 | 429.5 |
| A | 14 | 254 | 172763 | 397.42 | 2120 | 2075 | 429.5 |
| A | 0 | 226 | 18626 | 38.54 | 2120 | 2075 | 429.5 |
| B | 7 | 220 | 354946 | 858.26 | 2147 | 2095 | 411.1 |
| B | 10 | 245 | 192886 | 464.07 | 2147 | 2095 | 411.1 |
| B | 0 | 229 | 90104 | 214.07 | 2147 | 2095 | 411.1 |
| C | 14 | 238 | 312970 | 644.53 | 2059 | 2078 | 482.4 |
| C | 7 | 247 | 218810 | 449.32 | 2059 | 2078 | 482.4 |
| C | 10 | 22 | 42531 | 83.87 | 2059 | 2078 | 482.4 |
| D | 1 | 52 | 92526 | 160.29 | 2069 | 2029 | 564.6 |
| D | 2 | 234 | 79712 | 137.59 | 2069 | 2029 | 564.6 |
| D | 2 | 152 | 67848 | 116.58 | 2069 | 2029 | 564.6 |
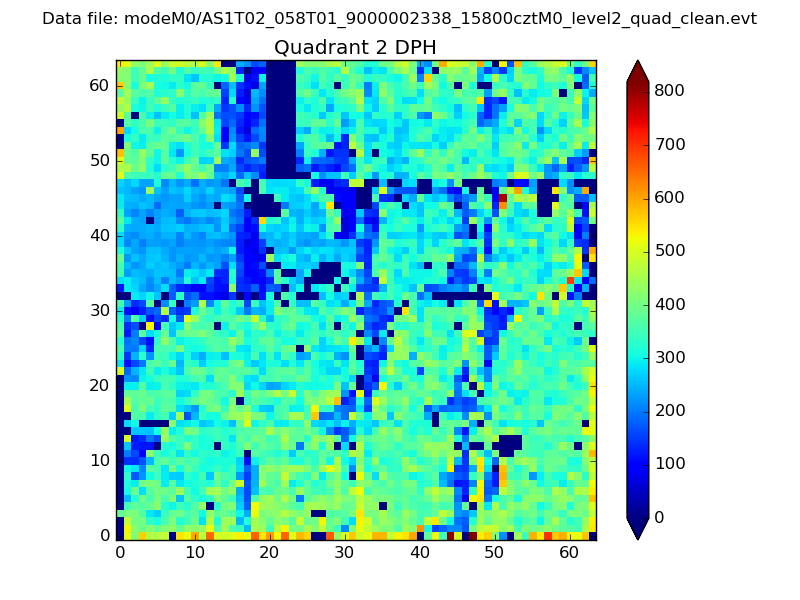
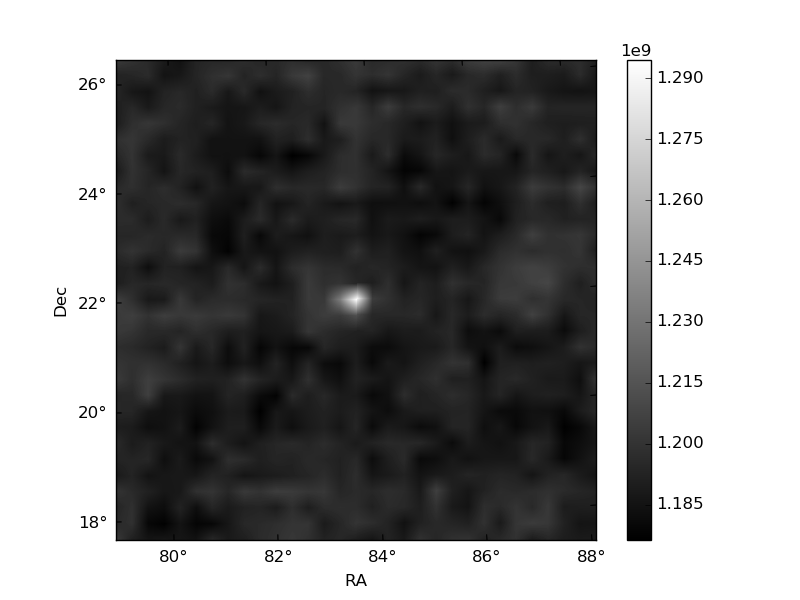
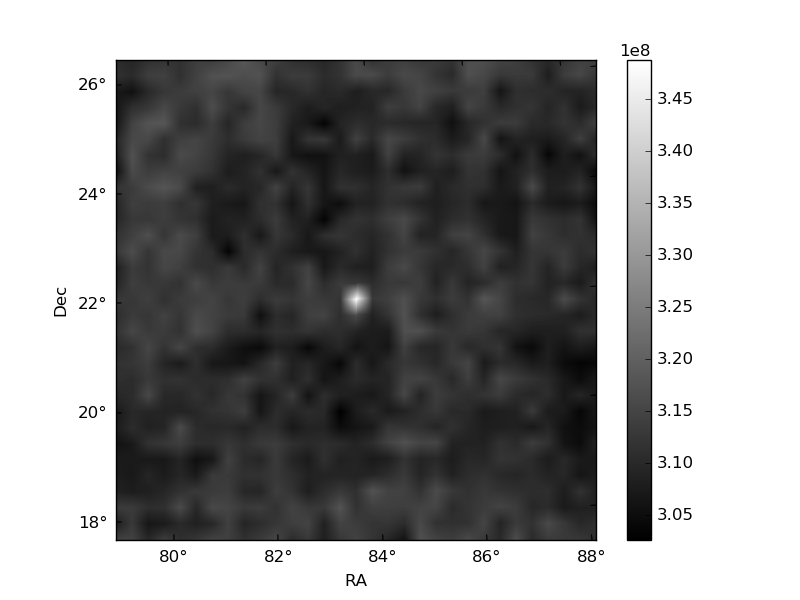
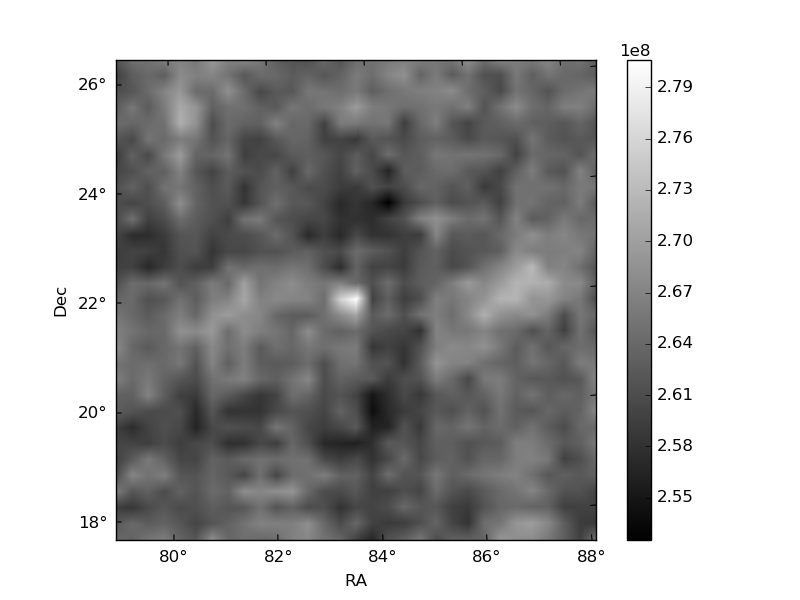
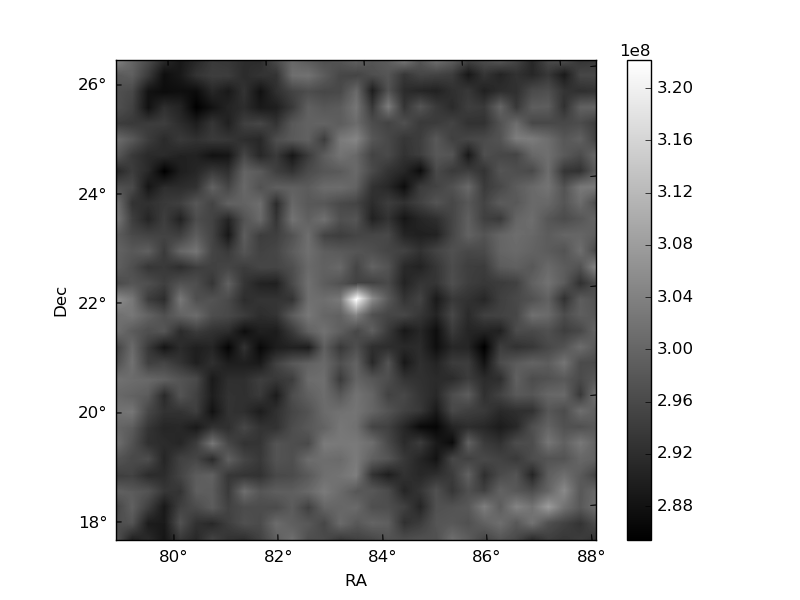
Histogram calculated using DETX and DETY for each event in the final _common_clean file
| Quadrant A | 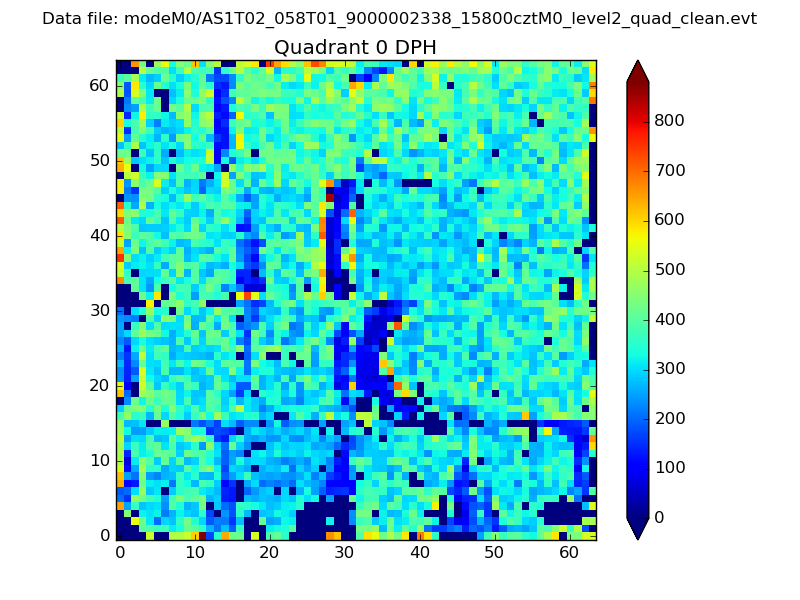 |
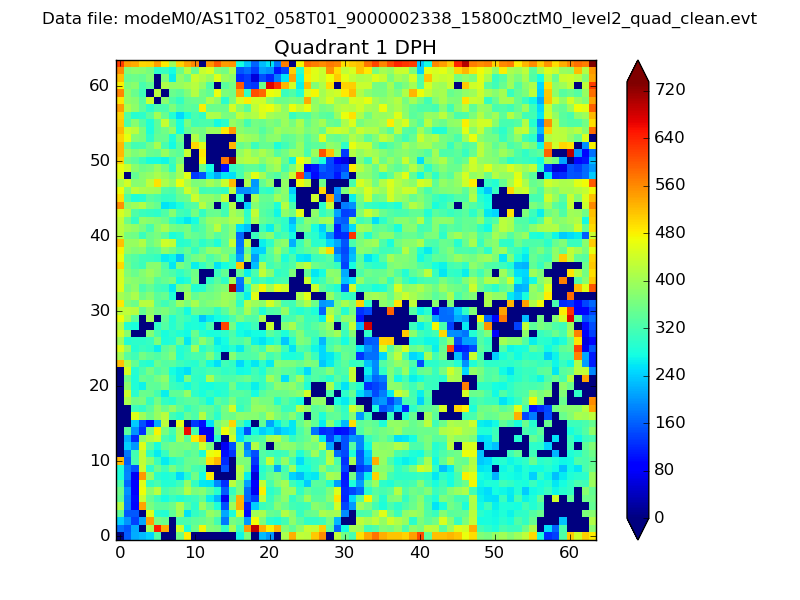 |
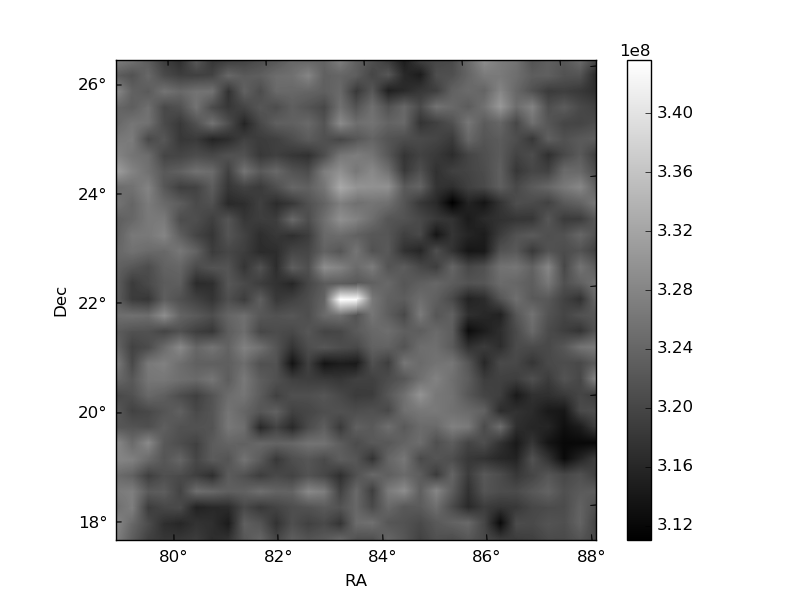
Quadrant B |
|---|---|---|---|
| Quadrant D | 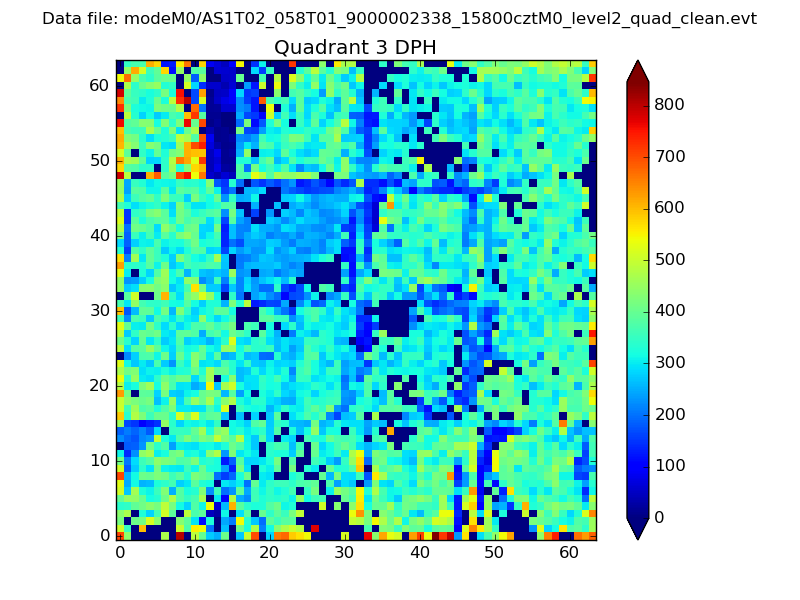 |
 |
Quadrant C |
| Plot type | Count rate plots | Images |
|---|---|---|
| Comparison with Poisson distribution Blue bars denote a histogram of data divided into 1 sec bins. Red curve is a Poisson curve with rate = median count rate of data. |
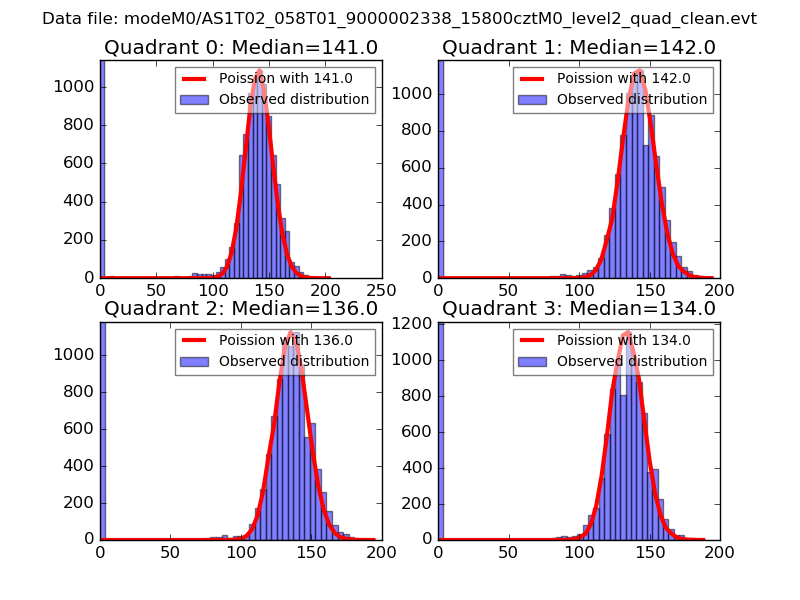 |
 |
| Quadrant-wise count rates Data is divided into 100 sec bins |
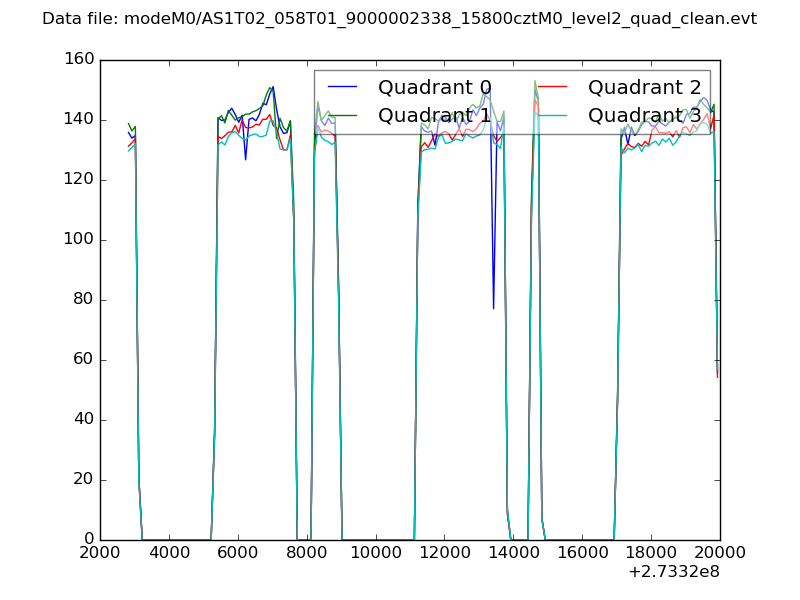 |
|
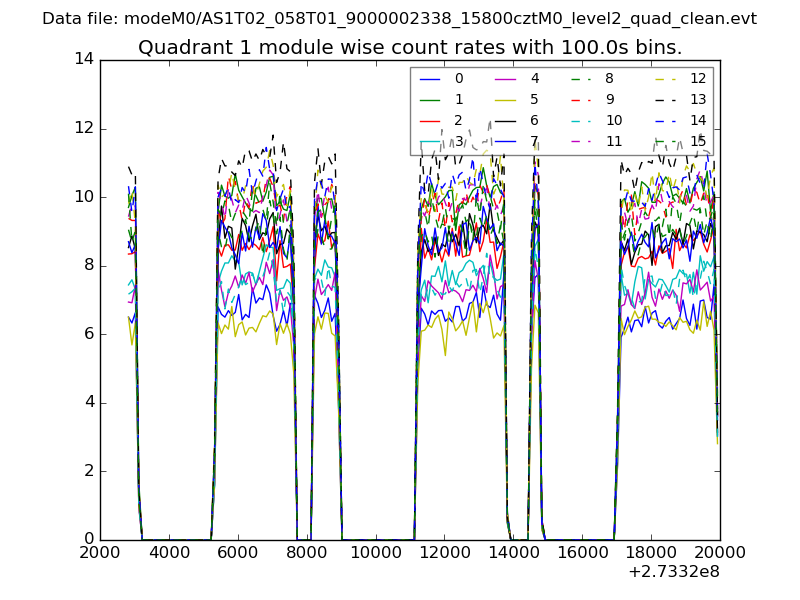
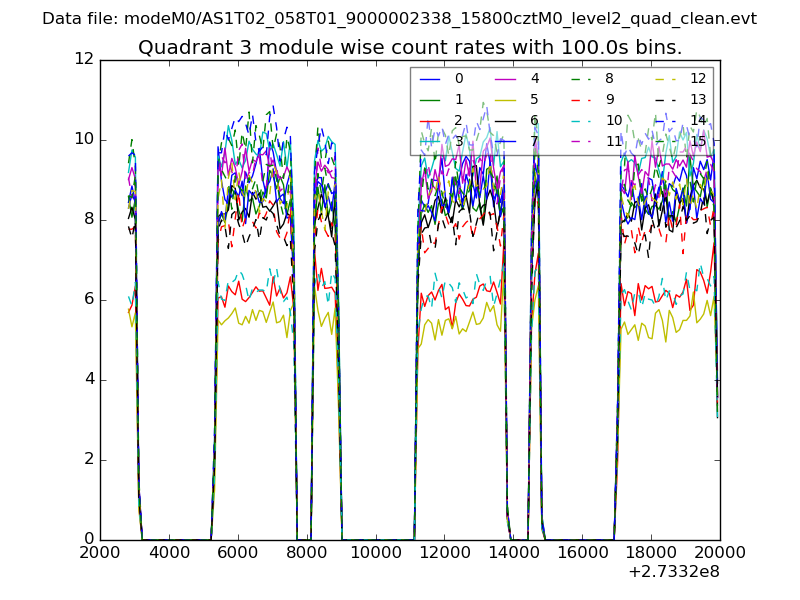
| Module-wise count rates for Quadrant A Data is divided into 100 sec bins |
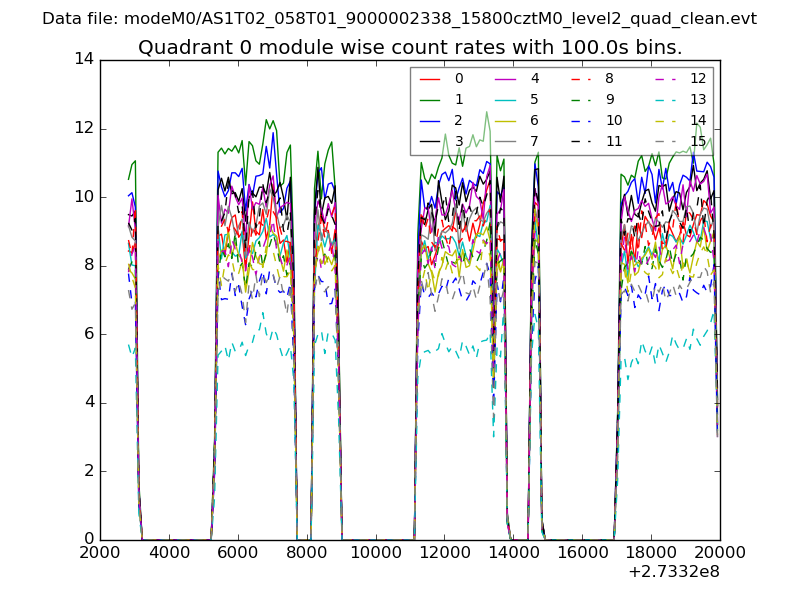 |
 |
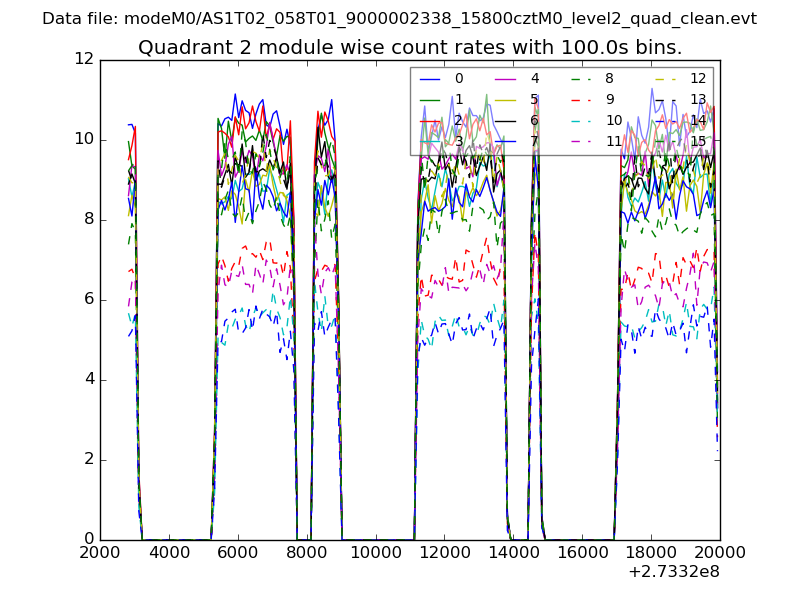
| Module-wise count rates for Quadrant B Data is divided into 100 sec bins |
 |
 |
| Module-wise count rates for Quadrant C Data is divided into 100 sec bins |
 |
 |
| Module-wise count rates for Quadrant D Data is divided into 100 sec bins |
 |
 |
| Parameter | Plot |
|---|---|
| CZT HV Monitor | 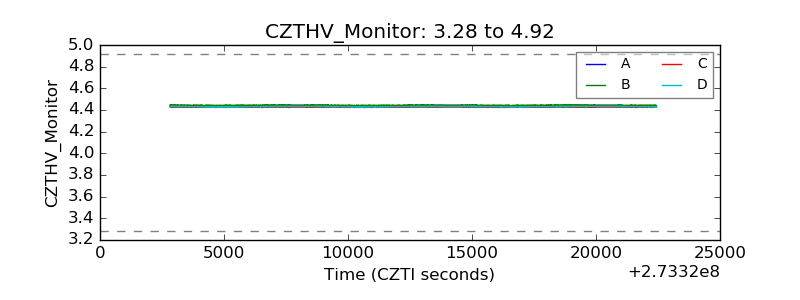 |
| D_VDD | 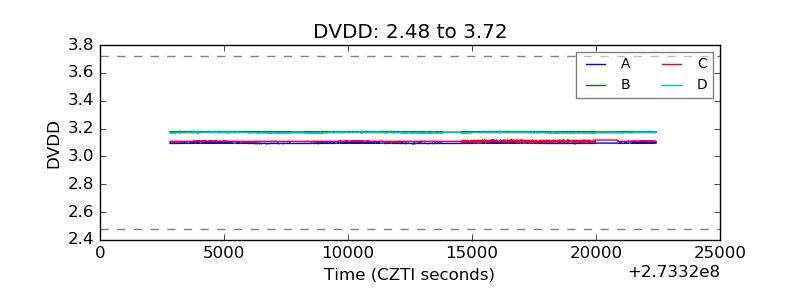 |
| Temperature 1 | 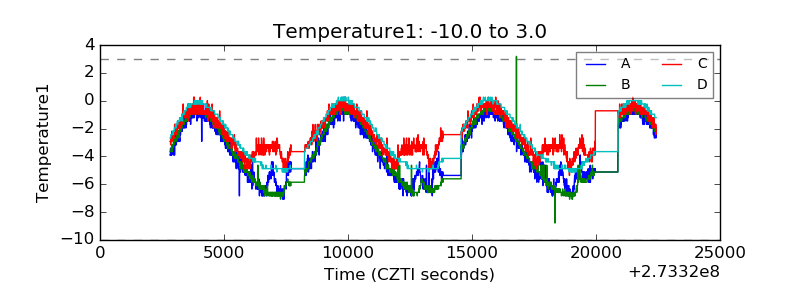 |
| Veto HV Monitor | 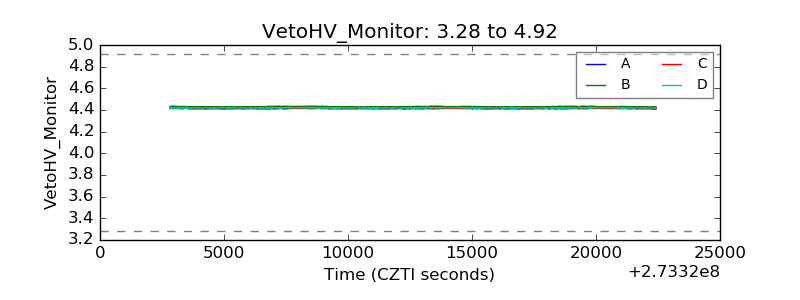 |
| Veto LLD | 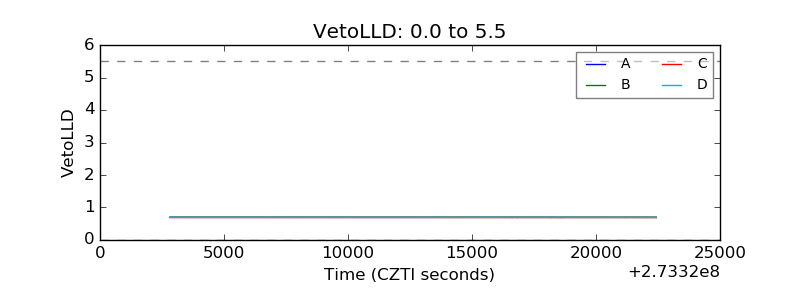 |
| Alpha Counter | 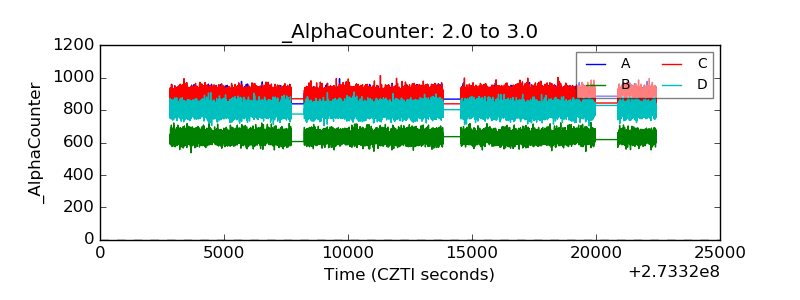 |
| _CPM_Rate | 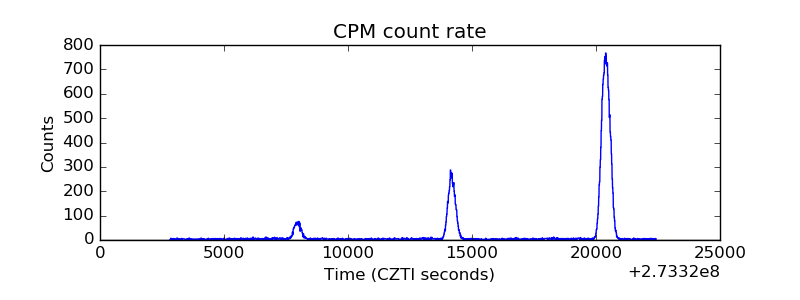 |
| CZT Counter | 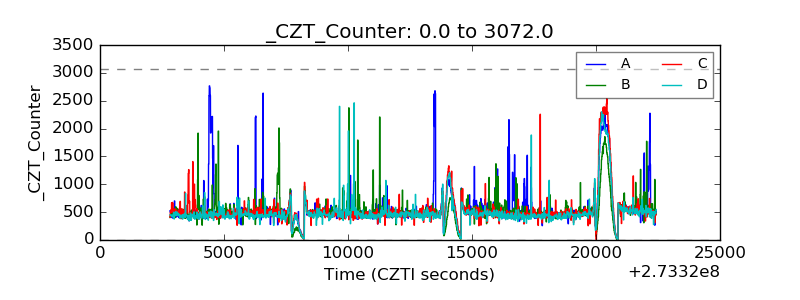 |
| +2.5 Volts monitor |  |
| +5 Volts monitor |  |
| _ROLL_ROT | 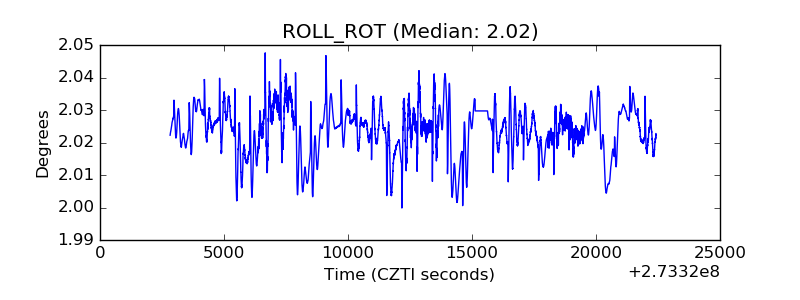 |
| _Roll_DEC | 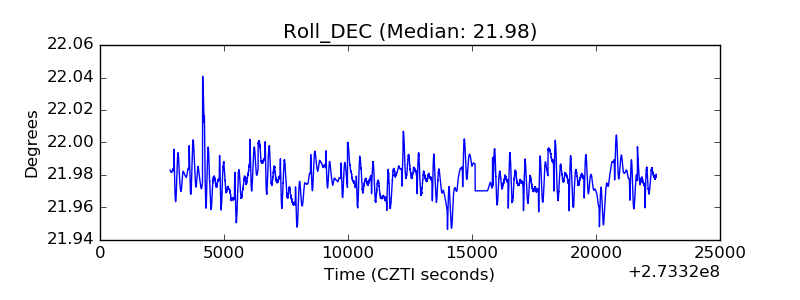 |
| _Roll_RA | 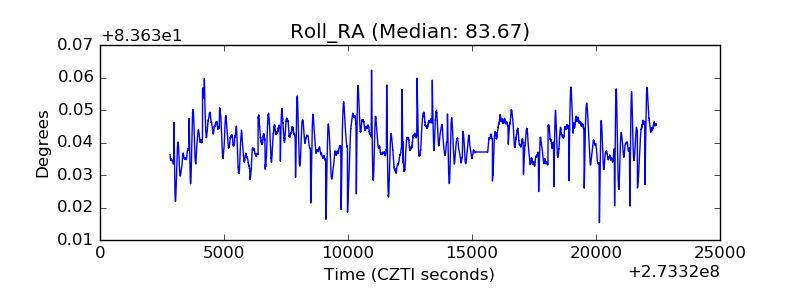 |
| Veto Counter | 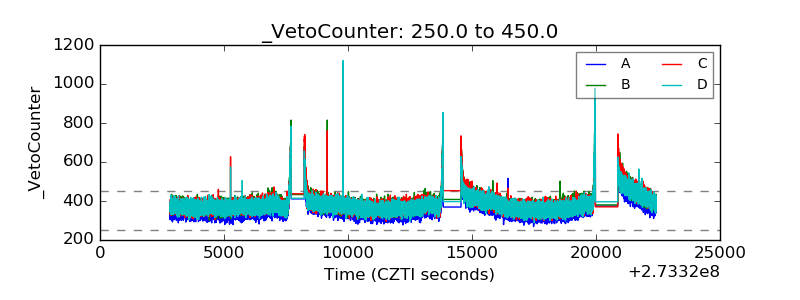 |