| Param | Original file | Final file |
|---|---|---|
| Filename | modeM0/AS1T02_097T01_9000002340cztM0_level2.fits | modeM0/AS1T02_097T01_9000002340cztM0_level2_quad_clean.evt |
| Size (bytes) | 247,959,360 | 167,581,440 |
| Size | 236.5 MB | 159.8 MB |
| Events in quadrant A | 1,507,734 | 861,823 |
| Events in quadrant B | 1,488,998 | 892,049 |
| Events in quadrant C | 1,520,776 | 858,423 |
| Events in quadrant D | 1,312,786 | 781,669 |
| Mode M9 | |||
|---|---|---|---|
| Quadrant | BADHDUFLAG | Total packets | Discarded packets |
| A | 0 | 64 | 0 |
| B | 0 | 64 | 0 |
| C | 0 | 64 | 0 |
| D | 0 | 64 | 0 |
| Mode M0 | |||
|---|---|---|---|
| Quadrant | BADHDUFLAG | Total packets | Discarded packets |
| A | 0 | 56668 | 0 |
| B | 0 | 52191 | 0 |
| C | 0 | 51090 | 0 |
| D | 0 | 54054 | 0 |
| Mode SS | |||
|---|---|---|---|
| Quadrant | BADHDUFLAG | Total packets | Discarded packets |
| A | 0 | 498 | 0 |
| B | 0 | 498 | 0 |
| C | 0 | 498 | 0 |
| D | 0 | 498 | 0 |
| Quadrant | Total seconds | Saturated seconds | Saturation percentage |
|---|---|---|---|
| A | 24414 | 633 | 2.592775% |
| B | 24414 | 164 | 0.671746% |
| C | 24414 | 197 | 0.806914% |
| D | 24414 | 269 | 1.101827% |
Noise dominated data is calculated using 1-second bins in cleaned event files. If a bin has >2000 counts, and if more than 50% of those come from <1% of pixels, then it is considered to be noise-dominated and hence unusable.
| Quadrant | # 1 sec bins | Bins with >0 counts | Bins with >2000 counts | High rate bins dominated by noise | Noise dominated (total time) | Noise dominated (detector-on time) | Marked lightcurve |
|---|---|---|---|---|---|---|---|
| A | 30814 | 24394 | 0 | 0 | 0.00% | 0.00% |  |
| B | 30814 | 24414 | 0 | 0 | 0.00% | 0.00% |  |
| C | 30814 | 24414 | 0 | 0 | 0.00% | 0.00% |  |
| D | 30814 | 24415 | 0 | 0 | 0.00% | 0.00% |  |
Top three noisy pixels from each quadrant. If the there are fewer than three noisy pixels in the level2.evt file, extra rows are filled as -1
| Pixel properties | Quadrant properties | ||||||
|---|---|---|---|---|---|---|---|
| Quadrant | DetID | PixID | Counts | Sigma | Mean | Median | Sigma |
| A | 0 | 29 | 1405 | 10.69 | 393 | 371 | 96.7 |
| A | 7 | 110 | 1238 | 8.96 | 393 | 371 | 96.7 |
| A | 9 | 19 | 1131 | 7.86 | 393 | 371 | 96.7 |
| B | 2 | 9 | 1162 | 10.09 | 393 | 378 | 77.7 |
| B | 3 | 80 | 1004 | 8.06 | 393 | 378 | 77.7 |
| B | 2 | 8 | 969 | 7.61 | 393 | 378 | 77.7 |
| C | 1 | 80 | 1097 | 6.91 | 401 | 377 | 104.1 |
| C | 1 | 81 | 1090 | 6.85 | 401 | 377 | 104.1 |
| C | 12 | 241 | 1051 | 6.47 | 401 | 377 | 104.1 |
| D | 6 | 231 | 977 | 6.33 | 374 | 342 | 100.4 |
| D | 10 | 189 | 942 | 5.98 | 374 | 342 | 100.4 |
| D | 3 | 14 | 925 | 5.81 | 374 | 342 | 100.4 |
Histogram calculated using DETX and DETY for each event in the final _common_clean file
| Quadrant A | 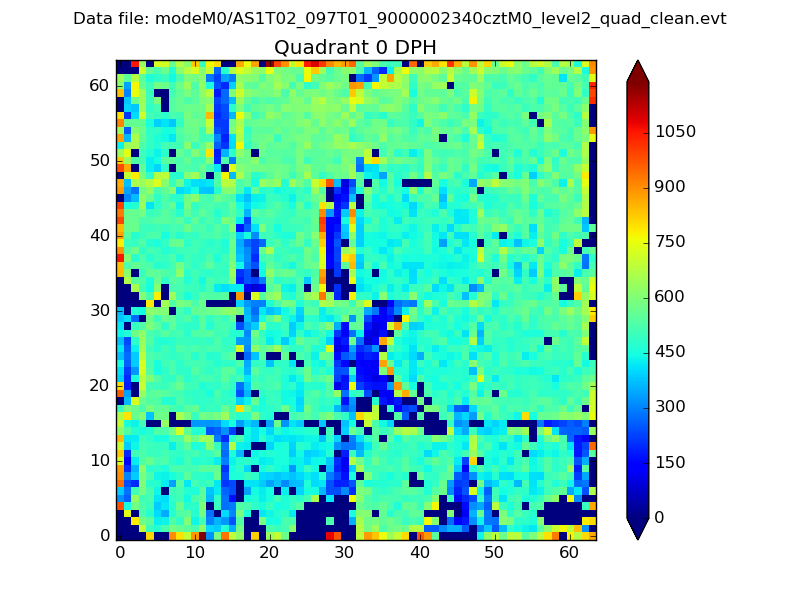 |
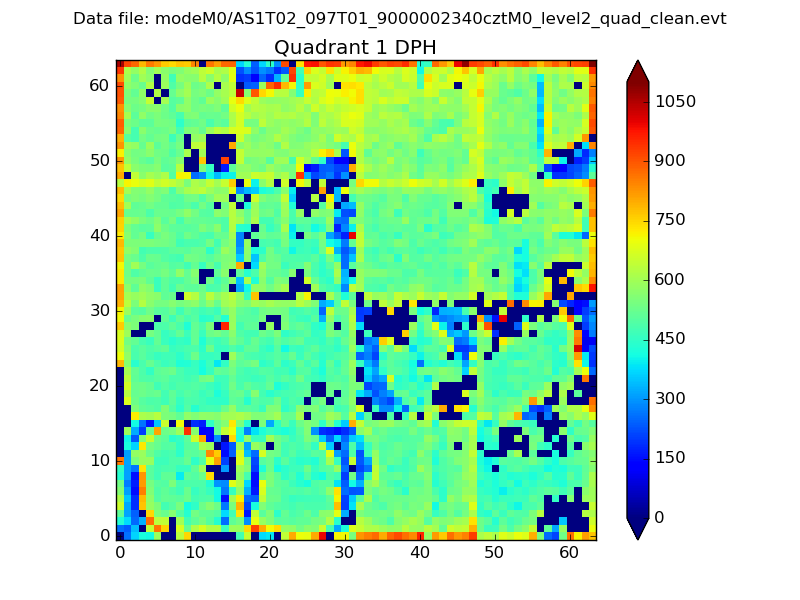 |
Quadrant B |
|---|---|---|---|
| Quadrant D | 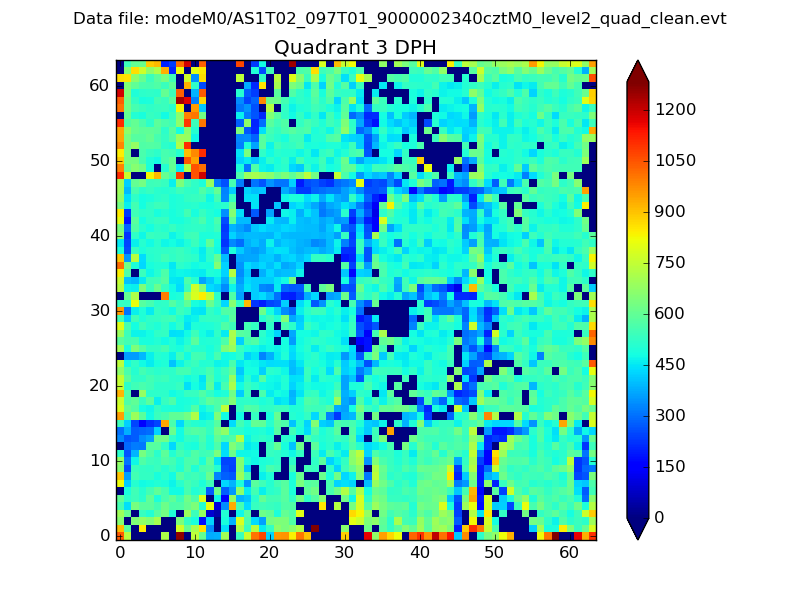 |
 |
Quadrant C |
| Plot type | Count rate plots | Images |
|---|---|---|
| Comparison with Poisson distribution Blue bars denote a histogram of data divided into 1 sec bins. Red curve is a Poisson curve with rate = median count rate of data. |
 |
 |
| Quadrant-wise count rates Data is divided into 100 sec bins |
 |
|
| Module-wise count rates for Quadrant A Data is divided into 100 sec bins |
 |
 |
| Module-wise count rates for Quadrant B Data is divided into 100 sec bins |
 |
 |
| Module-wise count rates for Quadrant C Data is divided into 100 sec bins |
 |
 |
| Module-wise count rates for Quadrant D Data is divided into 100 sec bins |
 |
 |
| Parameter | Plot |
|---|---|
| CZT HV Monitor |  |
| D_VDD |  |
| Temperature 1 |  |
| Veto HV Monitor |  |
| Veto LLD | 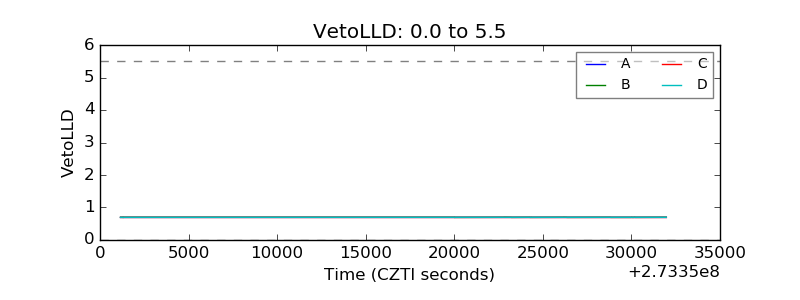 |
| Alpha Counter |  |
| _CPM_Rate |  |
| CZT Counter |  |
| +2.5 Volts monitor |  |
| +5 Volts monitor |  |
| _ROLL_ROT |  |
| _Roll_DEC |  |
| _Roll_RA |  |
| Veto Counter |  |