| Param | Original file | Final file |
|---|---|---|
| Filename | modeM0/AS1T02_097T01_9000002340_15803cztM0_level2.evt | modeM0/AS1T02_097T01_9000002340_15803cztM0_level2_quad_clean.evt |
| Size (bytes) | 198,198,720 | 43,637,760 |
| Size | 189.0 MB | 41.6 MB |
| Events in quadrant A | 2,070,370 | 274,521 |
| Events in quadrant B | 1,262,675 | 305,199 |
| Events in quadrant C | 1,357,550 | 292,194 |
| Events in quadrant D | 1,154,694 | 284,403 |
| Mode M9 | |||
|---|---|---|---|
| Quadrant | BADHDUFLAG | Total packets | Discarded packets |
| A | 0 | 12 | 0 |
| B | 0 | 12 | 0 |
| C | 0 | 12 | 0 |
| D | 0 | 12 | 0 |
| Mode M0 | |||
|---|---|---|---|
| Quadrant | BADHDUFLAG | Total packets | Discarded packets |
| A | 0 | 7669 | 2 |
| B | 0 | 5115 | 1 |
| C | 0 | 5397 | 1 |
| D | 0 | 4792 | 1 |
| Mode SS | |||
|---|---|---|---|
| Quadrant | BADHDUFLAG | Total packets | Discarded packets |
| A | 0 | 48 | 0 |
| B | 0 | 48 | 0 |
| C | 0 | 48 | 0 |
| D | 0 | 48 | 0 |
| Quadrant | Total seconds | Saturated seconds | Saturation percentage |
|---|---|---|---|
| A | 2282 | 337 | 14.767748% |
| B | 2282 | 21 | 0.920245% |
| C | 2282 | 41 | 1.796670% |
| D | 2282 | 4 | 0.175285% |
Noise dominated data is calculated using 1-second bins in cleaned event files. If a bin has >2000 counts, and if more than 50% of those come from <1% of pixels, then it is considered to be noise-dominated and hence unusable.
| Quadrant | # 1 sec bins | Bins with >0 counts | Bins with >2000 counts | High rate bins dominated by noise | Noise dominated (total time) | Noise dominated (detector-on time) | Marked lightcurve |
|---|---|---|---|---|---|---|---|
| A | 3453 | 2284 | 194 | 194 | 5.62% | 8.49% | 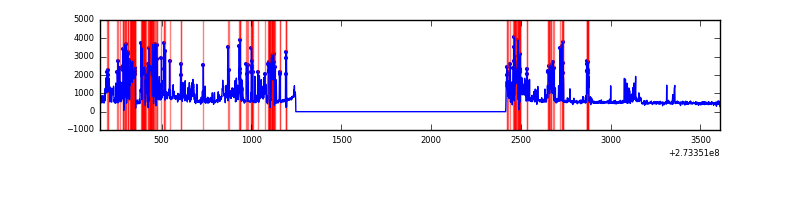 |
| B | 3453 | 2284 | 1 | 1 | 0.03% | 0.04% | 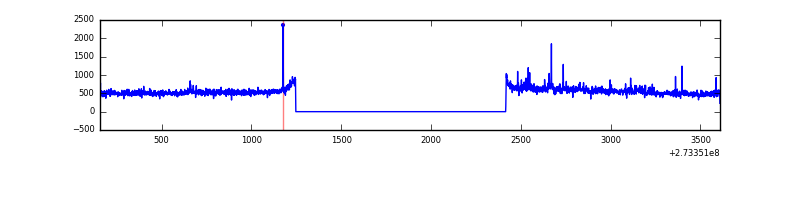 |
| C | 3453 | 2284 | 6 | 6 | 0.17% | 0.26% | 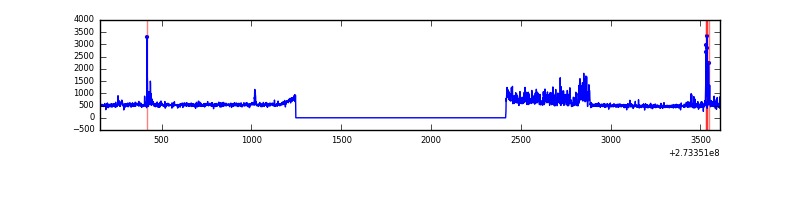 |
| D | 3453 | 2284 | 0 | 0 | 0.00% | 0.00% | 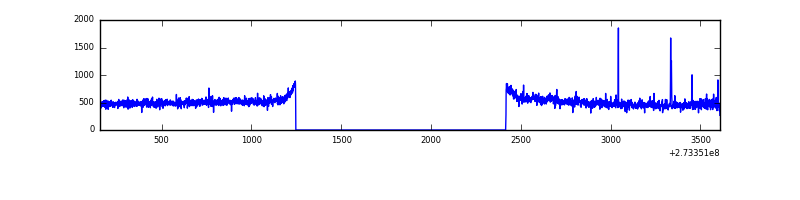 |
Top three noisy pixels from each quadrant. If the there are fewer than three noisy pixels in the level2.evt file, extra rows are filled as -1
| Pixel properties | Quadrant properties | ||||||
|---|---|---|---|---|---|---|---|
| Quadrant | DetID | PixID | Counts | Sigma | Mean | Median | Sigma |
| A | 15 | 239 | 937874 | 15882.32 | 283 | 278 | 59.0 |
| A | 10 | 253 | 23667 | 396.2 | 283 | 278 | 59.0 |
| A | 14 | 254 | 15077 | 250.69 | 283 | 278 | 59.0 |
| B | 0 | 229 | 14125 | 230.7 | 306 | 299 | 59.9 |
| B | 0 | 219 | 11571 | 188.09 | 306 | 299 | 59.9 |
| B | 4 | 142 | 8963 | 144.57 | 306 | 299 | 59.9 |
| C | 7 | 247 | 130195 | 1873.4 | 291 | 293 | 69.3 |
| C | 10 | 22 | 46052 | 659.92 | 291 | 293 | 69.3 |
| C | 14 | 238 | 45175 | 647.27 | 291 | 293 | 69.3 |
| D | 2 | 152 | 16054 | 213.34 | 295 | 286 | 73.9 |
| D | 2 | 234 | 9783 | 128.49 | 295 | 286 | 73.9 |
| D | 2 | 69 | 6185 | 79.81 | 295 | 286 | 73.9 |
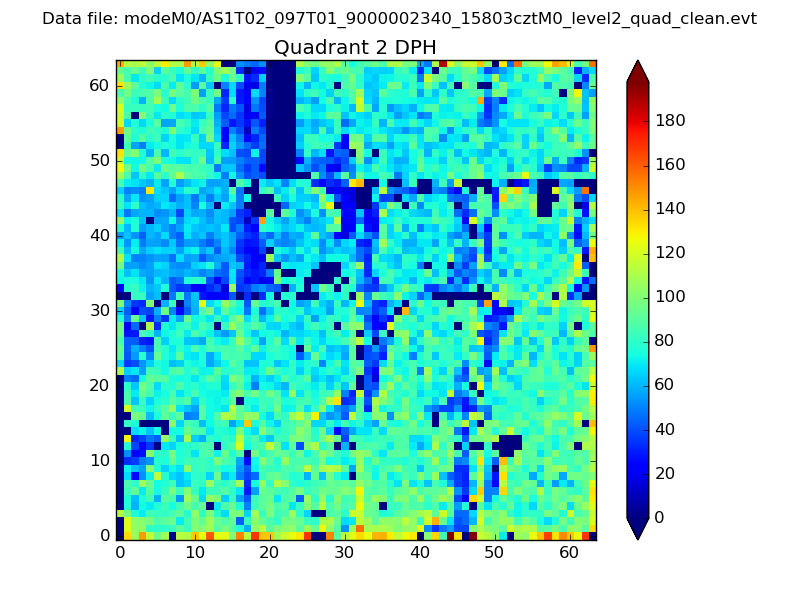
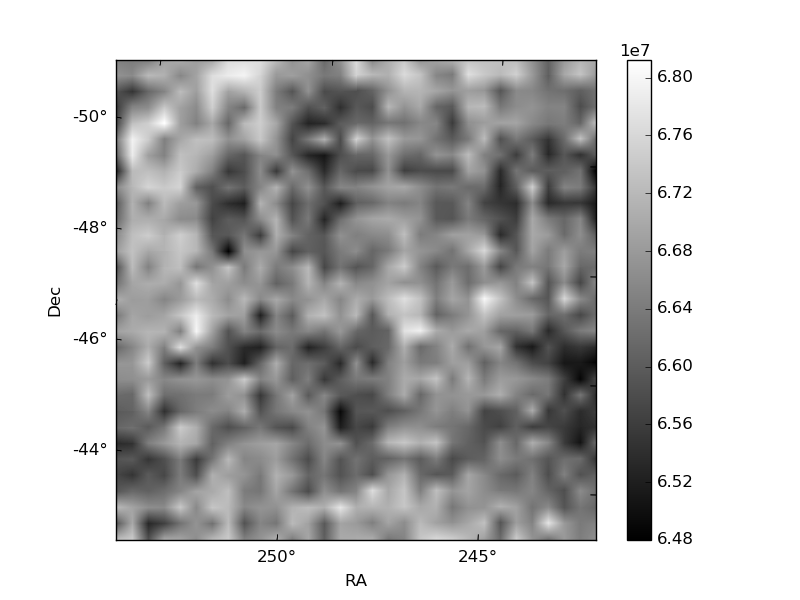
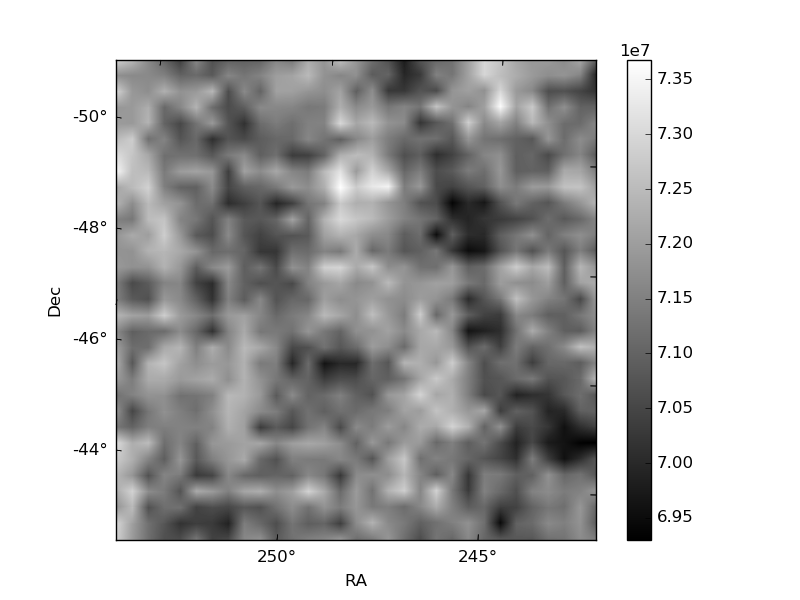
Histogram calculated using DETX and DETY for each event in the final _common_clean file
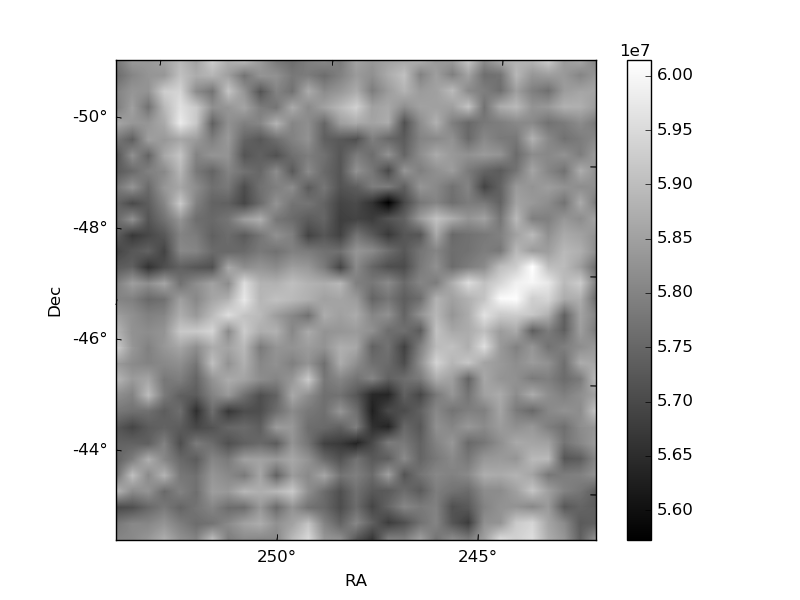
| Quadrant A | 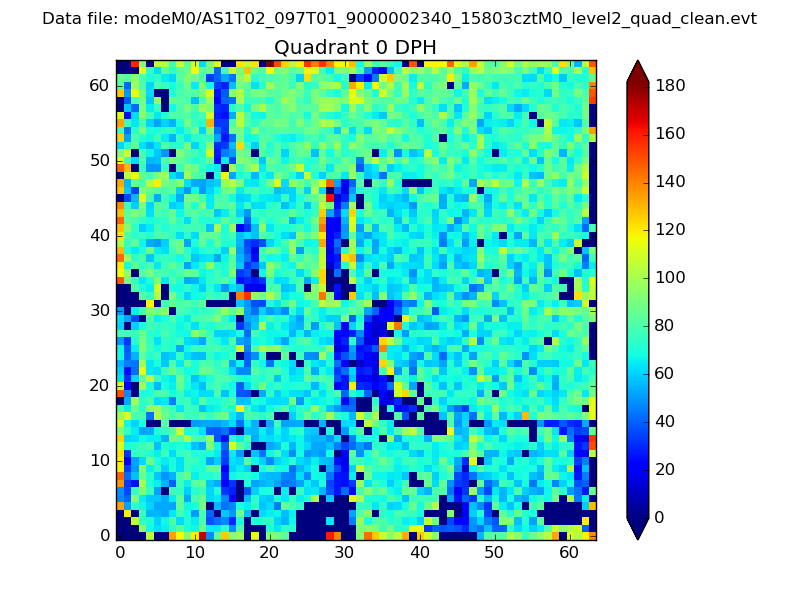 |
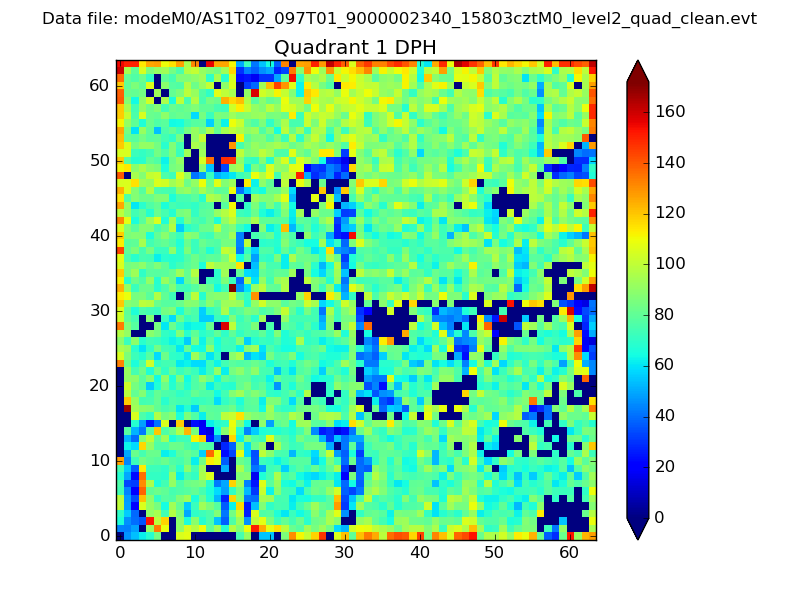 |
Quadrant B |
|---|---|---|---|
| Quadrant D | 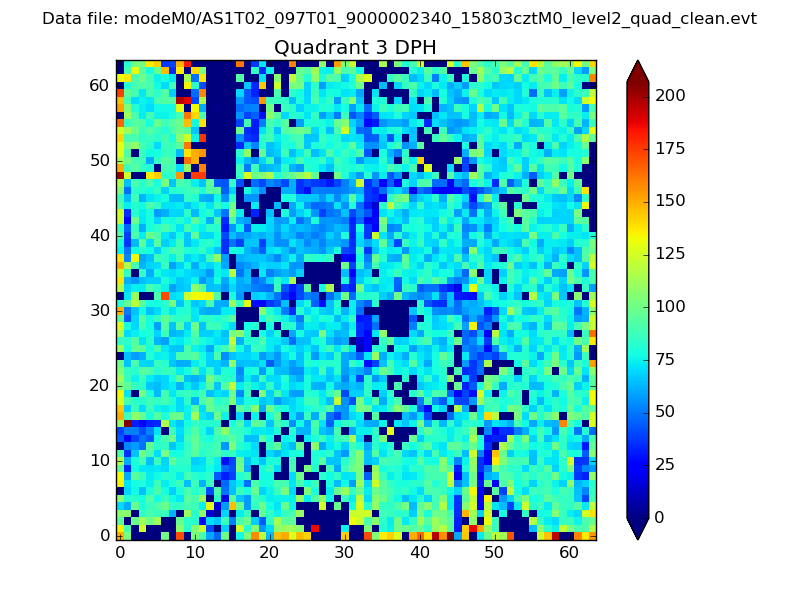 |
 |
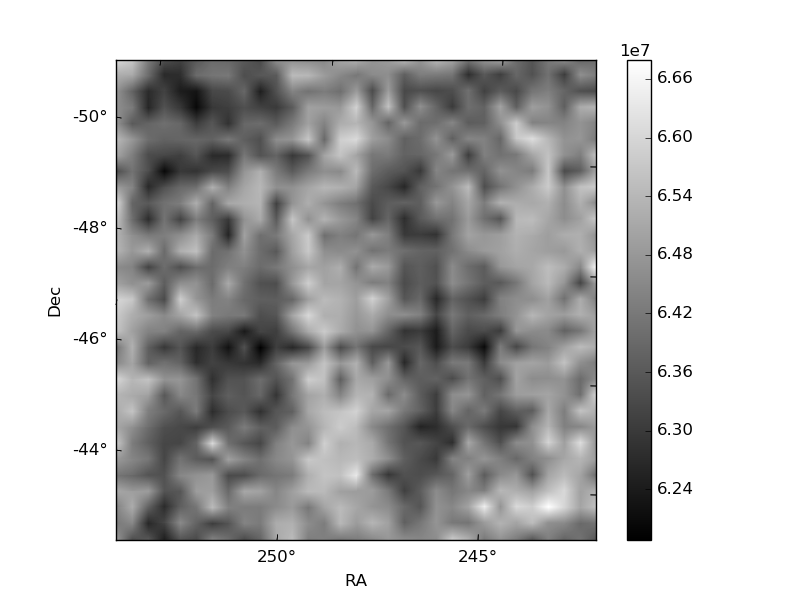
Quadrant C |
| Plot type | Count rate plots | Images |
|---|---|---|
| Comparison with Poisson distribution Blue bars denote a histogram of data divided into 1 sec bins. Red curve is a Poisson curve with rate = median count rate of data. |
 |
 |
| Quadrant-wise count rates Data is divided into 100 sec bins |
 |
|
| Module-wise count rates for Quadrant A Data is divided into 100 sec bins |
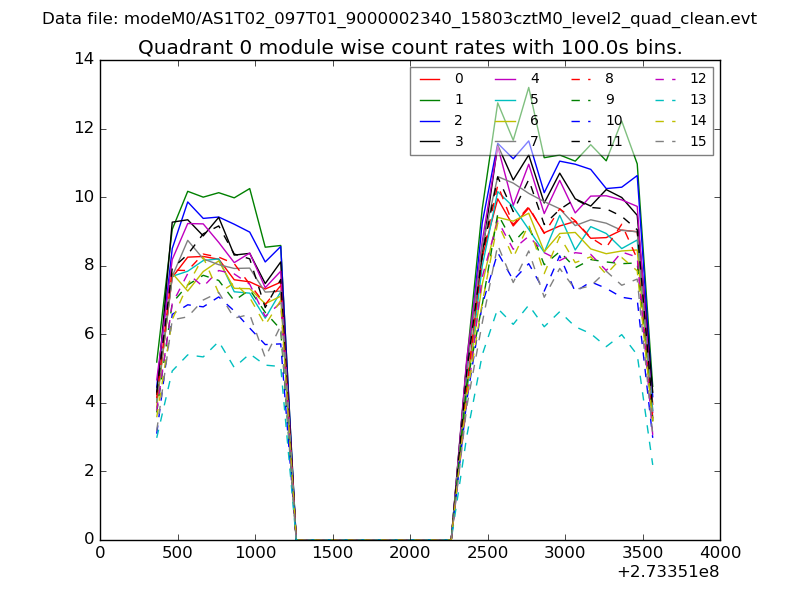 |
 |
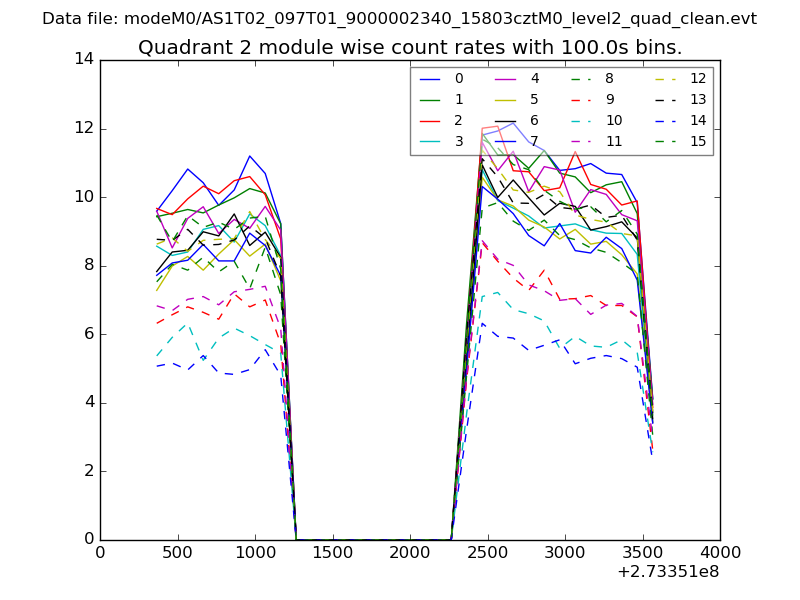
| Module-wise count rates for Quadrant B Data is divided into 100 sec bins |
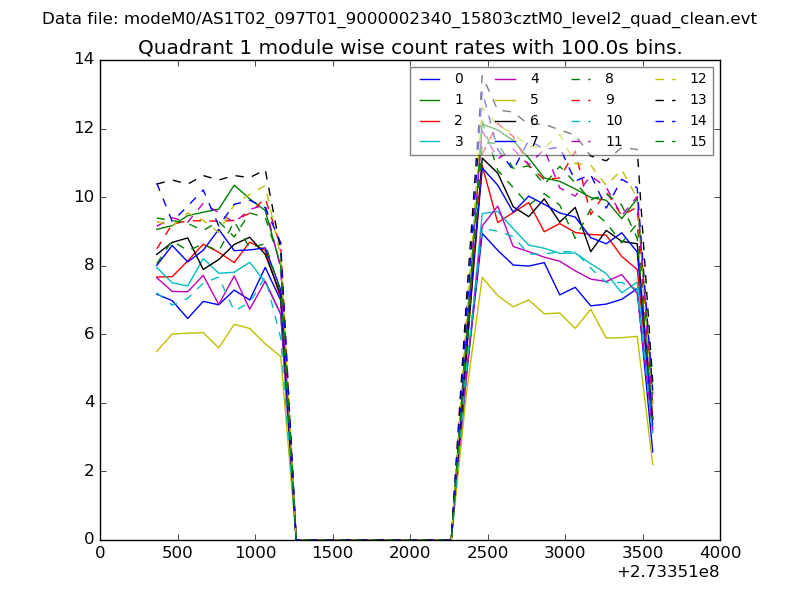 |
 |
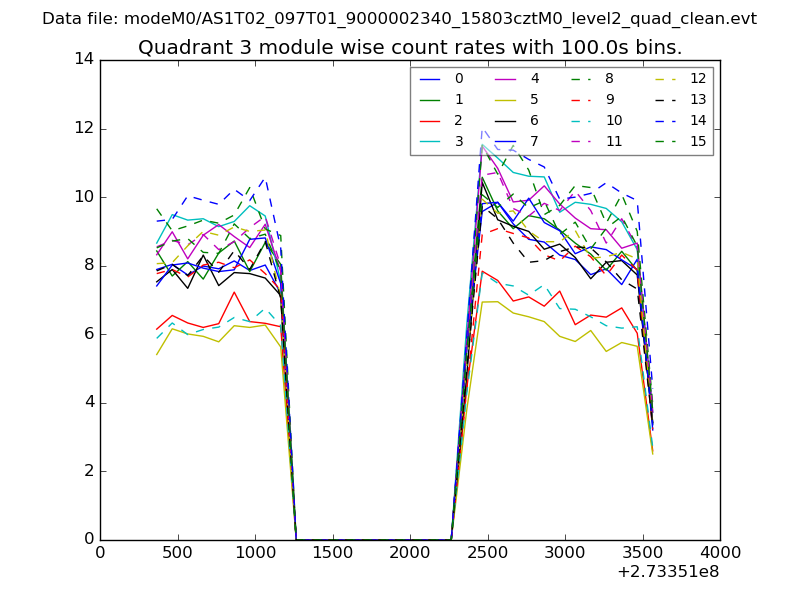
| Module-wise count rates for Quadrant C Data is divided into 100 sec bins |
 |
 |
| Module-wise count rates for Quadrant D Data is divided into 100 sec bins |
 |
 |
| Parameter | Plot |
|---|---|
| CZT HV Monitor | 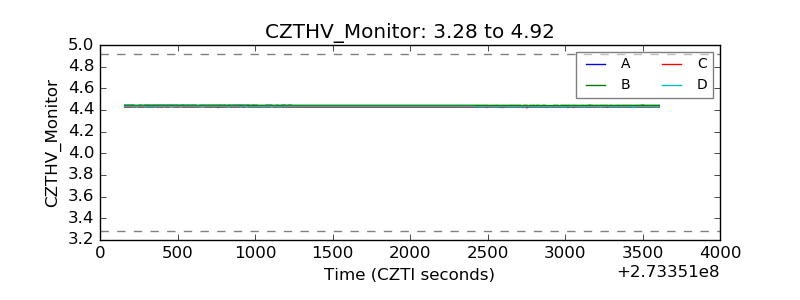 |
| D_VDD | 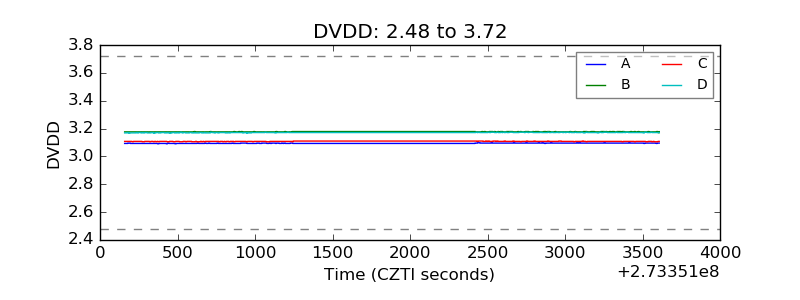 |
| Temperature 1 | 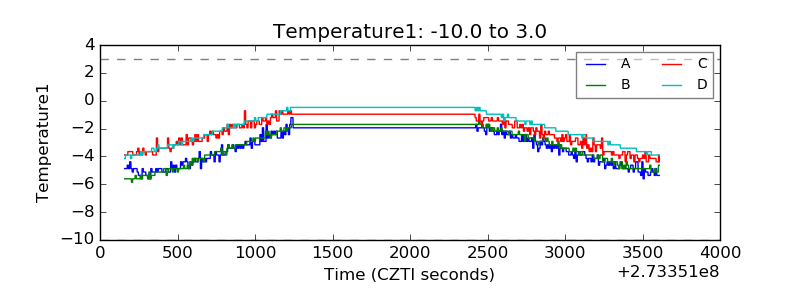 |
| Veto HV Monitor | 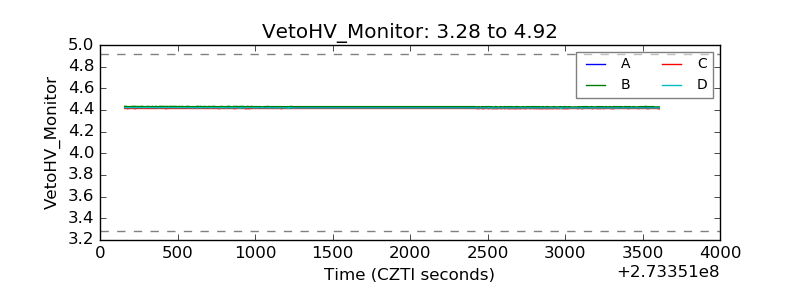 |
| Veto LLD | 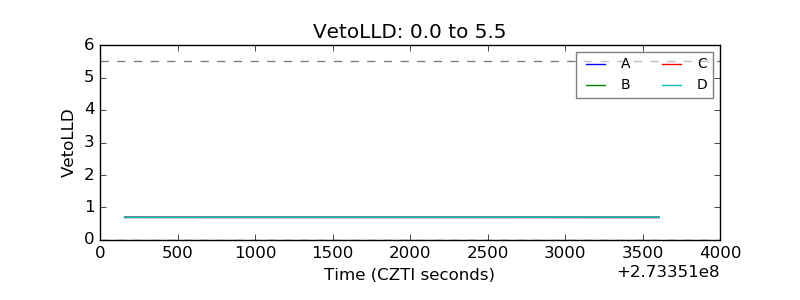 |
| Alpha Counter |  |
| _CPM_Rate | 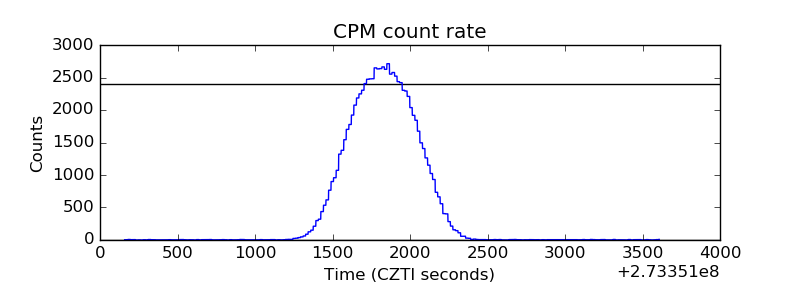 |
| CZT Counter | 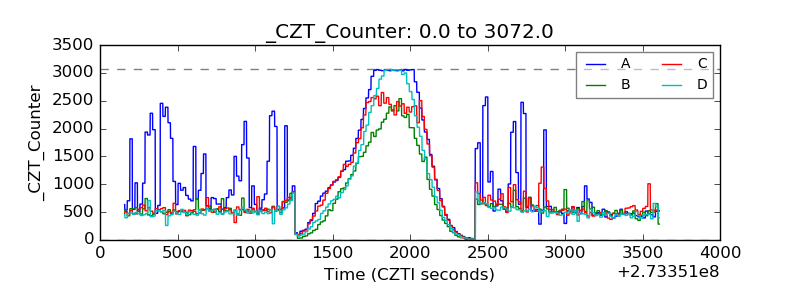 |
| +2.5 Volts monitor |  |
| +5 Volts monitor |  |
| _ROLL_ROT | 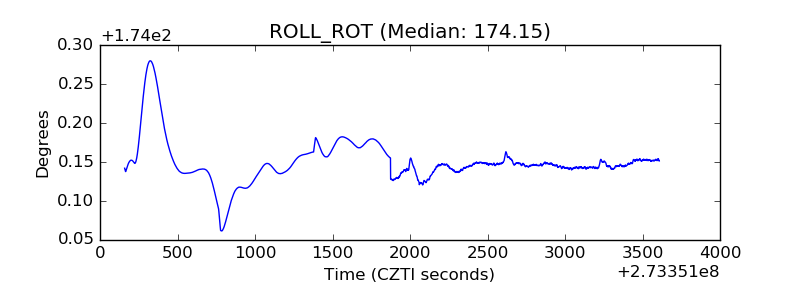 |
| _Roll_DEC | 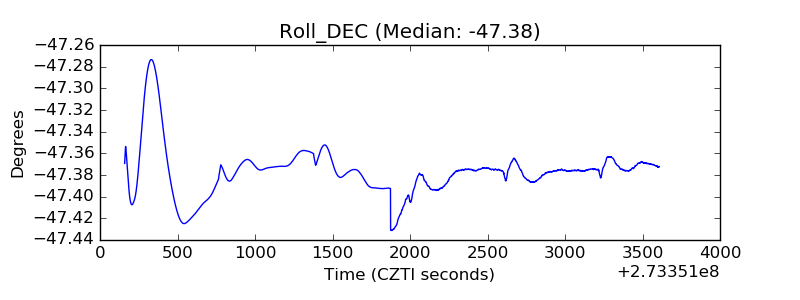 |
| _Roll_RA | 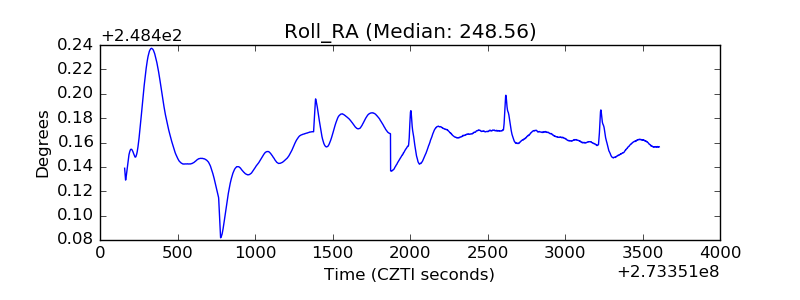 |
| Veto Counter | 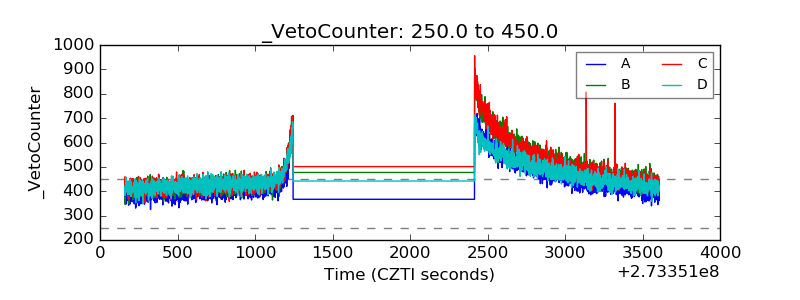 |