| Param | Original file | Final file |
|---|---|---|
| Filename | modeM0/AS1T02_097T01_9000002340_15804cztM0_level2.evt | modeM0/AS1T02_097T01_9000002340_15804cztM0_level2_quad_clean.evt |
| Size (bytes) | 469,080,000 | 91,874,880 |
| Size | 447.3 MB | 87.6 MB |
| Events in quadrant A | 3,607,901 | 583,402 |
| Events in quadrant B | 3,256,841 | 613,506 |
| Events in quadrant C | 3,211,325 | 587,354 |
| Events in quadrant D | 3,710,342 | 566,507 |
| Mode M9 | |||
|---|---|---|---|
| Quadrant | BADHDUFLAG | Total packets | Discarded packets |
| A | 0 | 17 | 0 |
| B | 0 | 17 | 0 |
| C | 0 | 17 | 0 |
| D | 0 | 18 | 0 |
| Mode M0 | |||
|---|---|---|---|
| Quadrant | BADHDUFLAG | Total packets | Discarded packets |
| A | 0 | 14743 | 3 |
| B | 0 | 13538 | 2 |
| C | 0 | 13399 | 2 |
| D | 0 | 15093 | 2 |
| Mode SS | |||
|---|---|---|---|
| Quadrant | BADHDUFLAG | Total packets | Discarded packets |
| A | 0 | 126 | 0 |
| B | 0 | 126 | 0 |
| C | 0 | 126 | 0 |
| D | 0 | 126 | 0 |
| Quadrant | Total seconds | Saturated seconds | Saturation percentage |
|---|---|---|---|
| A | 6180 | 193 | 3.122977% |
| B | 6180 | 41 | 0.663430% |
| C | 6180 | 47 | 0.760518% |
| D | 6180 | 179 | 2.896440% |
Noise dominated data is calculated using 1-second bins in cleaned event files. If a bin has >2000 counts, and if more than 50% of those come from <1% of pixels, then it is considered to be noise-dominated and hence unusable.
| Quadrant | # 1 sec bins | Bins with >0 counts | Bins with >2000 counts | High rate bins dominated by noise | Noise dominated (total time) | Noise dominated (detector-on time) | Marked lightcurve |
|---|---|---|---|---|---|---|---|
| A | 7441 | 6182 | 106 | 106 | 1.42% | 1.71% | 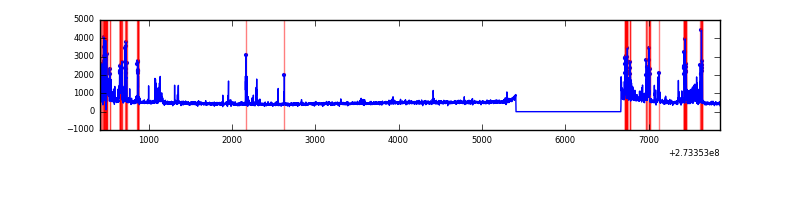 |
| B | 7441 | 6182 | 14 | 14 | 0.19% | 0.23% | 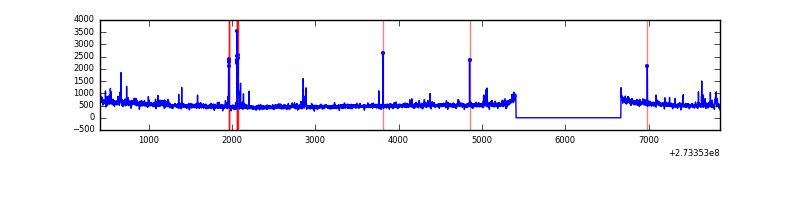 |
| C | 7441 | 6182 | 6 | 6 | 0.08% | 0.10% | 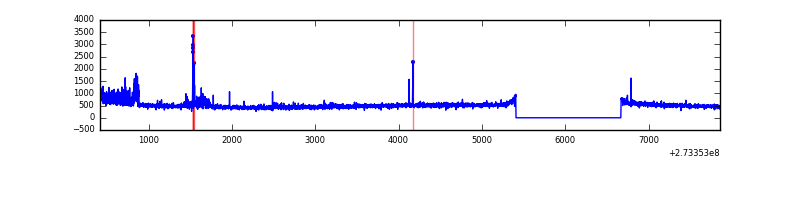 |
| D | 7441 | 6182 | 143 | 143 | 1.92% | 2.31% | 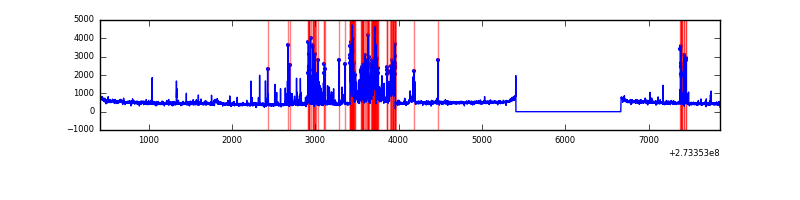 |
Top three noisy pixels from each quadrant. If the there are fewer than three noisy pixels in the level2.evt file, extra rows are filled as -1
| Pixel properties | Quadrant properties | ||||||
|---|---|---|---|---|---|---|---|
| Quadrant | DetID | PixID | Counts | Sigma | Mean | Median | Sigma |
| A | 15 | 239 | 646899 | 4221.43 | 763 | 750 | 153.1 |
| A | 14 | 254 | 24348 | 154.17 | 763 | 750 | 153.1 |
| A | 0 | 226 | 6719 | 39.0 | 763 | 750 | 153.1 |
| B | 4 | 173 | 49733 | 335.52 | 780 | 764 | 145.9 |
| B | 0 | 229 | 30483 | 203.63 | 780 | 764 | 145.9 |
| B | 0 | 219 | 27448 | 182.83 | 780 | 764 | 145.9 |
| C | 7 | 247 | 167919 | 969.81 | 741 | 746 | 172.4 |
| C | 14 | 238 | 114541 | 660.15 | 741 | 746 | 172.4 |
| C | 10 | 22 | 35571 | 202.03 | 741 | 746 | 172.4 |
| D | 7 | 223 | 763412 | 3953.95 | 730 | 714 | 192.9 |
| D | 10 | 70 | 71273 | 365.79 | 730 | 714 | 192.9 |
| D | 2 | 152 | 34447 | 174.87 | 730 | 714 | 192.9 |
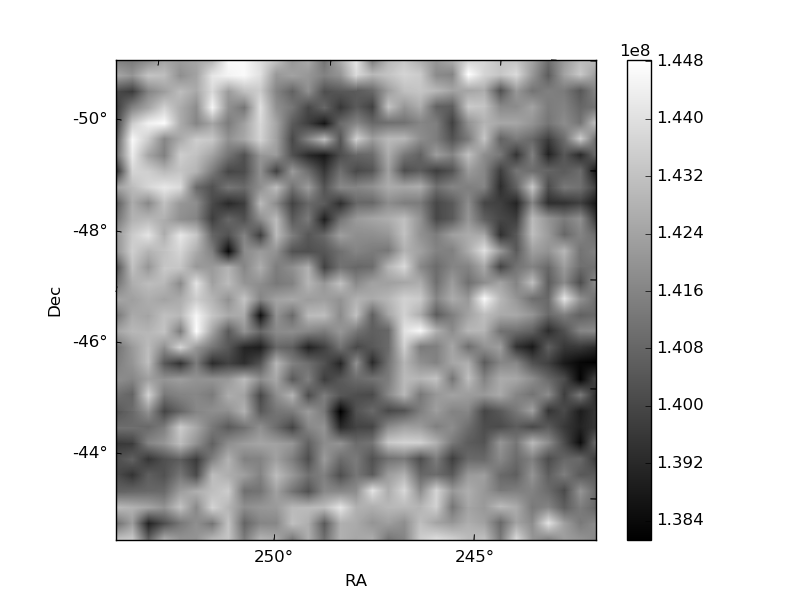
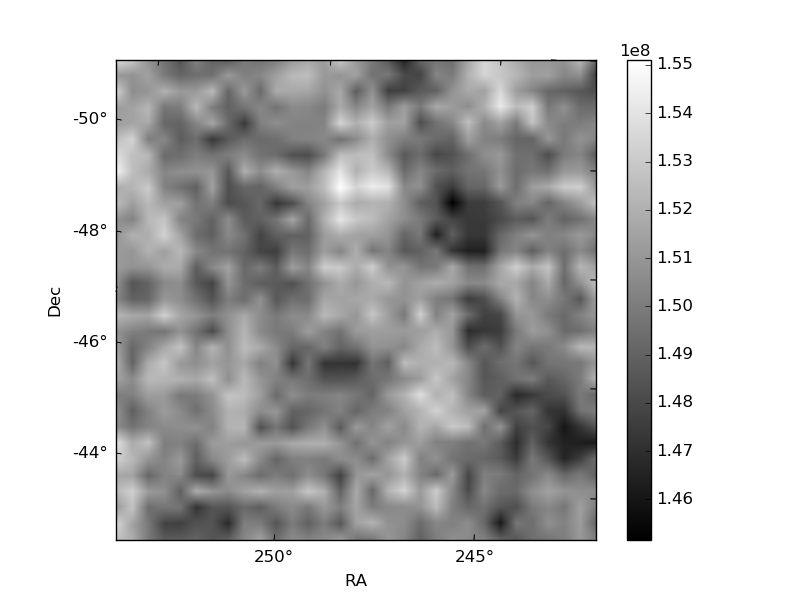
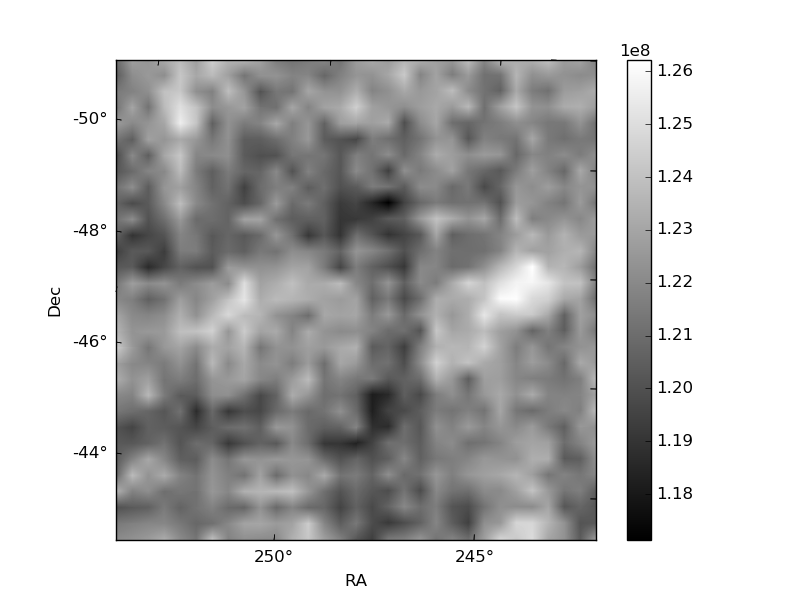
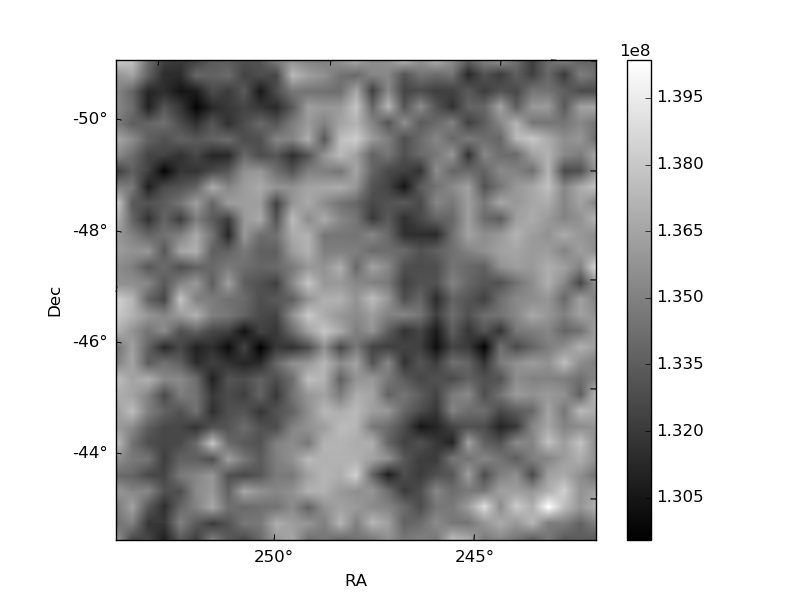
Histogram calculated using DETX and DETY for each event in the final _common_clean file
| Quadrant A | 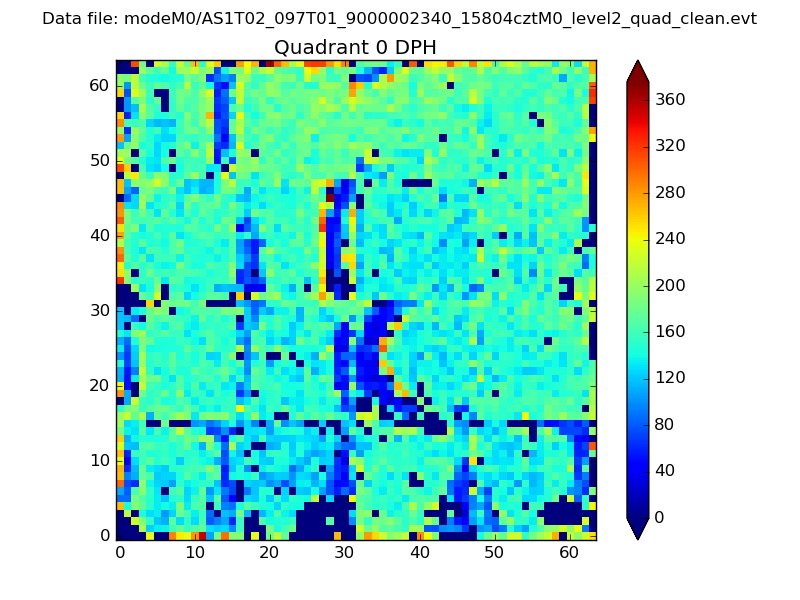 |
 |
Quadrant B |
|---|---|---|---|
| Quadrant D | 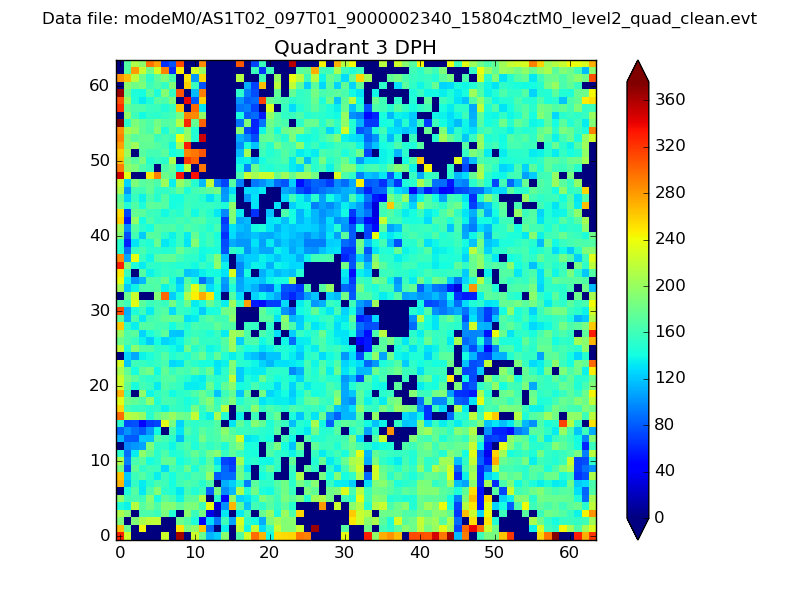 |
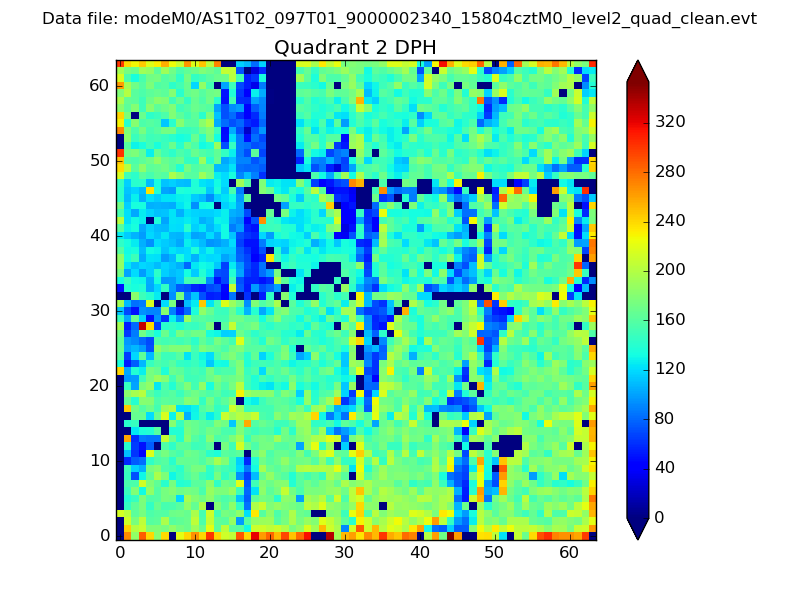 |
Quadrant C |
| Plot type | Count rate plots | Images |
|---|---|---|
| Comparison with Poisson distribution Blue bars denote a histogram of data divided into 1 sec bins. Red curve is a Poisson curve with rate = median count rate of data. |
 |
 |
| Quadrant-wise count rates Data is divided into 100 sec bins |
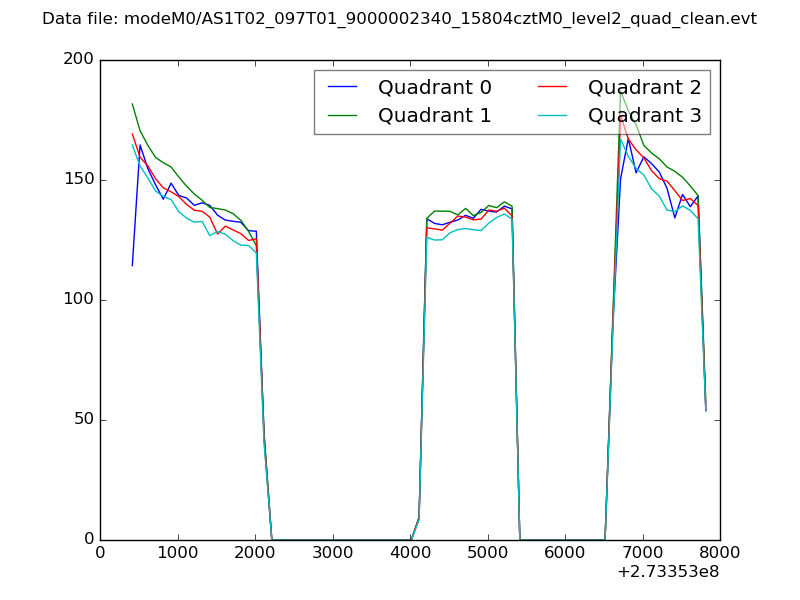 |
|
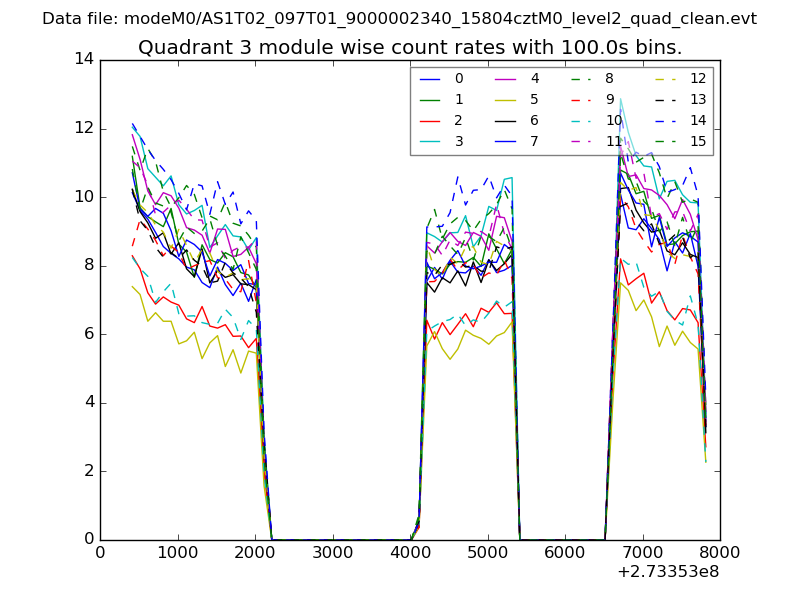
| Module-wise count rates for Quadrant A Data is divided into 100 sec bins |
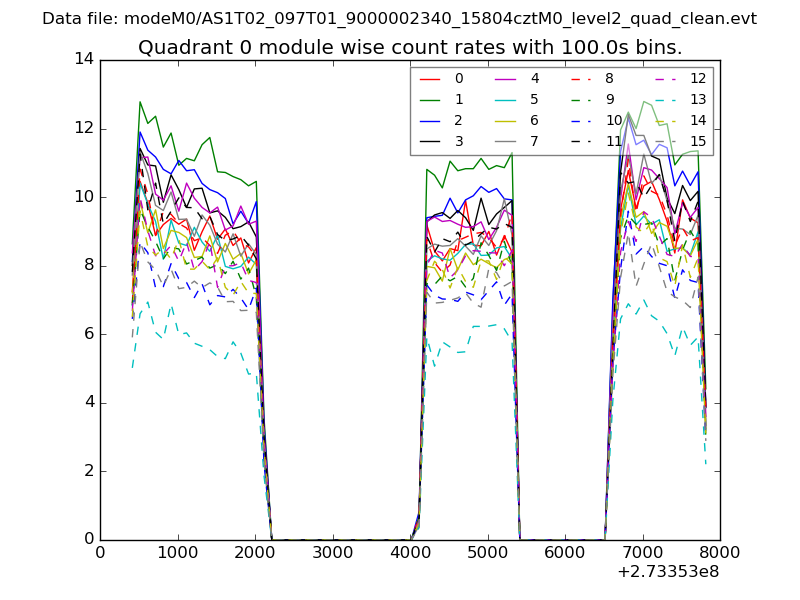 |
 |
| Module-wise count rates for Quadrant B Data is divided into 100 sec bins |
 |
 |
| Module-wise count rates for Quadrant C Data is divided into 100 sec bins |
 |
 |
| Module-wise count rates for Quadrant D Data is divided into 100 sec bins |
 |
 |
| Parameter | Plot |
|---|---|
| CZT HV Monitor | 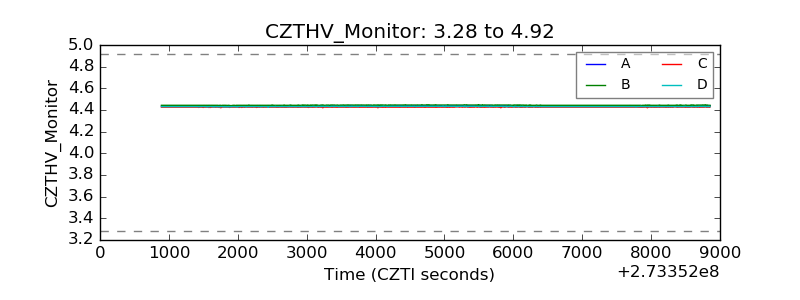 |
| D_VDD | 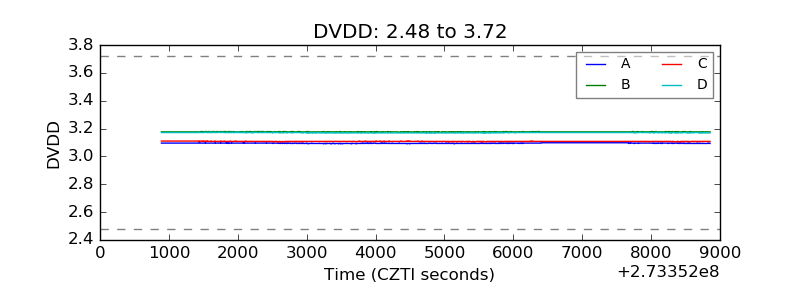 |
| Temperature 1 |  |
| Veto HV Monitor | 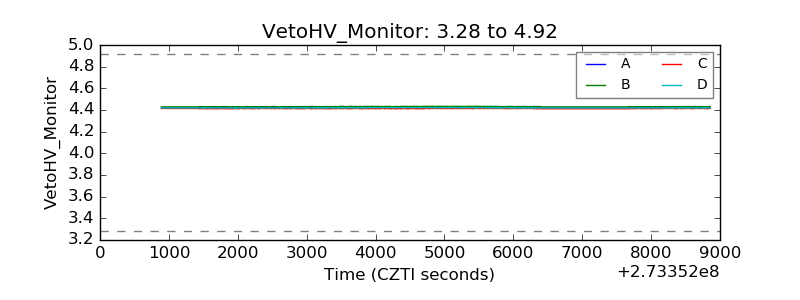 |
| Veto LLD | 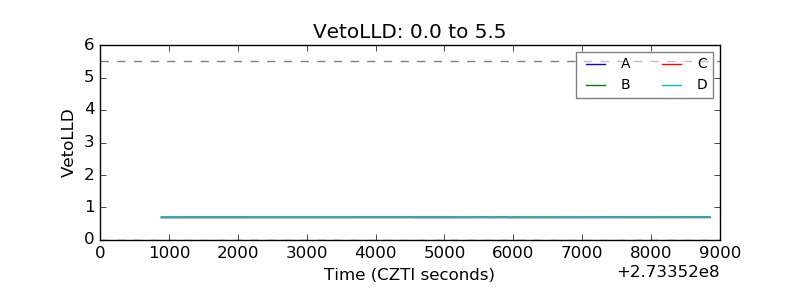 |
| Alpha Counter | 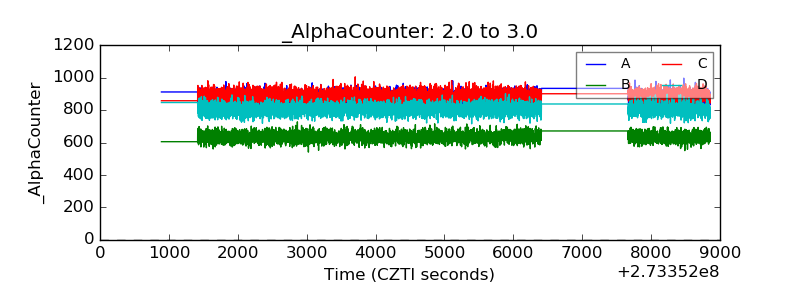 |
| _CPM_Rate | 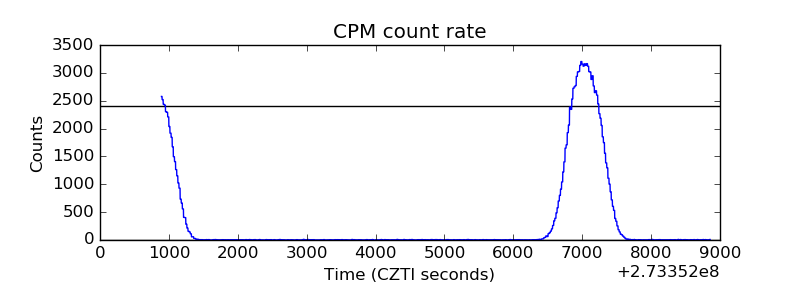 |
| CZT Counter | 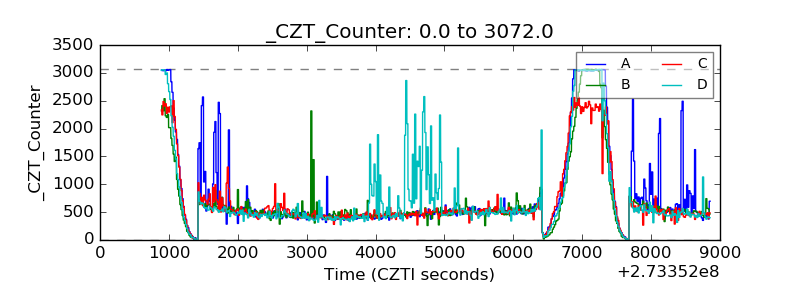 |
| +2.5 Volts monitor |  |
| +5 Volts monitor | 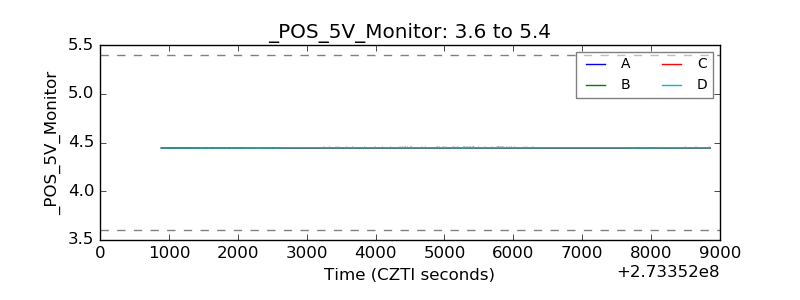 |
| _ROLL_ROT | 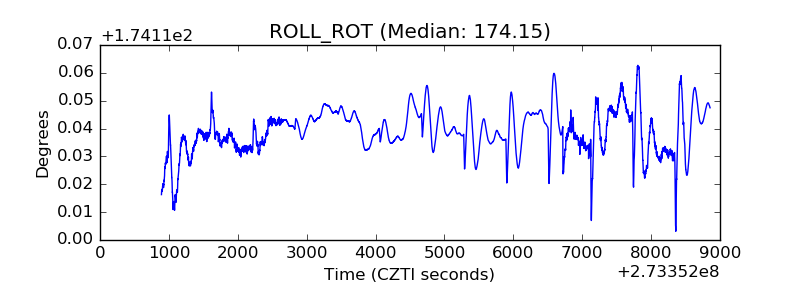 |
| _Roll_DEC | 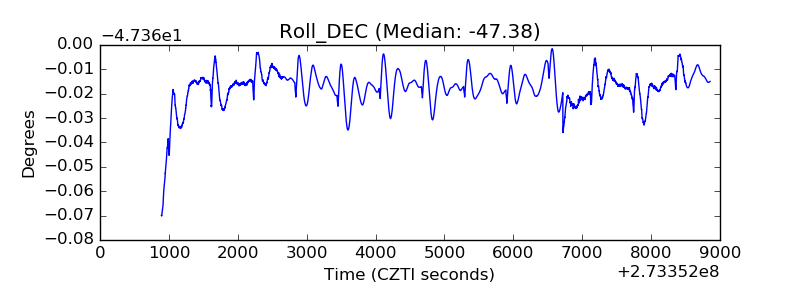 |
| _Roll_RA | 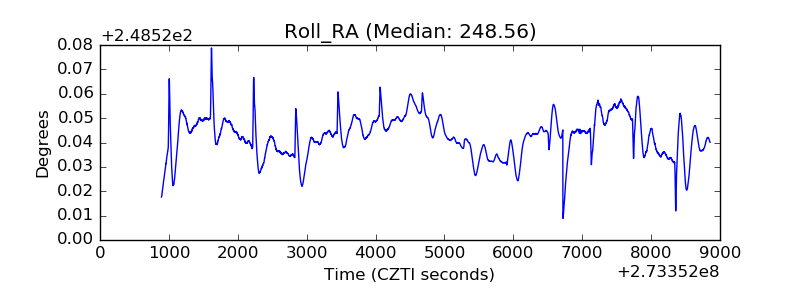 |
| Veto Counter | 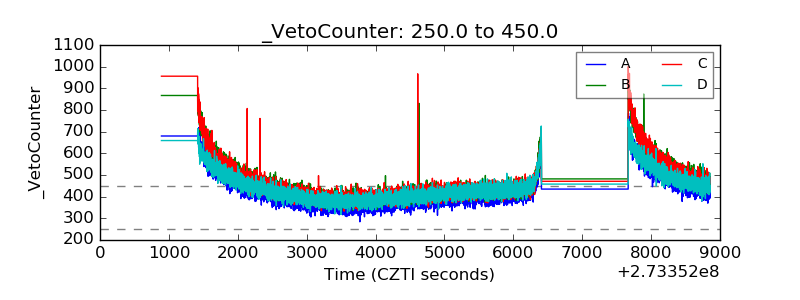 |