| Param | Original file | Final file |
|---|---|---|
| Filename | modeM0/AS1T02_097T01_9000002340_15805cztM0_level2.evt | modeM0/AS1T02_097T01_9000002340_15805cztM0_level2_quad_clean.evt |
| Size (bytes) | 440,743,680 | 87,425,280 |
| Size | 420.3 MB | 83.4 MB |
| Events in quadrant A | 3,497,148 | 552,406 |
| Events in quadrant B | 3,202,478 | 578,937 |
| Events in quadrant C | 3,073,277 | 555,288 |
| Events in quadrant D | 3,158,489 | 532,979 |
| Mode M9 | |||
|---|---|---|---|
| Quadrant | BADHDUFLAG | Total packets | Discarded packets |
| A | 0 | 26 | 0 |
| B | 0 | 26 | 0 |
| C | 0 | 26 | 0 |
| D | 0 | 26 | 0 |
| Mode M0 | |||
|---|---|---|---|
| Quadrant | BADHDUFLAG | Total packets | Discarded packets |
| A | 0 | 14277 | 3 |
| B | 0 | 13236 | 2 |
| C | 0 | 12800 | 2 |
| D | 0 | 13426 | 2 |
| Mode SS | |||
|---|---|---|---|
| Quadrant | BADHDUFLAG | Total packets | Discarded packets |
| A | 0 | 126 | 0 |
| B | 0 | 126 | 0 |
| C | 0 | 126 | 0 |
| D | 0 | 126 | 0 |
| Quadrant | Total seconds | Saturated seconds | Saturation percentage |
|---|---|---|---|
| A | 6131 | 130 | 2.120372% |
| B | 6131 | 26 | 0.424074% |
| C | 6131 | 37 | 0.603490% |
| D | 6131 | 79 | 1.288534% |
Noise dominated data is calculated using 1-second bins in cleaned event files. If a bin has >2000 counts, and if more than 50% of those come from <1% of pixels, then it is considered to be noise-dominated and hence unusable.
| Quadrant | # 1 sec bins | Bins with >0 counts | Bins with >2000 counts | High rate bins dominated by noise | Noise dominated (total time) | Noise dominated (detector-on time) | Marked lightcurve |
|---|---|---|---|---|---|---|---|
| A | 8752 | 6134 | 78 | 78 | 0.89% | 1.27% | 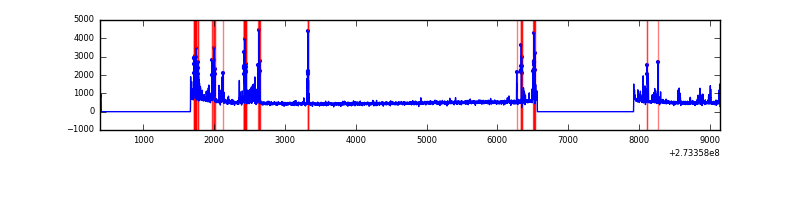 |
| B | 8752 | 6134 | 5 | 5 | 0.06% | 0.08% | 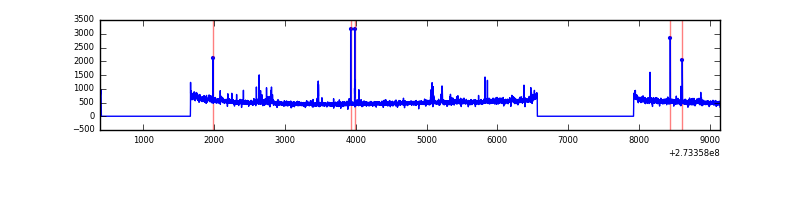 |
| C | 8752 | 6134 | 0 | 0 | 0.00% | 0.00% | 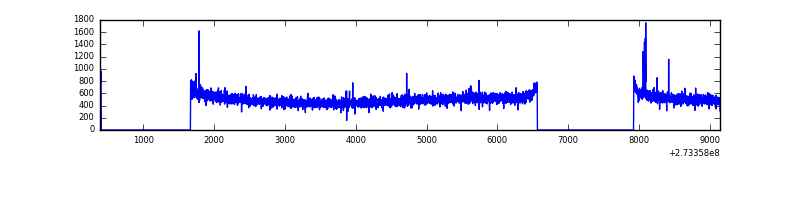 |
| D | 8752 | 6134 | 70 | 70 | 0.80% | 1.14% | 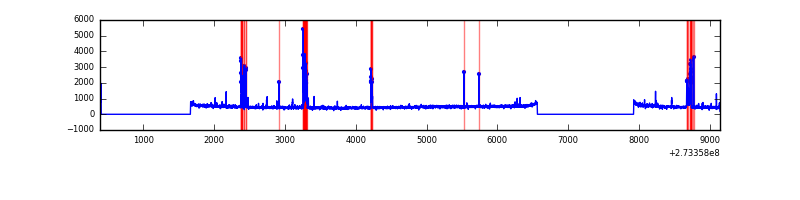 |
Top three noisy pixels from each quadrant. If the there are fewer than three noisy pixels in the level2.evt file, extra rows are filled as -1
| Pixel properties | Quadrant properties | ||||||
|---|---|---|---|---|---|---|---|
| Quadrant | DetID | PixID | Counts | Sigma | Mean | Median | Sigma |
| A | 15 | 239 | 502592 | 3292.98 | 770 | 756 | 152.4 |
| A | 7 | 16 | 28287 | 180.65 | 770 | 756 | 152.4 |
| A | 0 | 226 | 6780 | 39.53 | 770 | 756 | 152.4 |
| B | 4 | 173 | 50181 | 332.71 | 786 | 769 | 148.5 |
| B | 0 | 219 | 23330 | 151.91 | 786 | 769 | 148.5 |
| B | 0 | 229 | 22134 | 143.86 | 786 | 769 | 148.5 |
| C | 14 | 238 | 117895 | 677.71 | 749 | 754 | 172.8 |
| C | 15 | 127 | 19932 | 110.95 | 749 | 754 | 172.8 |
| C | 10 | 22 | 5568 | 27.85 | 749 | 754 | 172.8 |
| D | 7 | 223 | 212304 | 1174.77 | 746 | 724 | 180.1 |
| D | 10 | 70 | 64199 | 352.44 | 746 | 724 | 180.1 |
| D | 2 | 120 | 29147 | 157.81 | 746 | 724 | 180.1 |
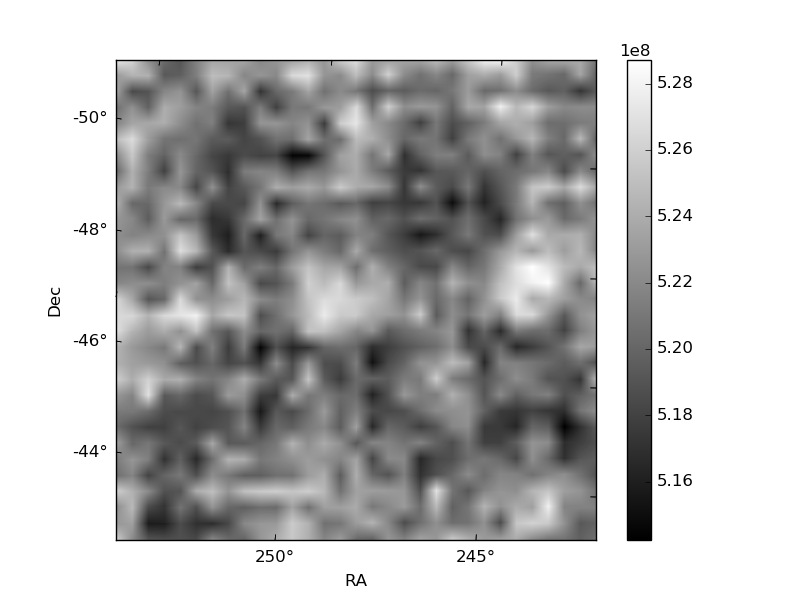
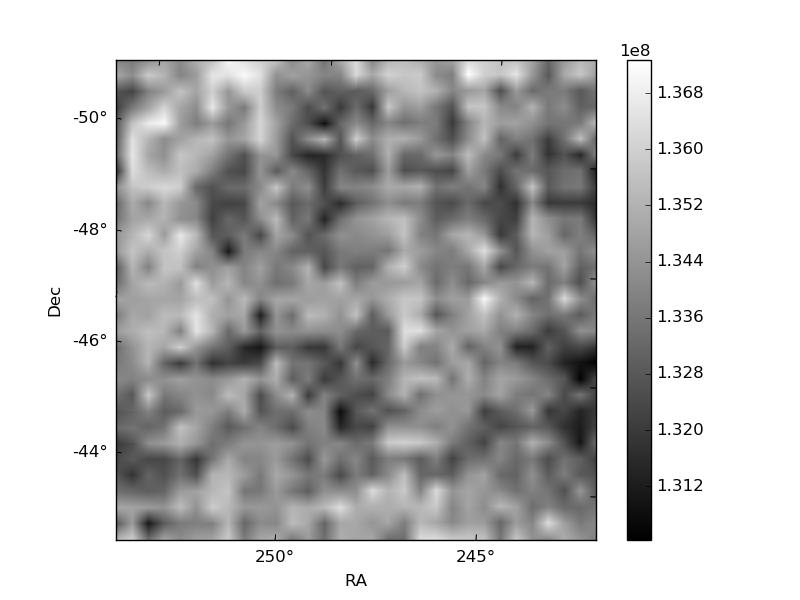
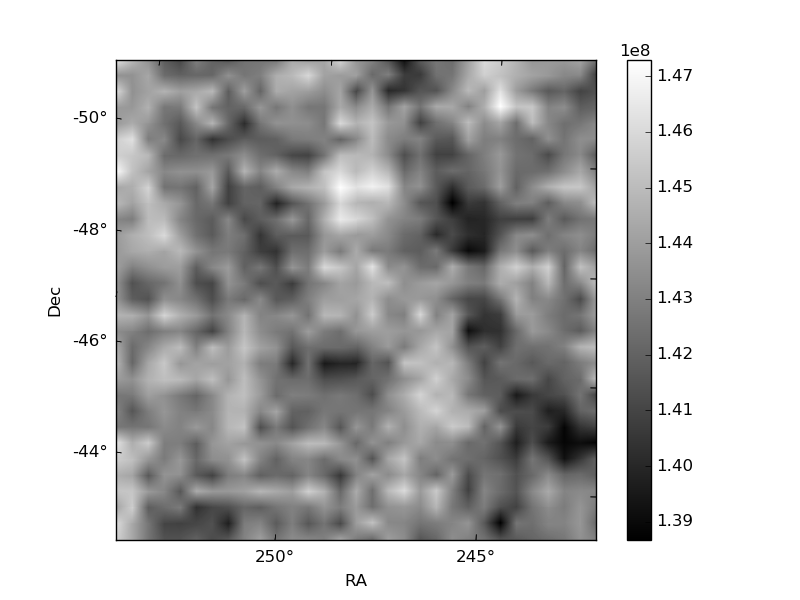
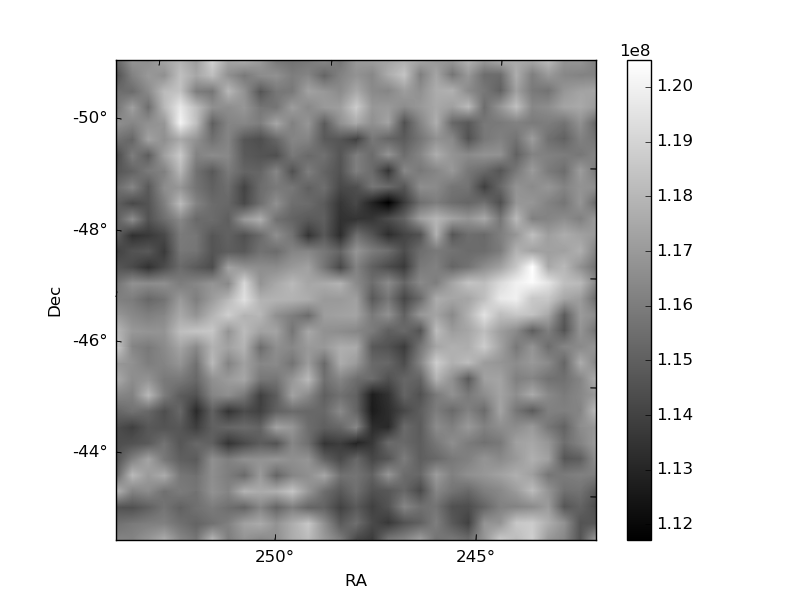
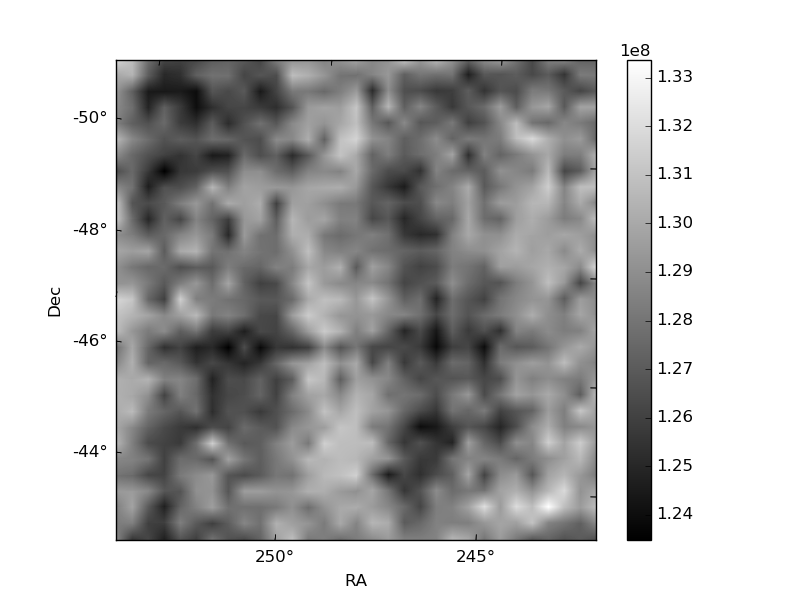
Histogram calculated using DETX and DETY for each event in the final _common_clean file
| Quadrant A | 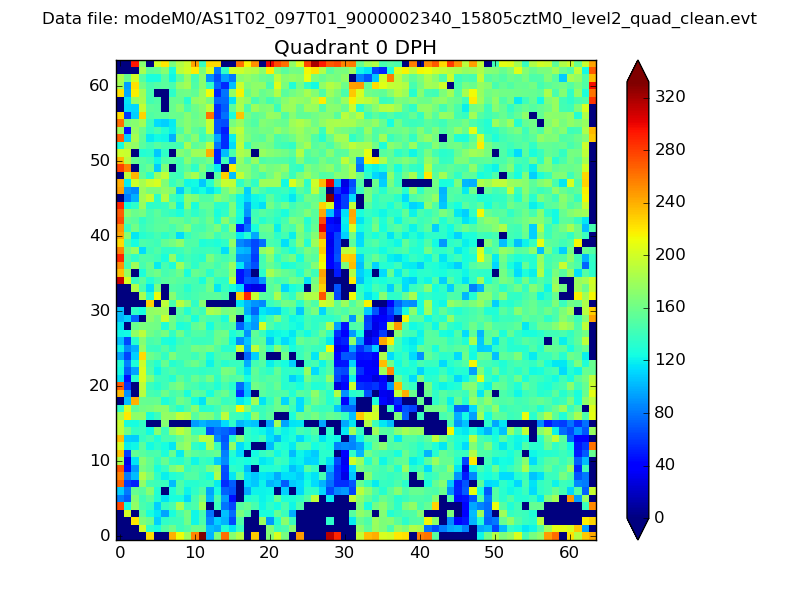 |
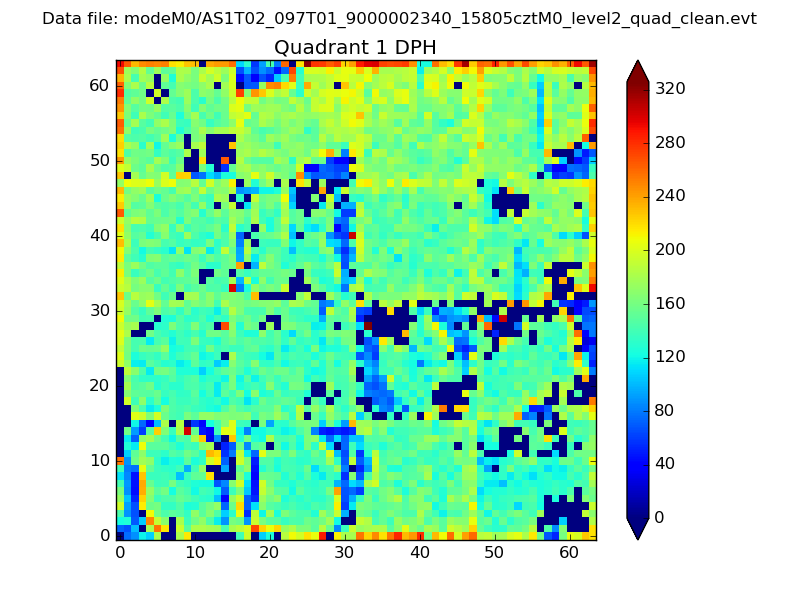 |
Quadrant B |
|---|---|---|---|
| Quadrant D |  |
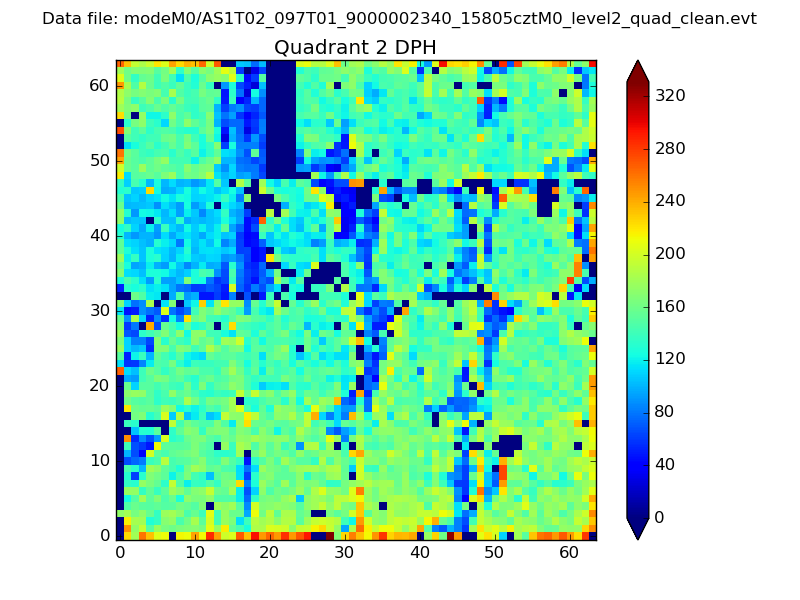 |
Quadrant C |
| Plot type | Count rate plots | Images |
|---|---|---|
| Comparison with Poisson distribution Blue bars denote a histogram of data divided into 1 sec bins. Red curve is a Poisson curve with rate = median count rate of data. |
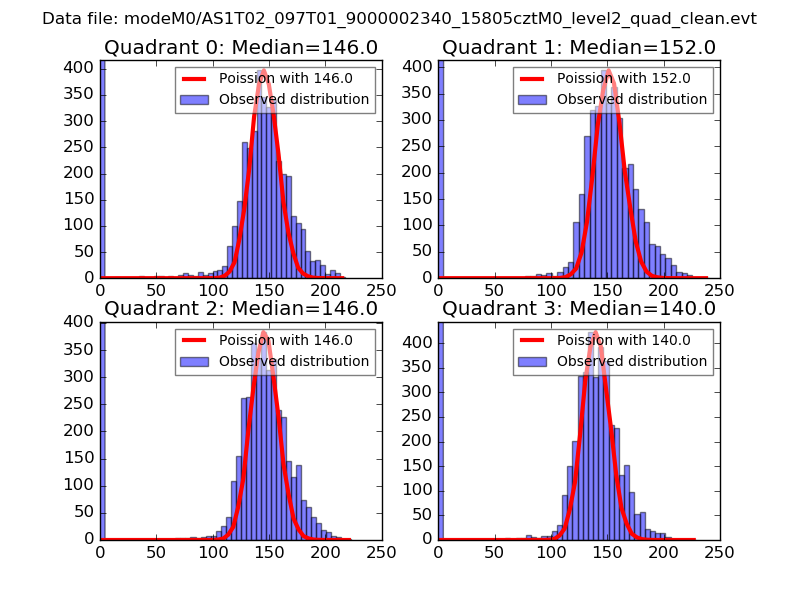 |
 |
| Quadrant-wise count rates Data is divided into 100 sec bins |
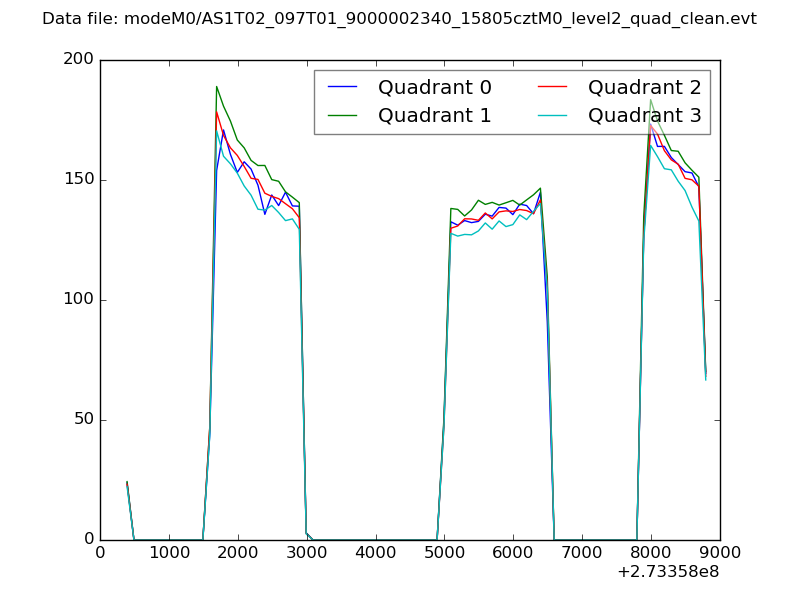 |
|
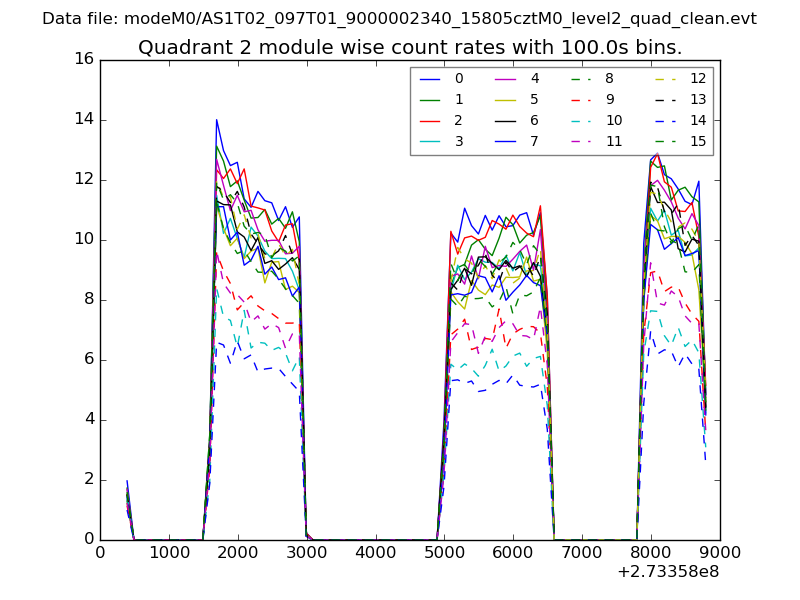
| Module-wise count rates for Quadrant A Data is divided into 100 sec bins |
 |
 |
| Module-wise count rates for Quadrant B Data is divided into 100 sec bins |
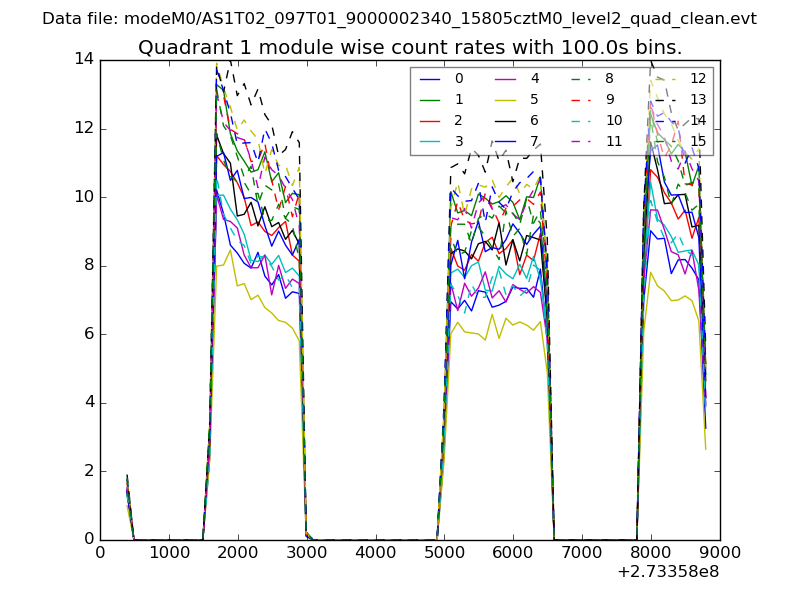 |
 |
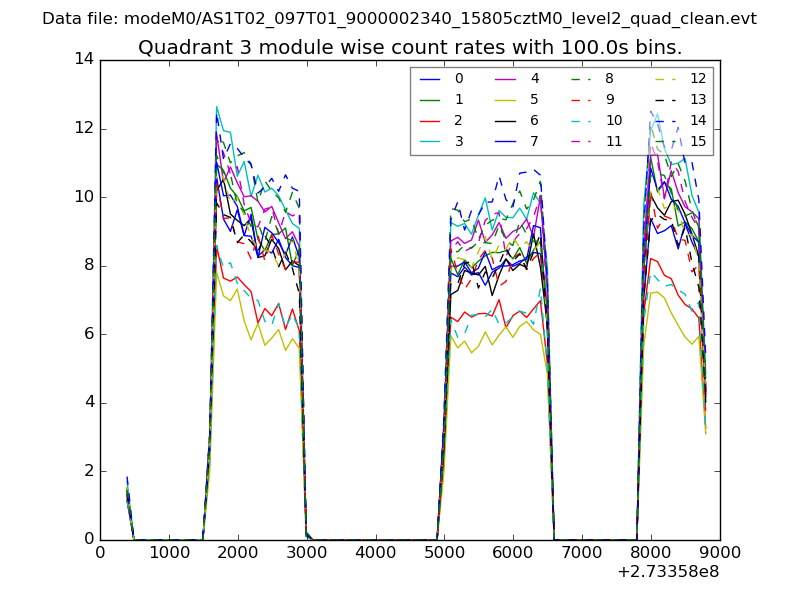
| Module-wise count rates for Quadrant C Data is divided into 100 sec bins |
 |
 |
| Module-wise count rates for Quadrant D Data is divided into 100 sec bins |
 |
 |
| Parameter | Plot |
|---|---|
| CZT HV Monitor | 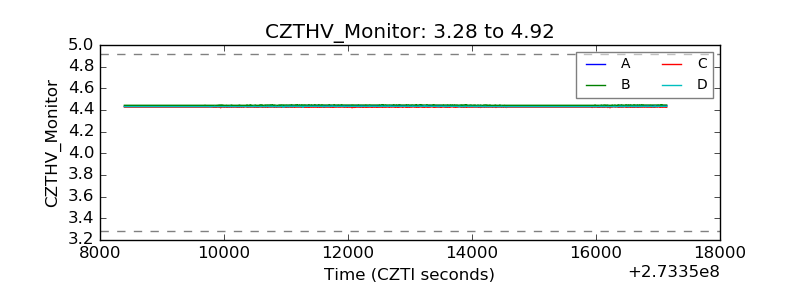 |
| D_VDD | 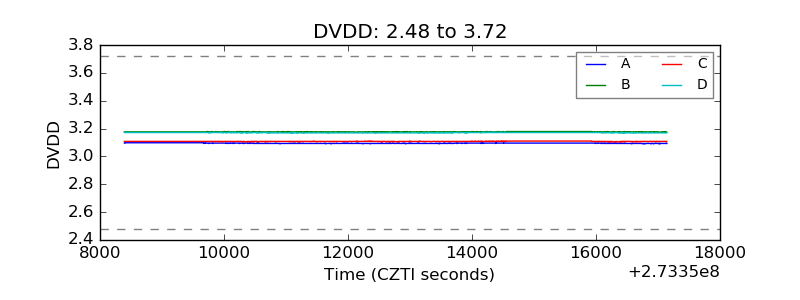 |
| Temperature 1 | 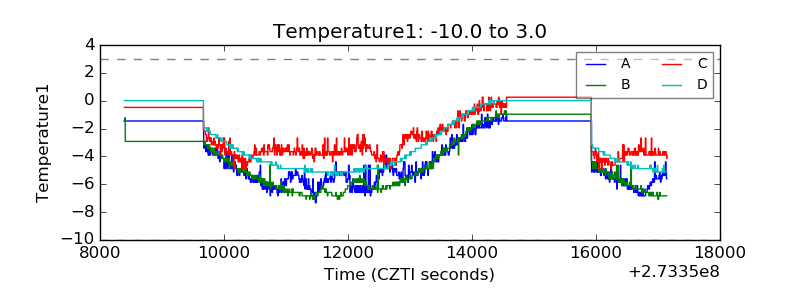 |
| Veto HV Monitor | 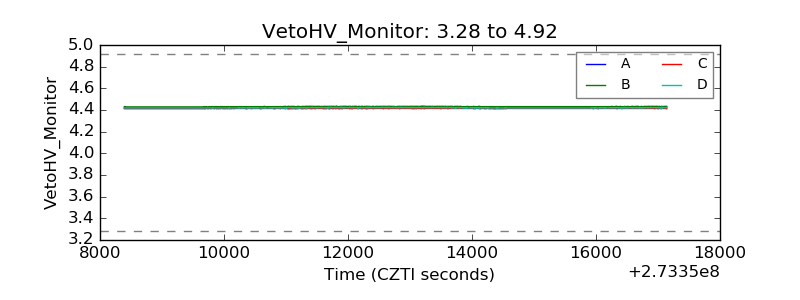 |
| Veto LLD | 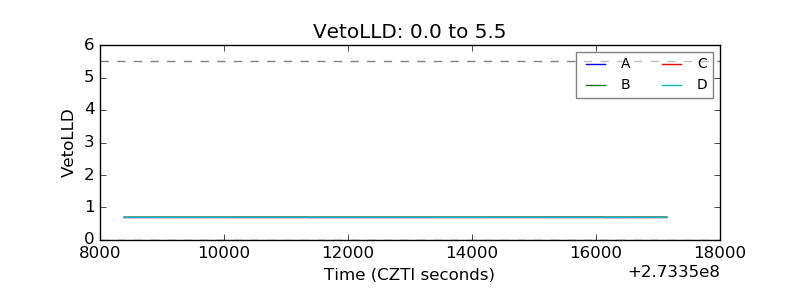 |
| Alpha Counter | 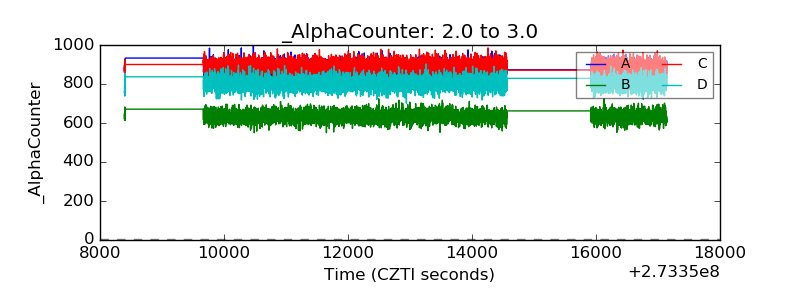 |
| _CPM_Rate | 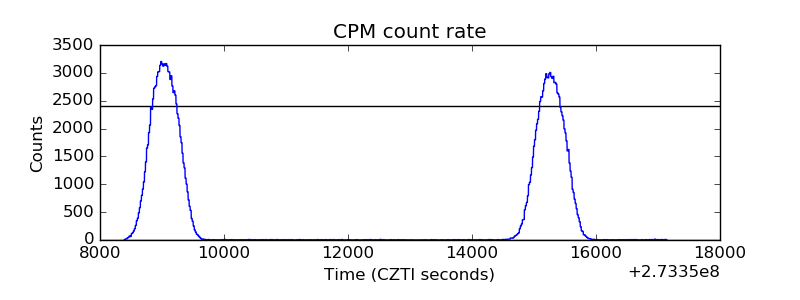 |
| CZT Counter | 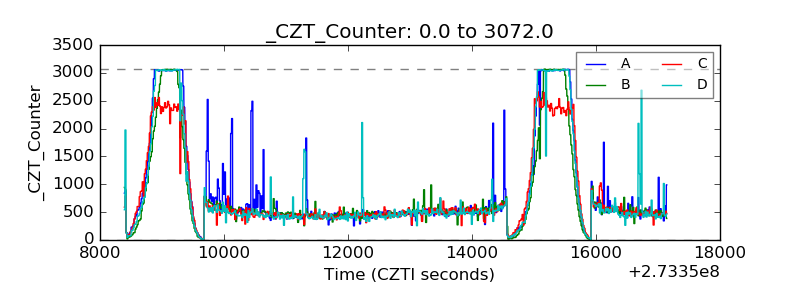 |
| +2.5 Volts monitor |  |
| +5 Volts monitor |  |
| _ROLL_ROT | 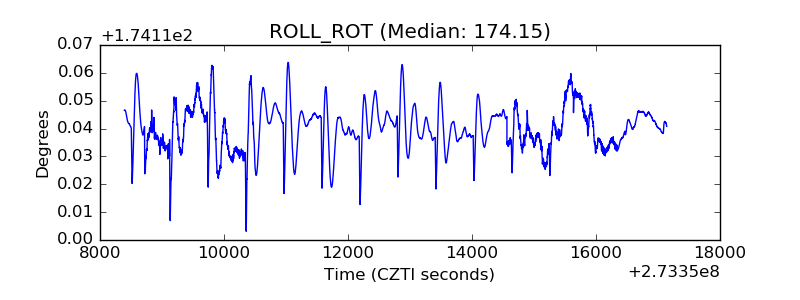 |
| _Roll_DEC | 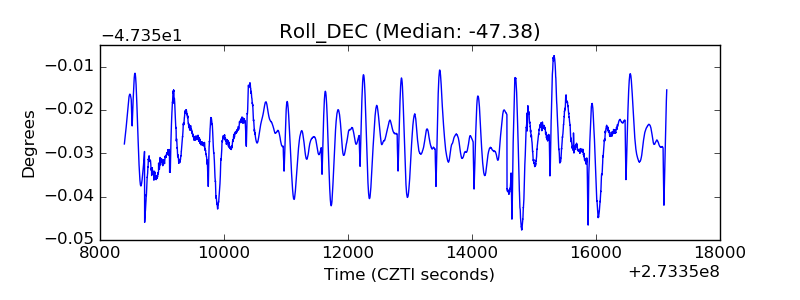 |
| _Roll_RA | 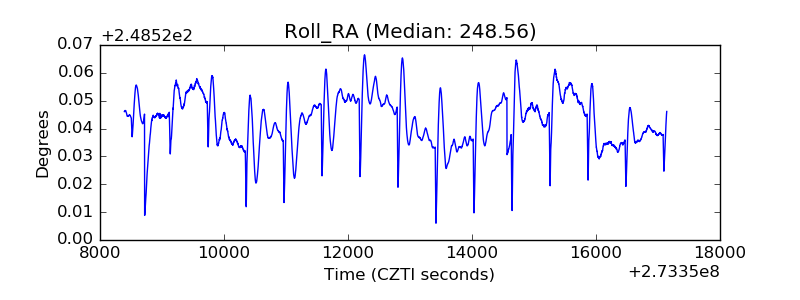 |
| Veto Counter | 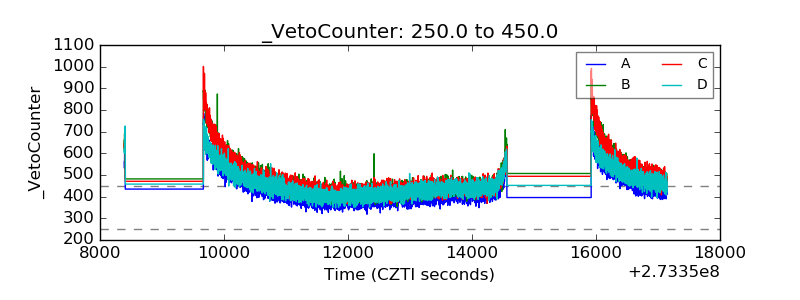 |