| Param | Original file | Final file |
|---|---|---|
| Filename | modeM0/AS1T02_097T01_9000002340_15806cztM0_level2.evt | modeM0/AS1T02_097T01_9000002340_15806cztM0_level2_quad_clean.evt |
| Size (bytes) | 445,446,720 | 79,171,200 |
| Size | 424.8 MB | 75.5 MB |
| Events in quadrant A | 3,573,908 | 490,140 |
| Events in quadrant B | 3,288,138 | 507,310 |
| Events in quadrant C | 3,121,174 | 493,393 |
| Events in quadrant D | 3,088,999 | 476,905 |
| Mode M9 | |||
|---|---|---|---|
| Quadrant | BADHDUFLAG | Total packets | Discarded packets |
| A | 0 | 22 | 0 |
| B | 0 | 22 | 0 |
| C | 0 | 22 | 0 |
| D | 0 | 23 | 0 |
| Mode M0 | |||
|---|---|---|---|
| Quadrant | BADHDUFLAG | Total packets | Discarded packets |
| A | 0 | 14477 | 3 |
| B | 0 | 13411 | 2 |
| C | 0 | 12822 | 2 |
| D | 0 | 13135 | 2 |
| Mode SS | |||
|---|---|---|---|
| Quadrant | BADHDUFLAG | Total packets | Discarded packets |
| A | 0 | 126 | 0 |
| B | 0 | 126 | 0 |
| C | 0 | 126 | 0 |
| D | 0 | 126 | 0 |
| Quadrant | Total seconds | Saturated seconds | Saturation percentage |
|---|---|---|---|
| A | 6151 | 133 | 2.162250% |
| B | 6151 | 65 | 1.056739% |
| C | 6151 | 44 | 0.715331% |
| D | 6151 | 26 | 0.422695% |
Noise dominated data is calculated using 1-second bins in cleaned event files. If a bin has >2000 counts, and if more than 50% of those come from <1% of pixels, then it is considered to be noise-dominated and hence unusable.
| Quadrant | # 1 sec bins | Bins with >0 counts | Bins with >2000 counts | High rate bins dominated by noise | Noise dominated (total time) | Noise dominated (detector-on time) | Marked lightcurve |
|---|---|---|---|---|---|---|---|
| A | 7497 | 6153 | 65 | 65 | 0.87% | 1.06% | 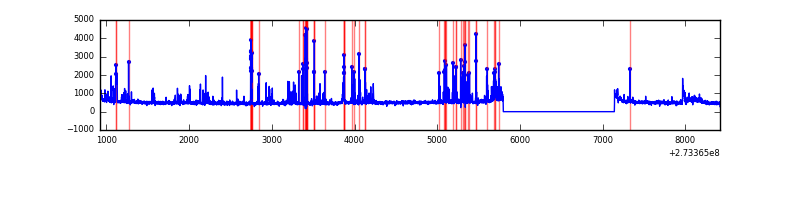 |
| B | 7497 | 6153 | 22 | 22 | 0.29% | 0.36% | 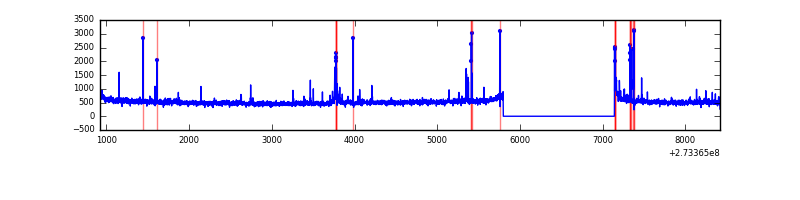 |
| C | 7497 | 6153 | 0 | 0 | 0.00% | 0.00% | 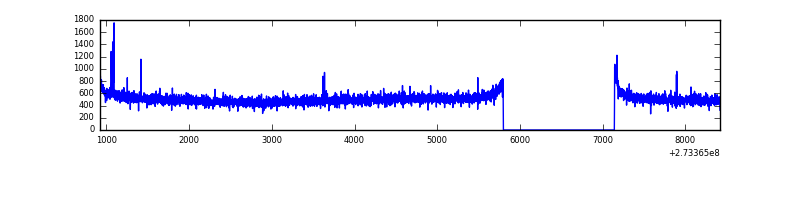 |
| D | 7497 | 6153 | 19 | 19 | 0.25% | 0.31% | 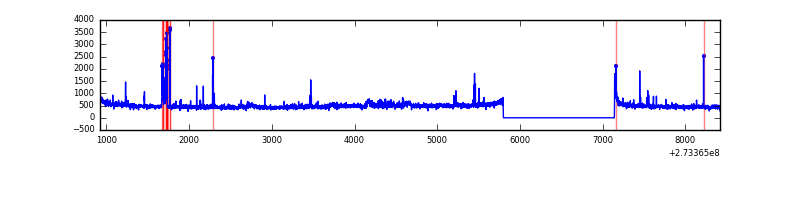 |
Top three noisy pixels from each quadrant. If the there are fewer than three noisy pixels in the level2.evt file, extra rows are filled as -1
| Pixel properties | Quadrant properties | ||||||
|---|---|---|---|---|---|---|---|
| Quadrant | DetID | PixID | Counts | Sigma | Mean | Median | Sigma |
| A | 15 | 239 | 580531 | 3723.1 | 774 | 760 | 155.7 |
| A | 15 | 174 | 7382 | 42.52 | 774 | 760 | 155.7 |
| A | 0 | 226 | 6845 | 39.08 | 774 | 760 | 155.7 |
| B | 4 | 173 | 109487 | 738.52 | 788 | 770 | 147.2 |
| B | 4 | 48 | 21067 | 137.88 | 788 | 770 | 147.2 |
| B | 0 | 229 | 18031 | 117.26 | 788 | 770 | 147.2 |
| C | 14 | 238 | 117643 | 667.35 | 759 | 766 | 175.1 |
| C | 15 | 127 | 22222 | 122.51 | 759 | 766 | 175.1 |
| C | 3 | 233 | 9492 | 49.82 | 759 | 766 | 175.1 |
| D | 7 | 223 | 161938 | 887.47 | 755 | 734 | 181.6 |
| D | 2 | 120 | 26045 | 139.34 | 755 | 734 | 181.6 |
| D | 2 | 234 | 22791 | 121.43 | 755 | 734 | 181.6 |
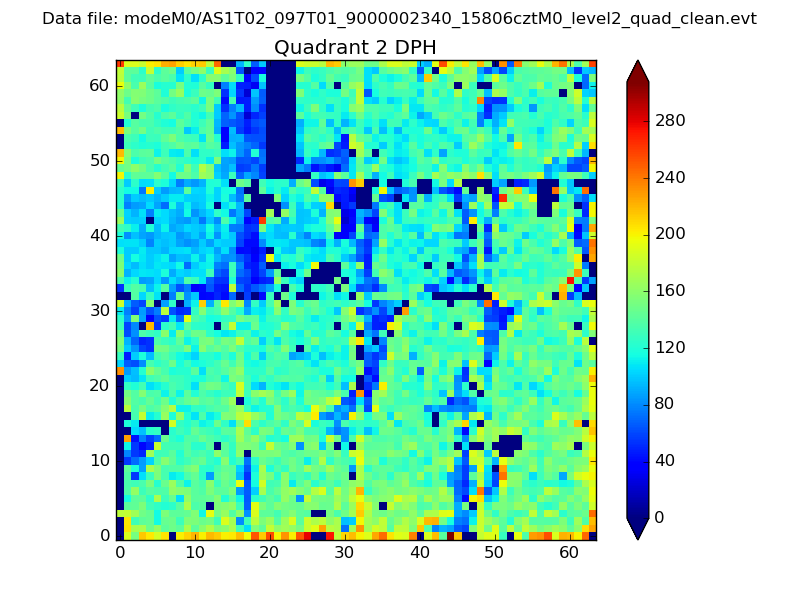
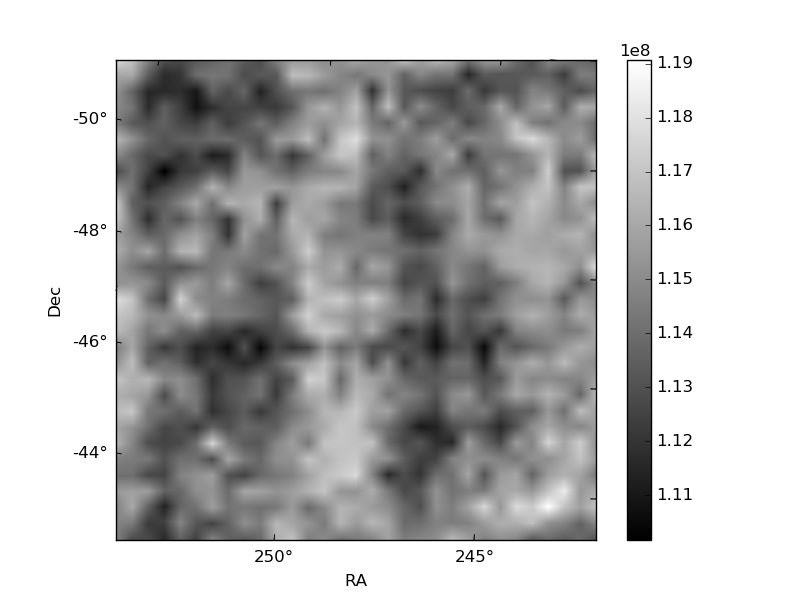
Histogram calculated using DETX and DETY for each event in the final _common_clean file
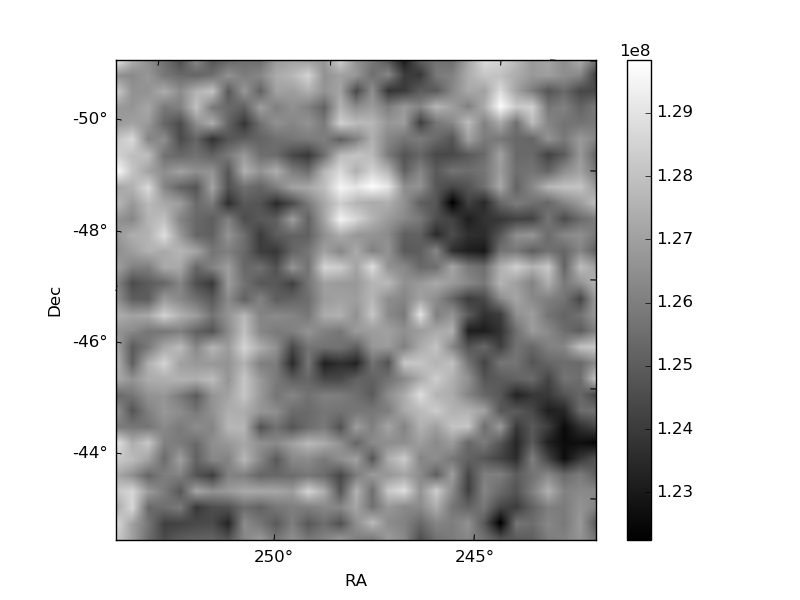
| Quadrant A | 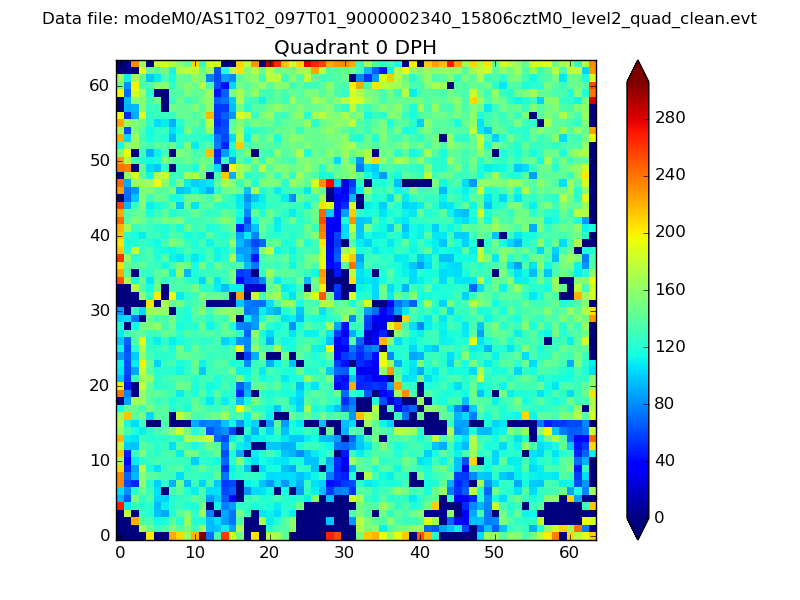 |
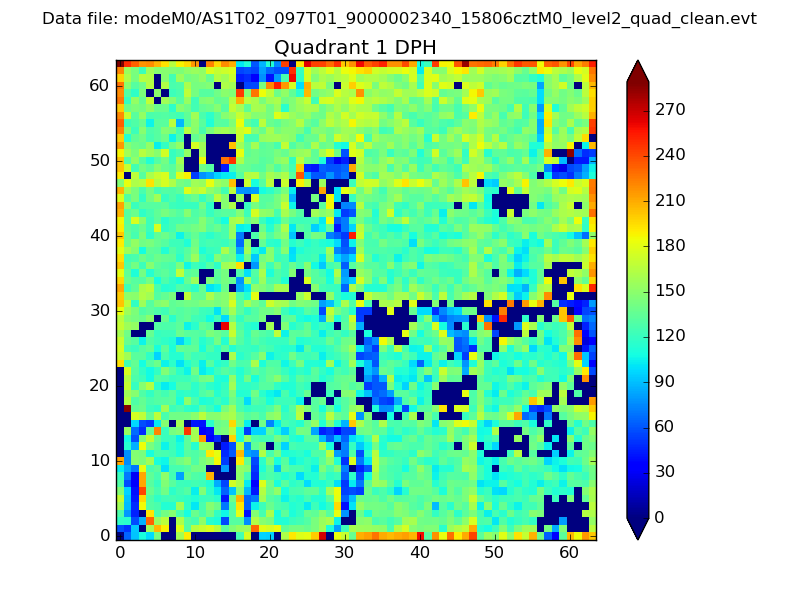 |
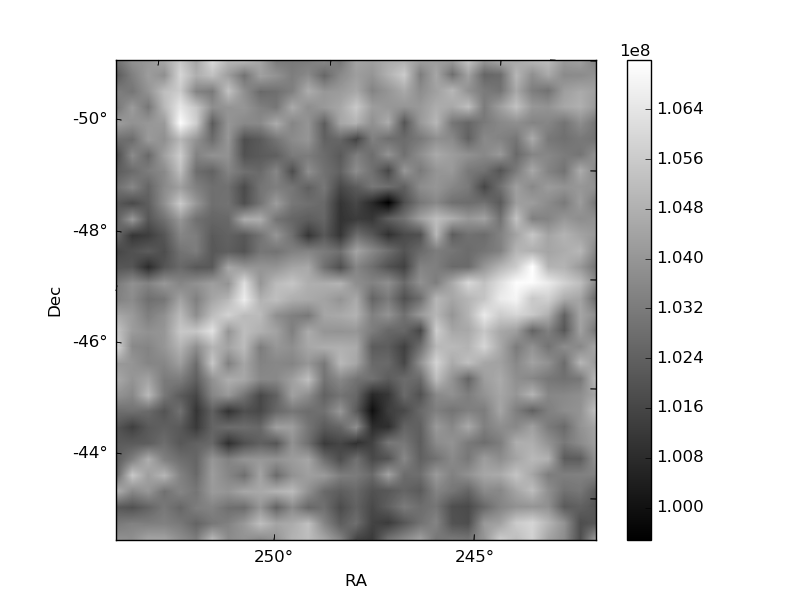
Quadrant B |
|---|---|---|---|
| Quadrant D | 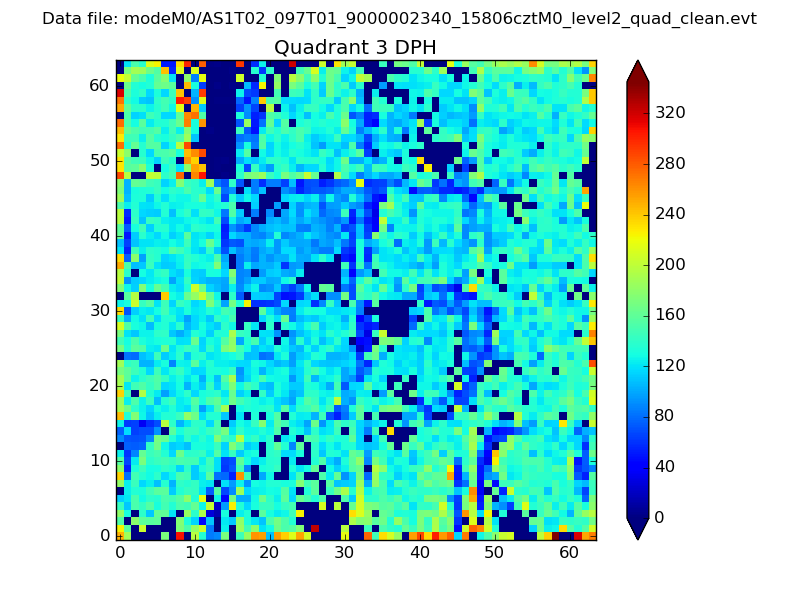 |
 |
Quadrant C |
| Plot type | Count rate plots | Images |
|---|---|---|
| Comparison with Poisson distribution Blue bars denote a histogram of data divided into 1 sec bins. Red curve is a Poisson curve with rate = median count rate of data. |
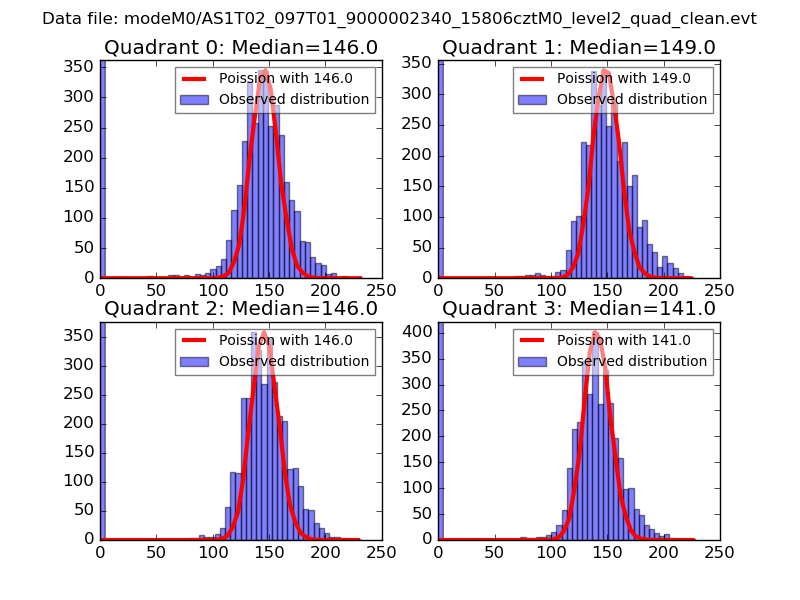 |
 |
| Quadrant-wise count rates Data is divided into 100 sec bins |
 |
|
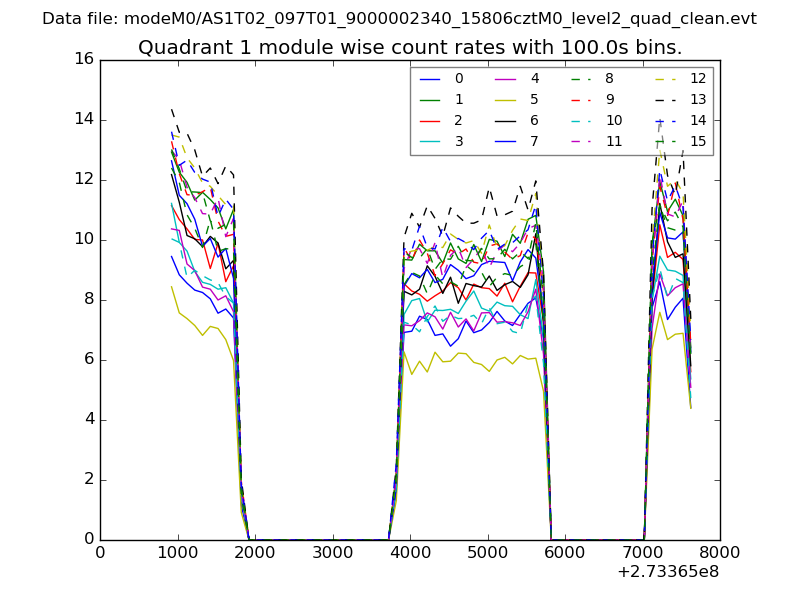
| Module-wise count rates for Quadrant A Data is divided into 100 sec bins |
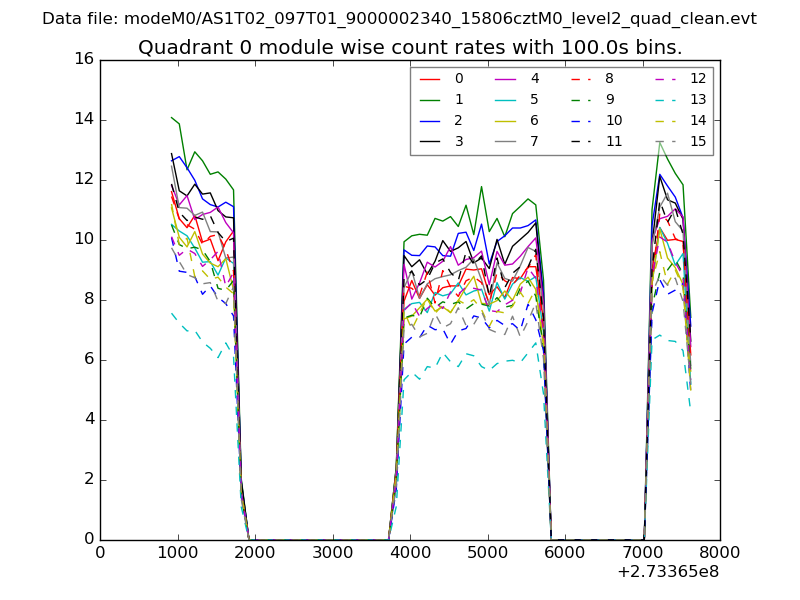 |
 |
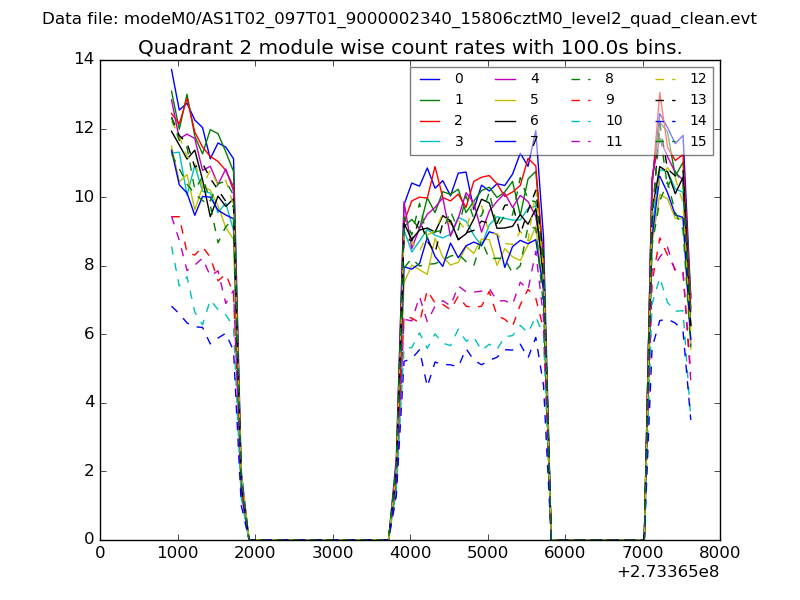
| Module-wise count rates for Quadrant B Data is divided into 100 sec bins |
 |
 |
| Module-wise count rates for Quadrant C Data is divided into 100 sec bins |
 |
 |
| Module-wise count rates for Quadrant D Data is divided into 100 sec bins |
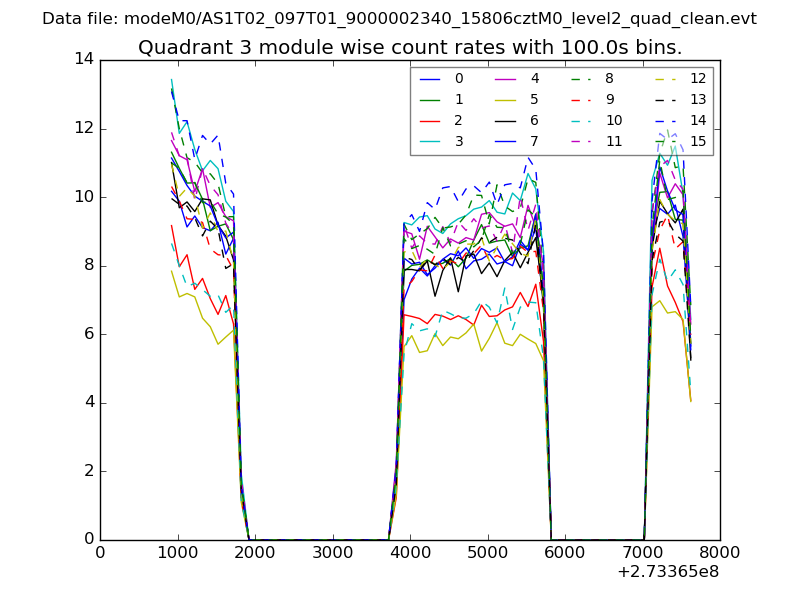 |
 |
| Parameter | Plot |
|---|---|
| CZT HV Monitor | 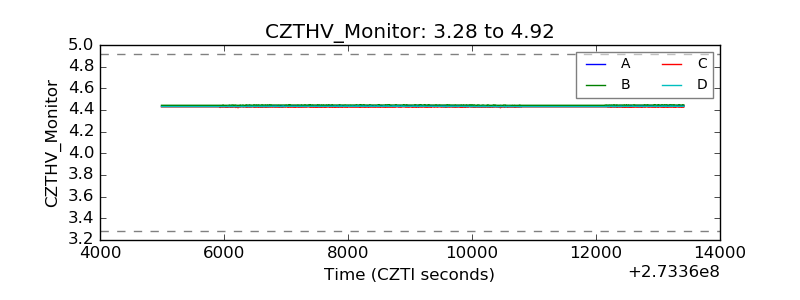 |
| D_VDD | 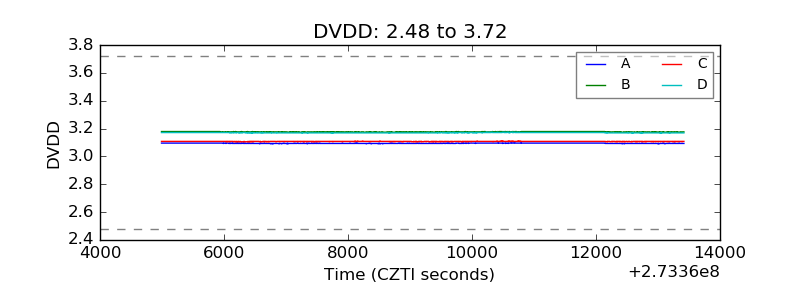 |
| Temperature 1 | 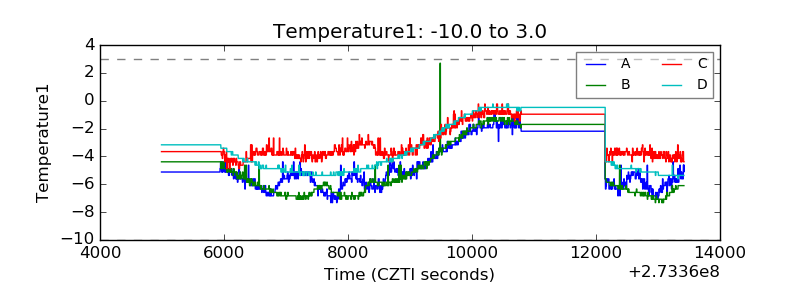 |
| Veto HV Monitor | 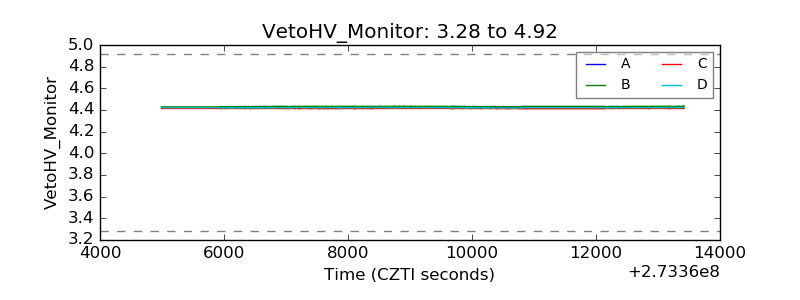 |
| Veto LLD | 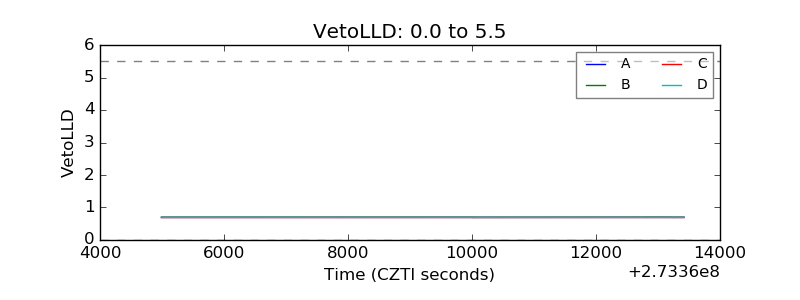 |
| Alpha Counter | 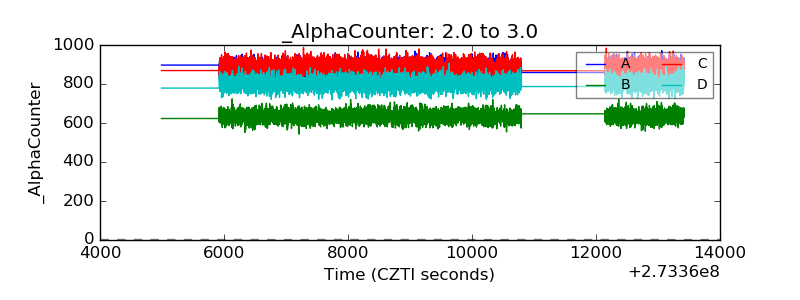 |
| _CPM_Rate |  |
| CZT Counter | 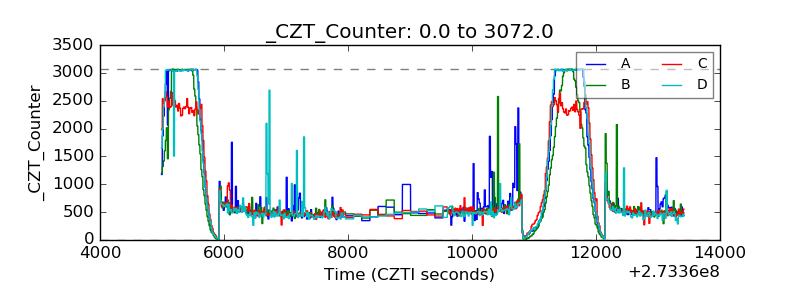 |
| +2.5 Volts monitor |  |
| +5 Volts monitor |  |
| _ROLL_ROT | 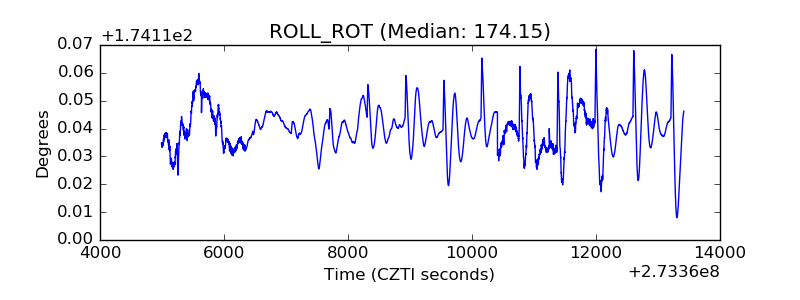 |
| _Roll_DEC | 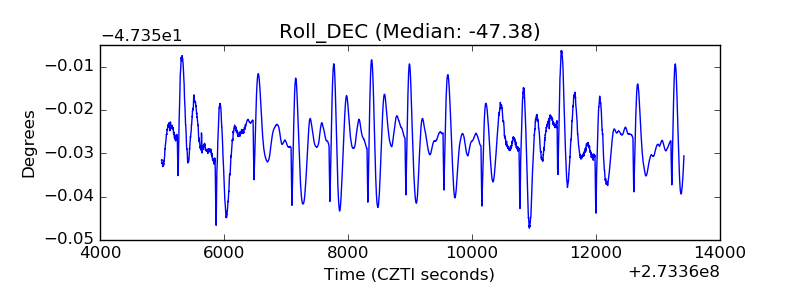 |
| _Roll_RA | 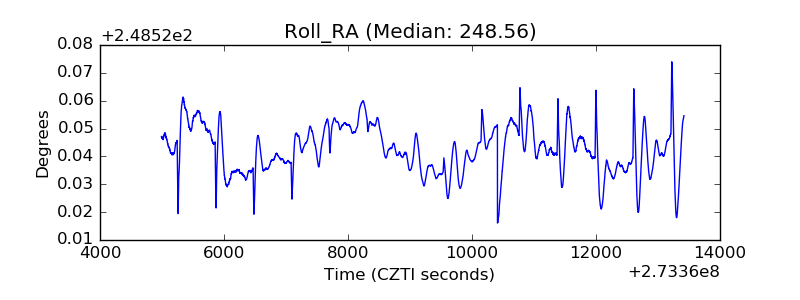 |
| Veto Counter | 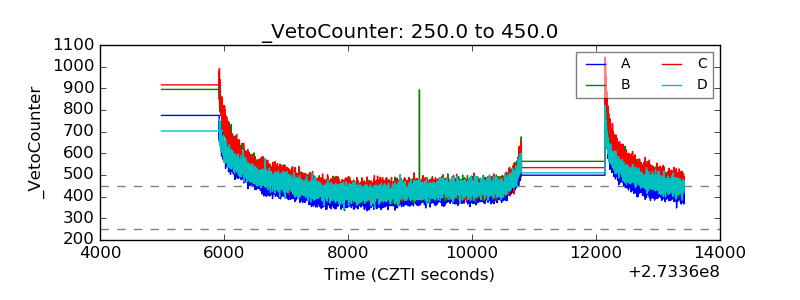 |