| Param | Original file | Final file |
|---|---|---|
| Filename | modeM0/AS1T02_097T01_9000002340_15808cztM0_level2.evt | modeM0/AS1T02_097T01_9000002340_15808cztM0_level2_quad_clean.evt |
| Size (bytes) | 227,160,000 | 31,245,120 |
| Size | 216.6 MB | 29.8 MB |
| Events in quadrant A | 1,673,399 | 176,759 |
| Events in quadrant B | 1,594,001 | 180,563 |
| Events in quadrant C | 1,636,118 | 177,381 |
| Events in quadrant D | 1,743,941 | 170,537 |
| Mode M0 | |||
|---|---|---|---|
| Quadrant | BADHDUFLAG | Total packets | Discarded packets |
| A | 0 | 7105 | 0 |
| B | 0 | 6862 | 0 |
| C | 0 | 6883 | 0 |
| D | 0 | 7535 | 0 |
| Mode SS | |||
|---|---|---|---|
| Quadrant | BADHDUFLAG | Total packets | Discarded packets |
| A | 0 | 68 | 0 |
| B | 0 | 68 | 0 |
| C | 0 | 68 | 0 |
| D | 0 | 68 | 0 |
| Quadrant | Total seconds | Saturated seconds | Saturation percentage |
|---|---|---|---|
| A | 3386 | 11 | 0.324867% |
| B | 3386 | 1 | 0.029533% |
| C | 3386 | 11 | 0.324867% |
| D | 3386 | 1 | 0.029533% |
Noise dominated data is calculated using 1-second bins in cleaned event files. If a bin has >2000 counts, and if more than 50% of those come from <1% of pixels, then it is considered to be noise-dominated and hence unusable.
| Quadrant | # 1 sec bins | Bins with >0 counts | Bins with >2000 counts | High rate bins dominated by noise | Noise dominated (total time) | Noise dominated (detector-on time) | Marked lightcurve |
|---|---|---|---|---|---|---|---|
| A | 3387 | 3387 | 6 | 6 | 0.18% | 0.18% | 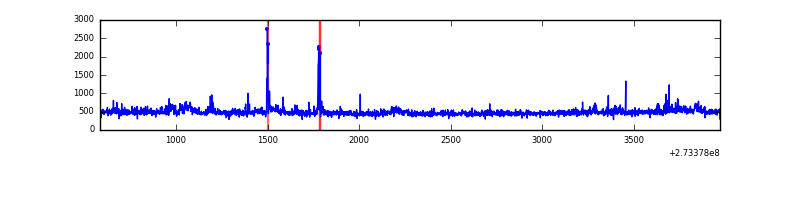 |
| B | 3387 | 3387 | 0 | 0 | 0.00% | 0.00% | 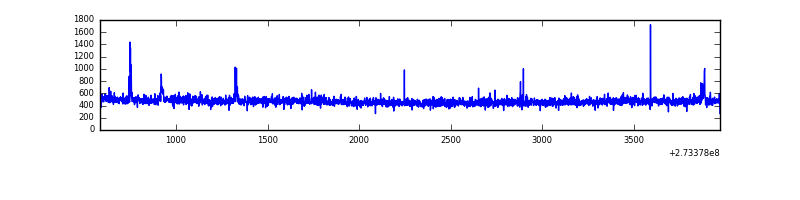 |
| C | 3387 | 3387 | 0 | 0 | 0.00% | 0.00% | 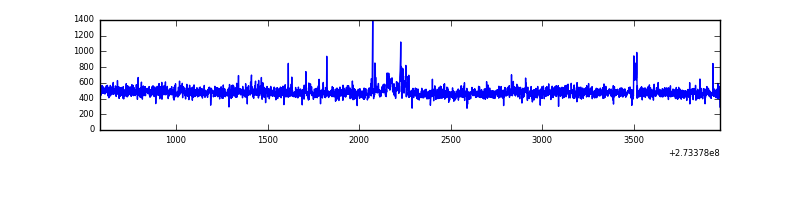 |
| D | 3387 | 3387 | 1 | 1 | 0.03% | 0.03% | 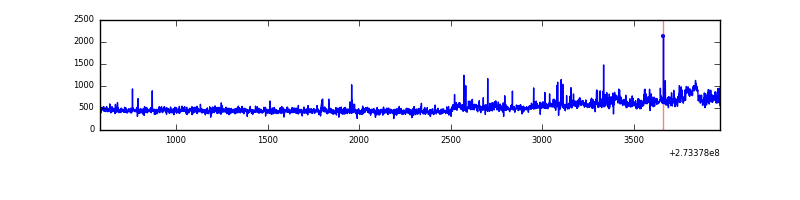 |
Top three noisy pixels from each quadrant. If the there are fewer than three noisy pixels in the level2.evt file, extra rows are filled as -1
| Pixel properties | Quadrant properties | ||||||
|---|---|---|---|---|---|---|---|
| Quadrant | DetID | PixID | Counts | Sigma | Mean | Median | Sigma |
| A | 15 | 239 | 136864 | 1669.87 | 399 | 390 | 81.7 |
| A | 0 | 226 | 3490 | 37.93 | 399 | 390 | 81.7 |
| A | 12 | 194 | 2975 | 31.63 | 399 | 390 | 81.7 |
| B | 4 | 173 | 17338 | 220.34 | 401 | 391 | 76.9 |
| B | 12 | 111 | 8715 | 108.22 | 401 | 391 | 76.9 |
| B | 11 | 111 | 7524 | 92.74 | 401 | 391 | 76.9 |
| C | 14 | 238 | 62784 | 688.96 | 392 | 395 | 90.6 |
| C | 15 | 127 | 33665 | 367.4 | 392 | 395 | 90.6 |
| C | 7 | 247 | 4871 | 49.43 | 392 | 395 | 90.6 |
| D | 12 | 144 | 240280 | 2500.68 | 390 | 379 | 95.9 |
| D | 2 | 136 | 13948 | 141.44 | 390 | 379 | 95.9 |
| D | 2 | 234 | 13098 | 132.58 | 390 | 379 | 95.9 |
Histogram calculated using DETX and DETY for each event in the final _common_clean file
| Quadrant A | 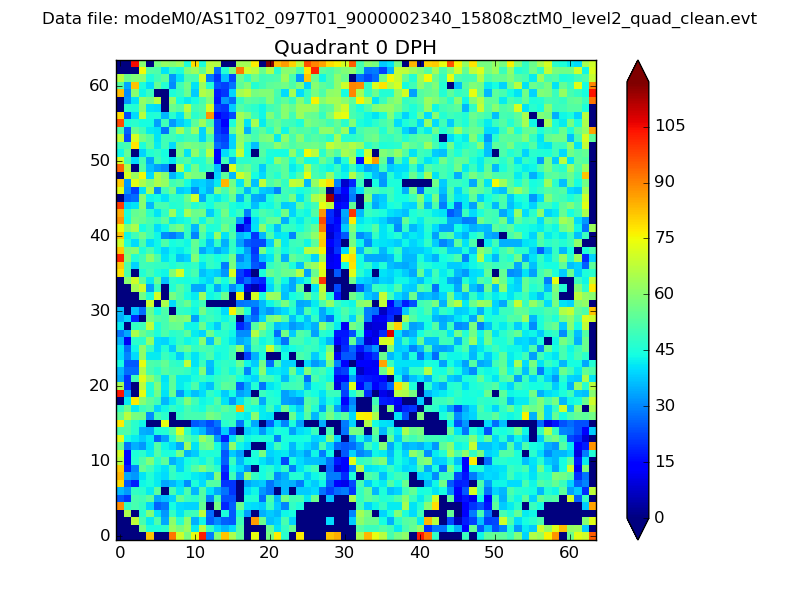 |
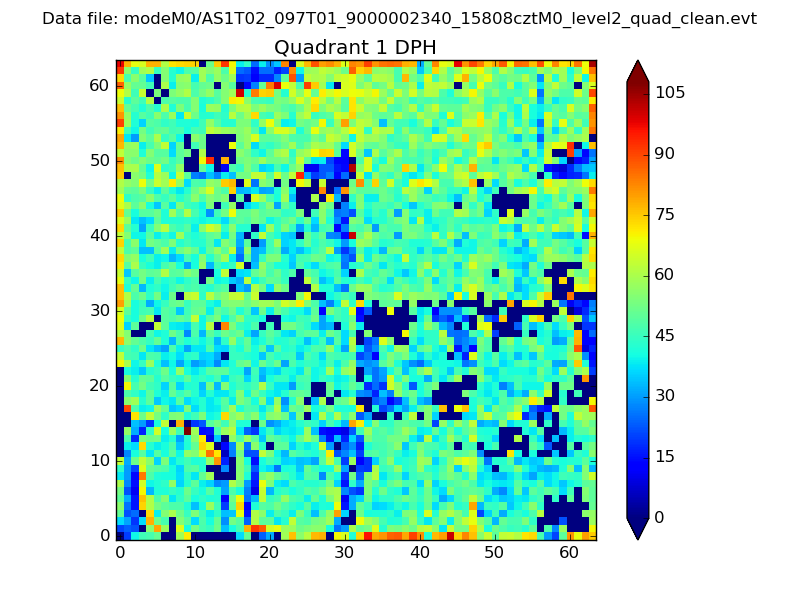 |
Quadrant B |
|---|---|---|---|
| Quadrant D | 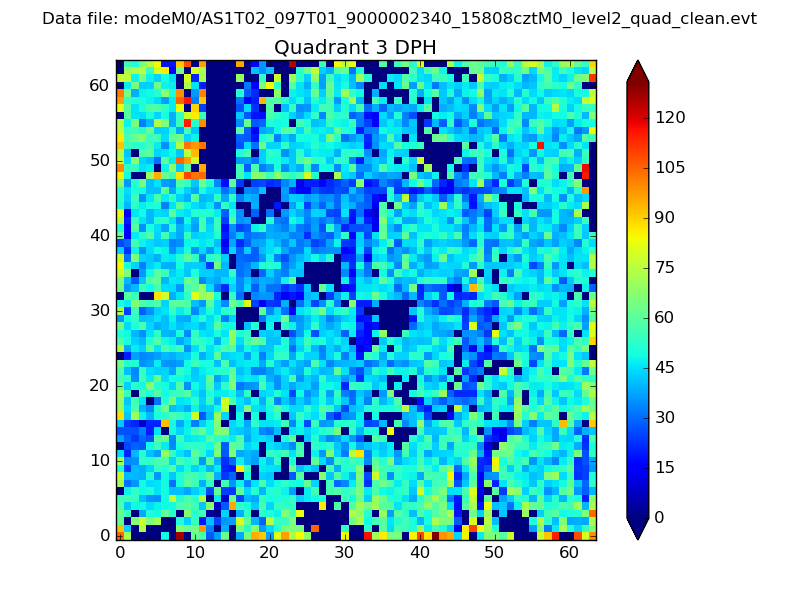 |
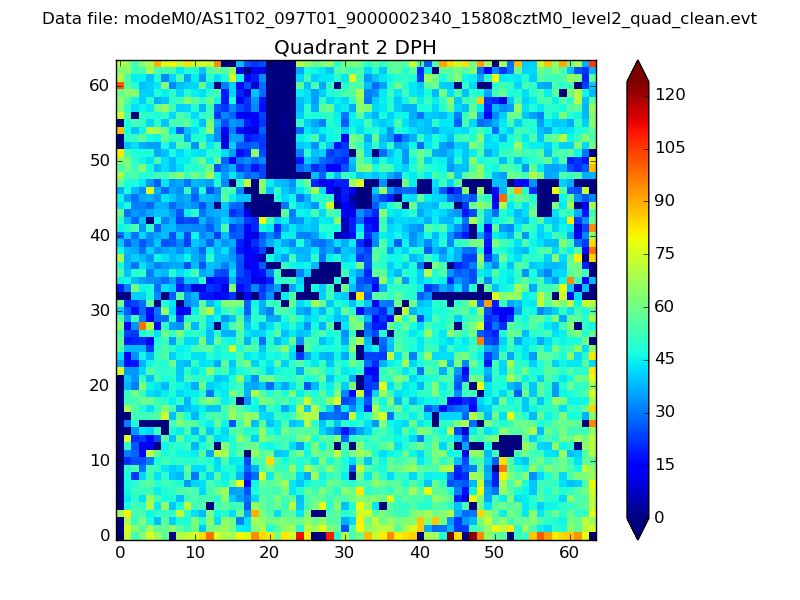 |
Quadrant C |
| Plot type | Count rate plots | Images |
|---|---|---|
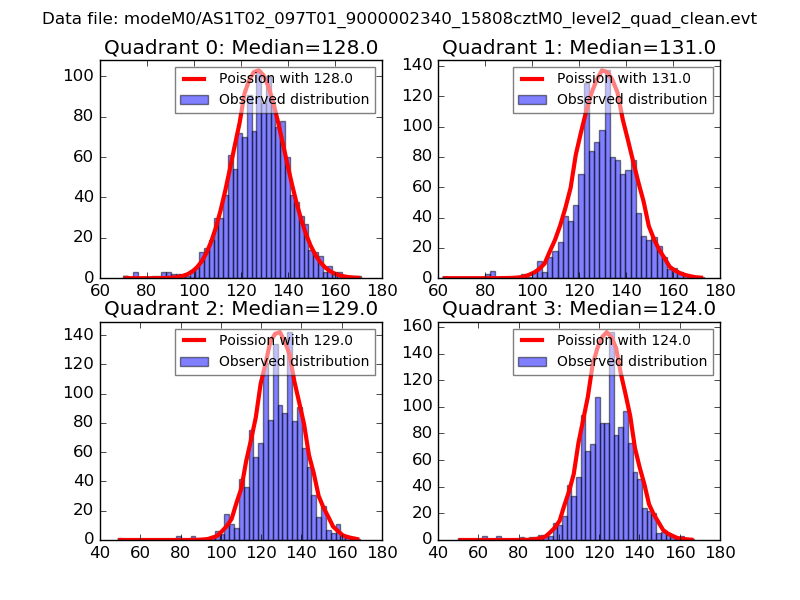
| Comparison with Poisson distribution Blue bars denote a histogram of data divided into 1 sec bins. Red curve is a Poisson curve with rate = median count rate of data. |
 |
 |
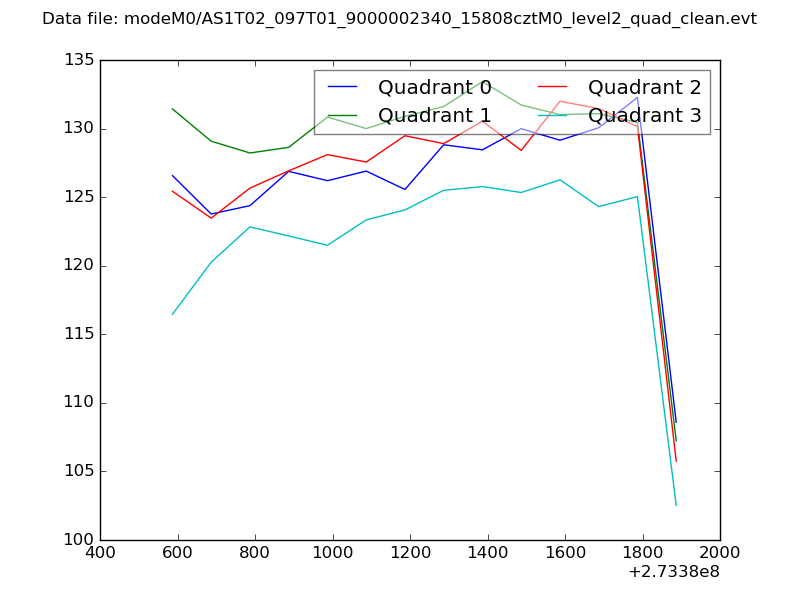
| Quadrant-wise count rates Data is divided into 100 sec bins |
 |
|
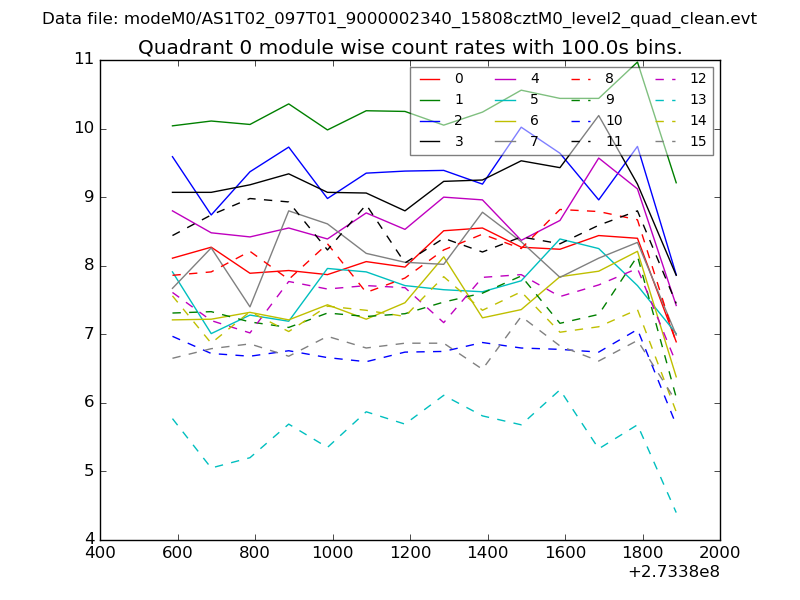
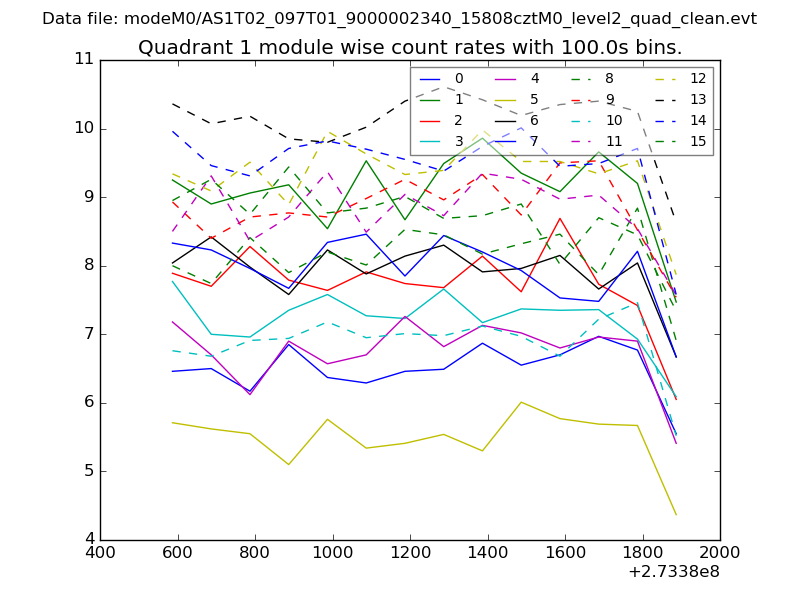
| Module-wise count rates for Quadrant A Data is divided into 100 sec bins |
 |
 |
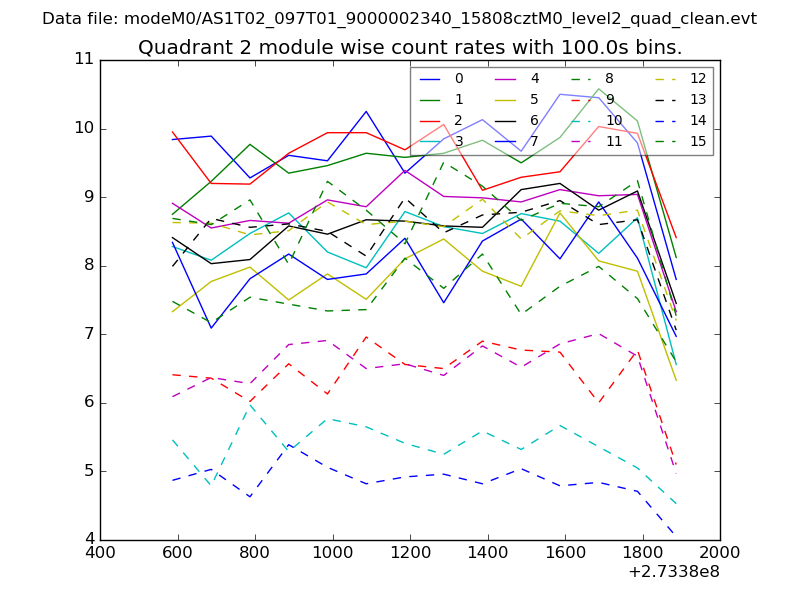
| Module-wise count rates for Quadrant B Data is divided into 100 sec bins |
 |
 |
| Module-wise count rates for Quadrant C Data is divided into 100 sec bins |
 |
 |
| Module-wise count rates for Quadrant D Data is divided into 100 sec bins |
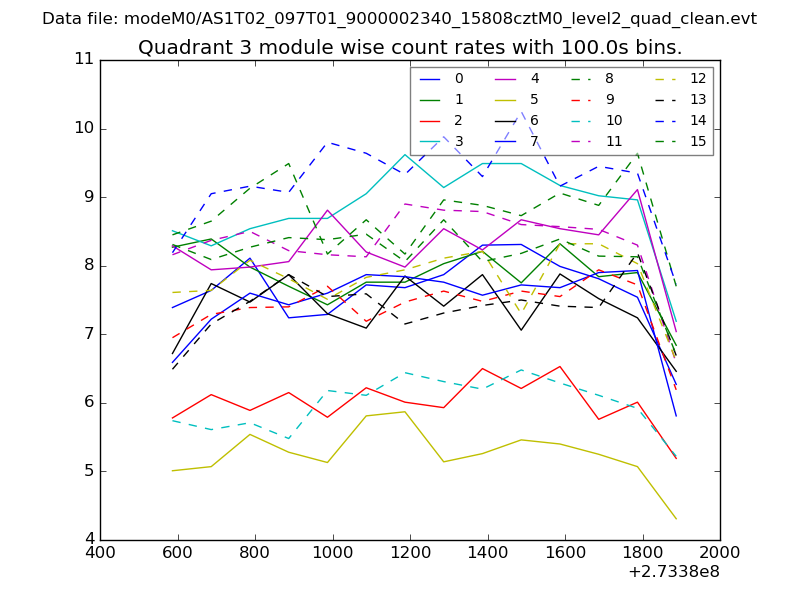 |
 |
| Parameter | Plot |
|---|---|
| CZT HV Monitor | 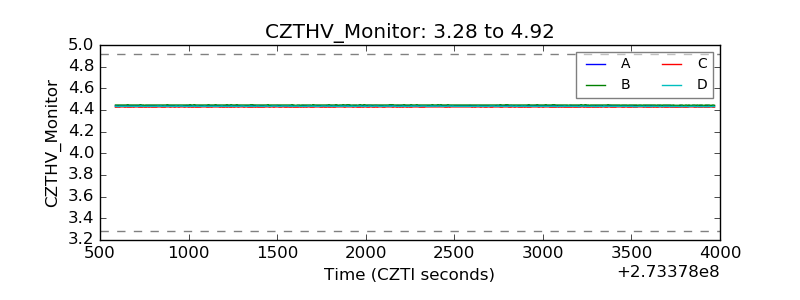 |
| D_VDD | 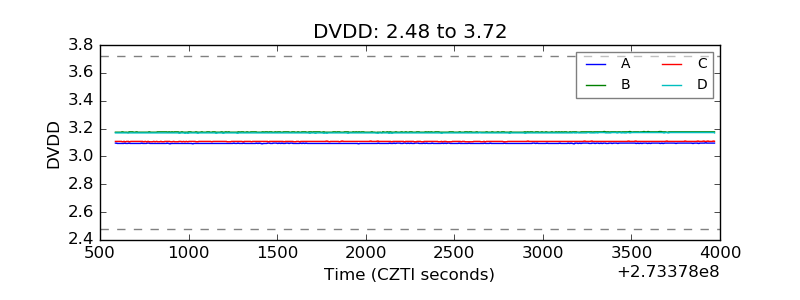 |
| Temperature 1 | 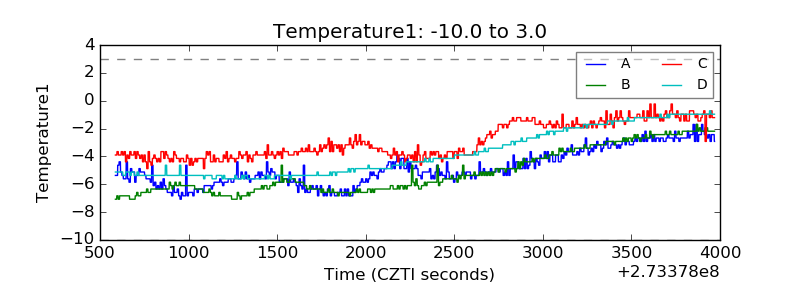 |
| Veto HV Monitor | 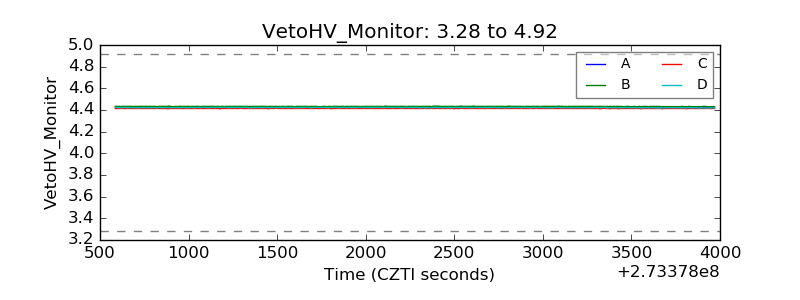 |
| Veto LLD | 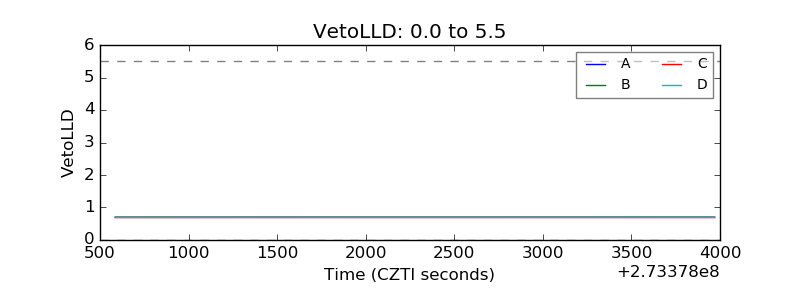 |
| Alpha Counter | 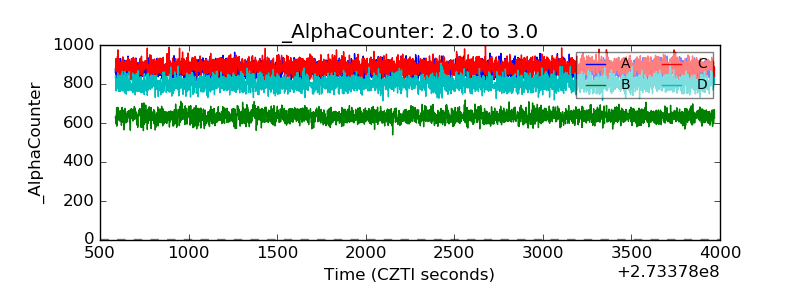 |
| _CPM_Rate | 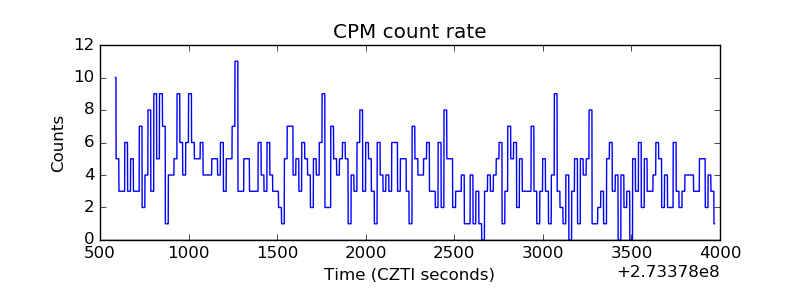 |
| CZT Counter | 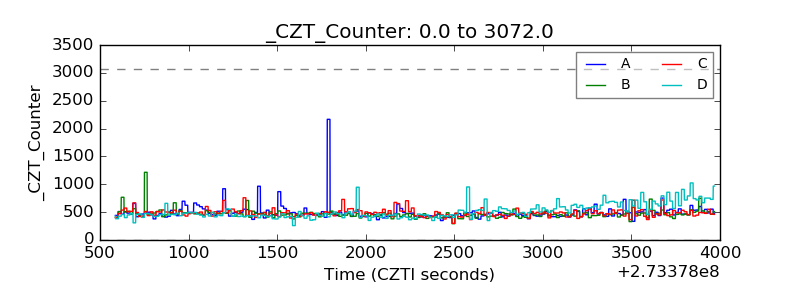 |
| +2.5 Volts monitor |  |
| +5 Volts monitor |  |
| _ROLL_ROT | 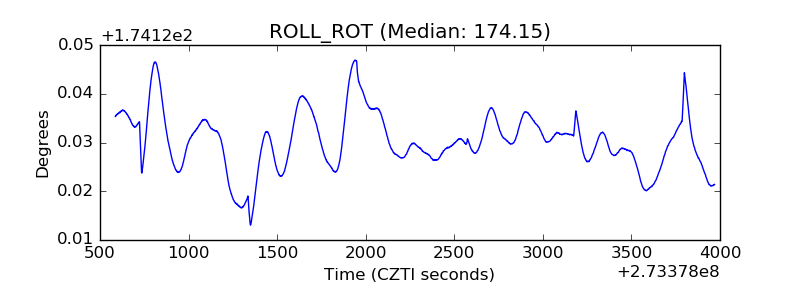 |
| _Roll_DEC | 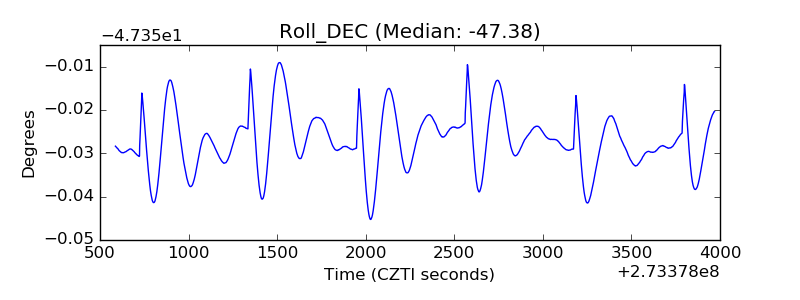 |
| _Roll_RA |  |
| Veto Counter | 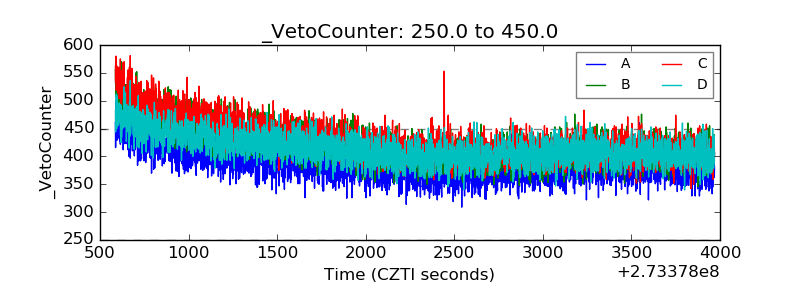 |