| Param | Original file | Final file |
|---|---|---|
| Filename | modeM0/AS1A04_026T01_9000002342cztM0_level2.fits | modeM0/AS1A04_026T01_9000002342cztM0_level2_quad_clean.evt |
| Size (bytes) | 533,943,360 | 559,085,760 |
| Size | 509.2 MB | 533.2 MB |
| Events in quadrant A | 3,180,516 | 3,271,460 |
| Events in quadrant B | 3,060,570 | 3,325,281 |
| Events in quadrant C | 3,218,406 | 3,347,463 |
| Events in quadrant D | 2,814,960 | 3,093,551 |
| Mode SS | |||
|---|---|---|---|
| Quadrant | BADHDUFLAG | Total packets | Discarded packets |
| A | 0 | 1158 | 0 |
| B | 0 | 1158 | 0 |
| C | 0 | 1158 | 0 |
| D | 0 | 1158 | 0 |
| Mode M9 | |||
|---|---|---|---|
| Quadrant | BADHDUFLAG | Total packets | Discarded packets |
| A | 0 | 84 | 0 |
| B | 0 | 84 | 0 |
| C | 0 | 84 | 0 |
| D | 0 | 84 | 0 |
| Mode M0 | |||
|---|---|---|---|
| Quadrant | BADHDUFLAG | Total packets | Discarded packets |
| A | 0 | 132726 | 0 |
| B | 0 | 157274 | 0 |
| C | 0 | 119018 | 0 |
| D | 0 | 118492 | 0 |
| Quadrant | Total seconds | Saturated seconds | Saturation percentage |
|---|---|---|---|
| A | 56772 | 1925 | 3.390756% |
| B | 56772 | 2090 | 3.681392% |
| C | 56772 | 974 | 1.715634% |
| D | 56772 | 589 | 1.037483% |
Noise dominated data is calculated using 1-second bins in cleaned event files. If a bin has >2000 counts, and if more than 50% of those come from <1% of pixels, then it is considered to be noise-dominated and hence unusable.
| Quadrant | # 1 sec bins | Bins with >0 counts | Bins with >2000 counts | High rate bins dominated by noise | Noise dominated (total time) | Noise dominated (detector-on time) | Marked lightcurve |
|---|---|---|---|---|---|---|---|
| A | 65202 | 56751 | 0 | 0 | 0.00% | 0.00% |  |
| B | 65202 | 56768 | 0 | 0 | 0.00% | 0.00% |  |
| C | 65202 | 56769 | 0 | 0 | 0.00% | 0.00% |  |
| D | 65202 | 56771 | 0 | 0 | 0.00% | 0.00% |  |
Top three noisy pixels from each quadrant. If the there are fewer than three noisy pixels in the level2.evt file, extra rows are filled as -1
| Pixel properties | Quadrant properties | ||||||
|---|---|---|---|---|---|---|---|
| Quadrant | DetID | PixID | Counts | Sigma | Mean | Median | Sigma |
| A | 0 | 29 | 3085 | 11.18 | 828 | 775 | 206.6 |
| A | 7 | 110 | 2604 | 8.85 | 828 | 775 | 206.6 |
| A | 0 | 30 | 2420 | 7.96 | 828 | 775 | 206.6 |
| B | 2 | 9 | 2492 | 10.81 | 810 | 774 | 159.0 |
| B | 2 | 8 | 2127 | 8.51 | 810 | 774 | 159.0 |
| B | 14 | 254 | 2085 | 8.25 | 810 | 774 | 159.0 |
| C | 12 | 241 | 2199 | 6.43 | 851 | 793 | 218.8 |
| C | 3 | 126 | 2196 | 6.41 | 851 | 793 | 218.8 |
| C | 2 | 191 | 2174 | 6.31 | 851 | 793 | 218.8 |
| D | 6 | 231 | 2158 | 6.61 | 803 | 732 | 215.7 |
| D | 6 | 38 | 1996 | 5.86 | 803 | 732 | 215.7 |
| D | 10 | 189 | 1993 | 5.85 | 803 | 732 | 215.7 |
Histogram calculated using DETX and DETY for each event in the final _common_clean file
| Quadrant A | 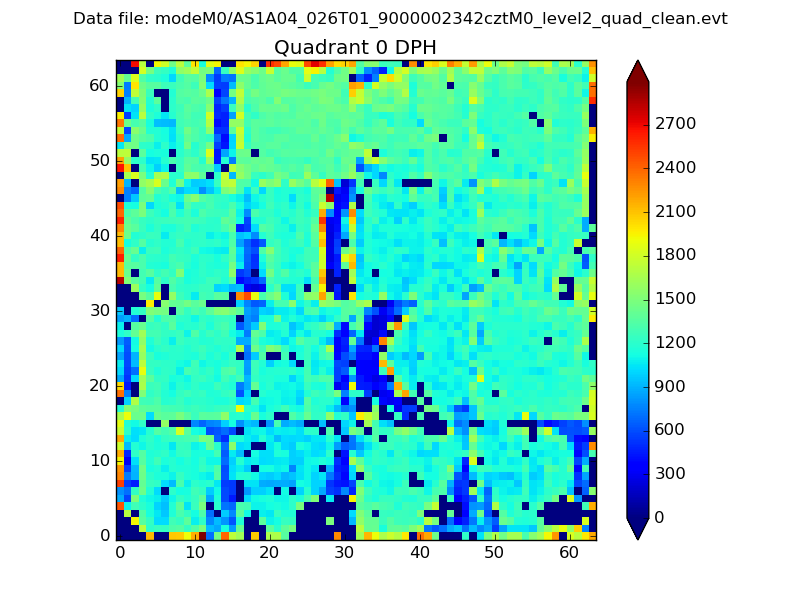 |
 |
Quadrant B |
|---|---|---|---|
| Quadrant D |  |
 |
Quadrant C |
| Plot type | Count rate plots | Images |
|---|---|---|
| Comparison with Poisson distribution Blue bars denote a histogram of data divided into 1 sec bins. Red curve is a Poisson curve with rate = median count rate of data. |
 |
 |
| Quadrant-wise count rates Data is divided into 100 sec bins |
 |
|
| Module-wise count rates for Quadrant A Data is divided into 100 sec bins |
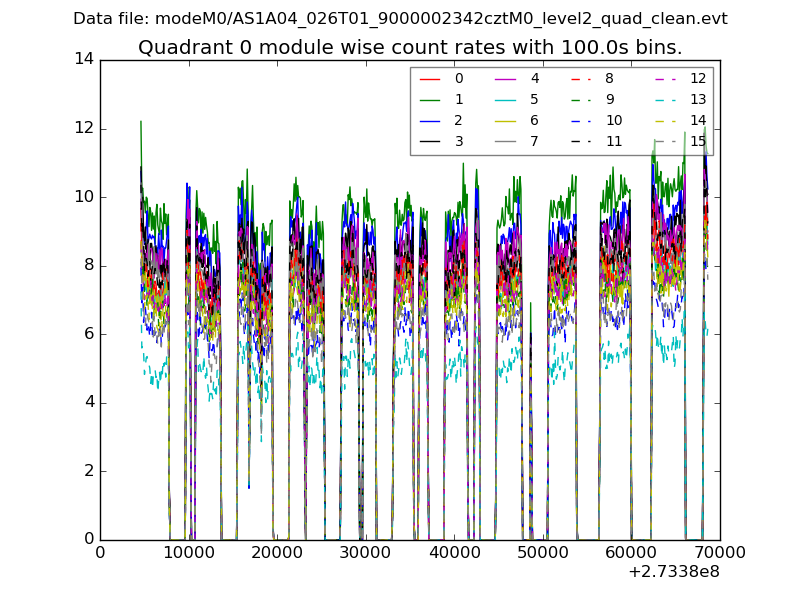 |
 |
| Module-wise count rates for Quadrant B Data is divided into 100 sec bins |
 |
 |
| Module-wise count rates for Quadrant C Data is divided into 100 sec bins |
 |
 |
| Module-wise count rates for Quadrant D Data is divided into 100 sec bins |
 |
 |
| Parameter | Plot |
|---|---|
| CZT HV Monitor | 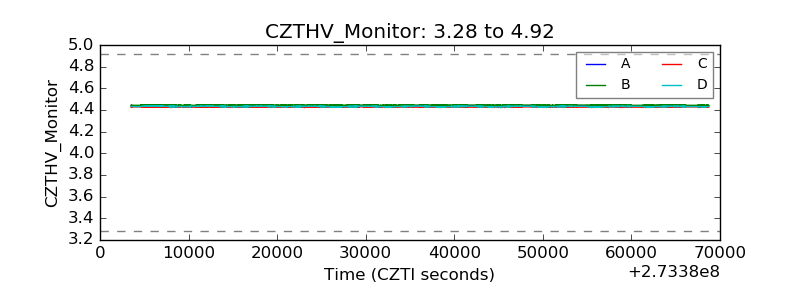 |
| D_VDD |  |
| Temperature 1 |  |
| Veto HV Monitor |  |
| Veto LLD |  |
| Alpha Counter |  |
| _CPM_Rate |  |
| CZT Counter |  |
| +2.5 Volts monitor |  |
| +5 Volts monitor |  |
| _ROLL_ROT |  |
| _Roll_DEC |  |
| _Roll_RA |  |
| Veto Counter |  |