| Param | Original file | Final file |
|---|---|---|
| Filename | modeM0/AS1A04_026T01_9000002342_15808cztM0_level2.evt | modeM0/AS1A04_026T01_9000002342_15808cztM0_level2_quad_clean.evt |
| Size (bytes) | 99,002,880 | 26,015,040 |
| Size | 94.4 MB | 24.8 MB |
| Events in quadrant A | 831,233 | 167,844 |
| Events in quadrant B | 724,096 | 173,543 |
| Events in quadrant C | 697,961 | 171,595 |
| Events in quadrant D | 643,763 | 166,840 |
| Mode SS | |||
|---|---|---|---|
| Quadrant | BADHDUFLAG | Total packets | Discarded packets |
| A | 0 | 30 | 0 |
| B | 0 | 30 | 0 |
| C | 0 | 30 | 0 |
| D | 0 | 30 | 0 |
| Mode M9 | |||
|---|---|---|---|
| Quadrant | BADHDUFLAG | Total packets | Discarded packets |
| A | 0 | 10 | 0 |
| B | 0 | 10 | 0 |
| C | 0 | 10 | 0 |
| D | 0 | 10 | 0 |
| Mode M0 | |||
|---|---|---|---|
| Quadrant | BADHDUFLAG | Total packets | Discarded packets |
| A | 0 | 3466 | 2 |
| B | 0 | 3142 | 1 |
| C | 0 | 3070 | 1 |
| D | 0 | 3036 | 1 |
| Quadrant | Total seconds | Saturated seconds | Saturation percentage |
|---|---|---|---|
| A | 1449 | 57 | 3.933747% |
| B | 1449 | 28 | 1.932367% |
| C | 1449 | 34 | 2.346446% |
| D | 1449 | 6 | 0.414079% |
Noise dominated data is calculated using 1-second bins in cleaned event files. If a bin has >2000 counts, and if more than 50% of those come from <1% of pixels, then it is considered to be noise-dominated and hence unusable.
| Quadrant | # 1 sec bins | Bins with >0 counts | Bins with >2000 counts | High rate bins dominated by noise | Noise dominated (total time) | Noise dominated (detector-on time) | Marked lightcurve |
|---|---|---|---|---|---|---|---|
| A | 2445 | 1452 | 23 | 23 | 0.94% | 1.58% | 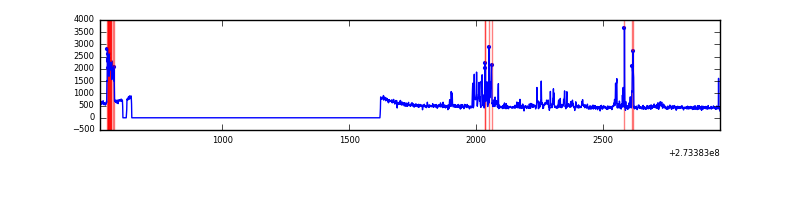 |
| B | 2445 | 1452 | 0 | 0 | 0.00% | 0.00% | 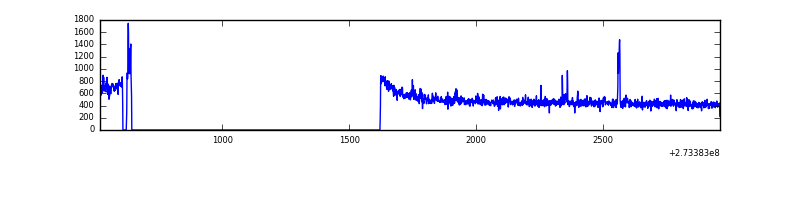 |
| C | 2445 | 1452 | 0 | 0 | 0.00% | 0.00% | 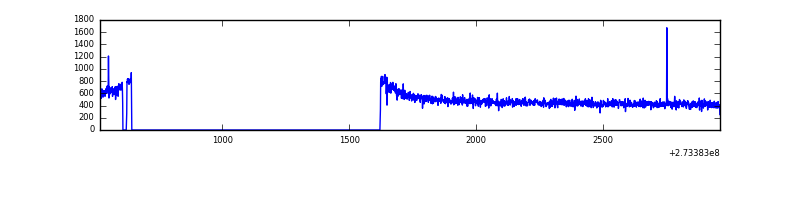 |
| D | 2445 | 1452 | 1 | 1 | 0.04% | 0.07% | 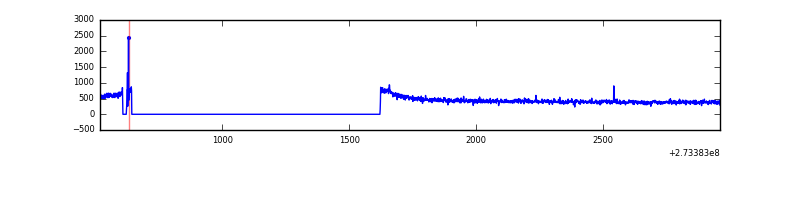 |
Top three noisy pixels from each quadrant. If the there are fewer than three noisy pixels in the level2.evt file, extra rows are filled as -1
| Pixel properties | Quadrant properties | ||||||
|---|---|---|---|---|---|---|---|
| Quadrant | DetID | PixID | Counts | Sigma | Mean | Median | Sigma |
| A | 15 | 239 | 167006 | 4510.03 | 172 | 168 | 37.0 |
| A | 0 | 226 | 1514 | 36.37 | 172 | 168 | 37.0 |
| A | 12 | 194 | 1221 | 28.45 | 172 | 168 | 37.0 |
| B | 4 | 173 | 15677 | 424.56 | 177 | 172 | 36.5 |
| B | 0 | 244 | 5624 | 149.29 | 177 | 172 | 36.5 |
| B | 12 | 111 | 4213 | 110.65 | 177 | 172 | 36.5 |
| C | 14 | 238 | 26285 | 622.74 | 171 | 172 | 41.9 |
| C | 0 | 207 | 1852 | 40.06 | 171 | 172 | 41.9 |
| C | 10 | 22 | 1405 | 29.4 | 171 | 172 | 41.9 |
| D | 2 | 234 | 4940 | 112.42 | 168 | 163 | 42.5 |
| D | 13 | 172 | 2674 | 59.09 | 168 | 163 | 42.5 |
| D | 3 | 238 | 2007 | 43.4 | 168 | 163 | 42.5 |
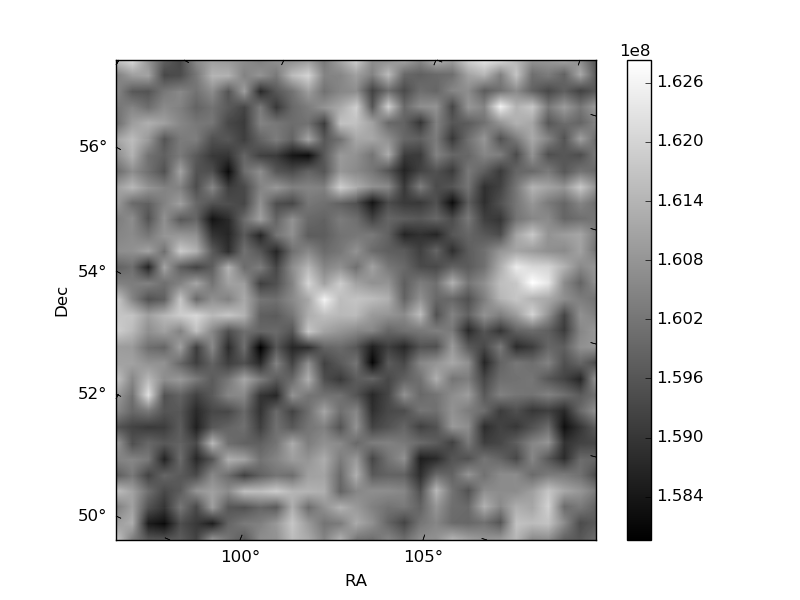
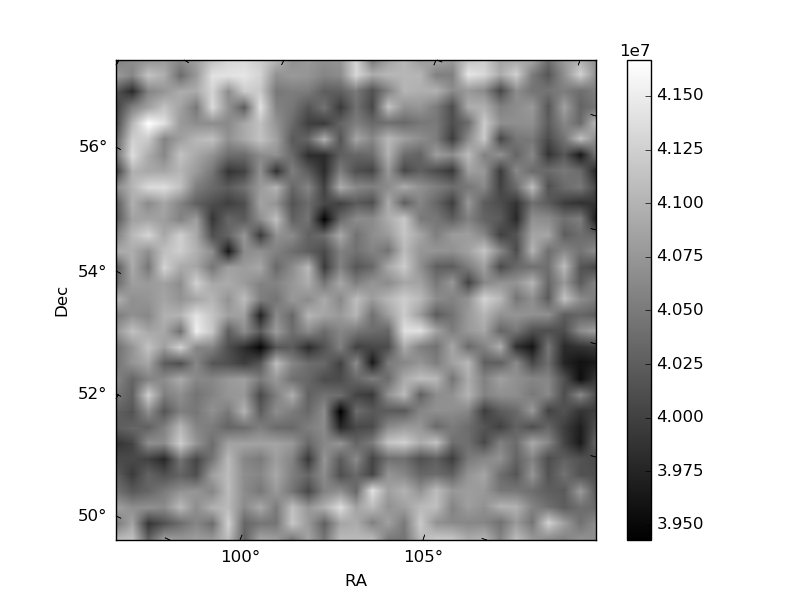
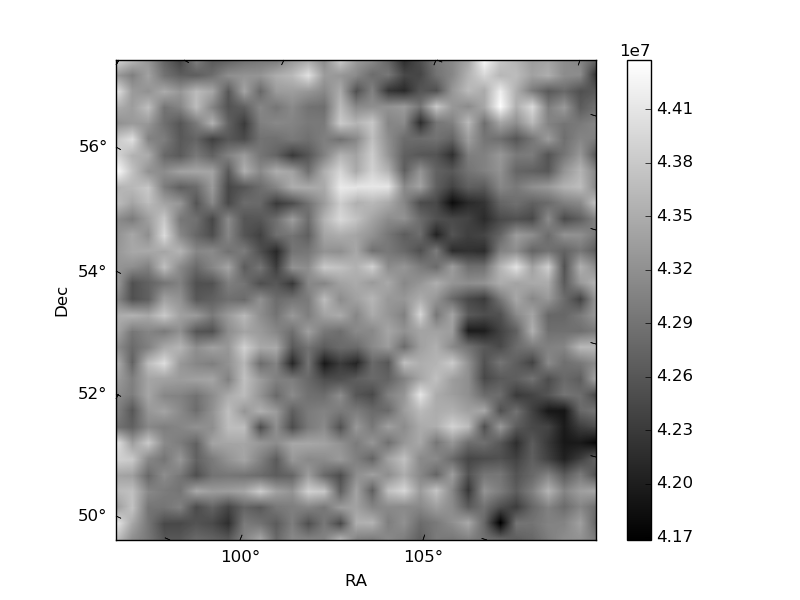
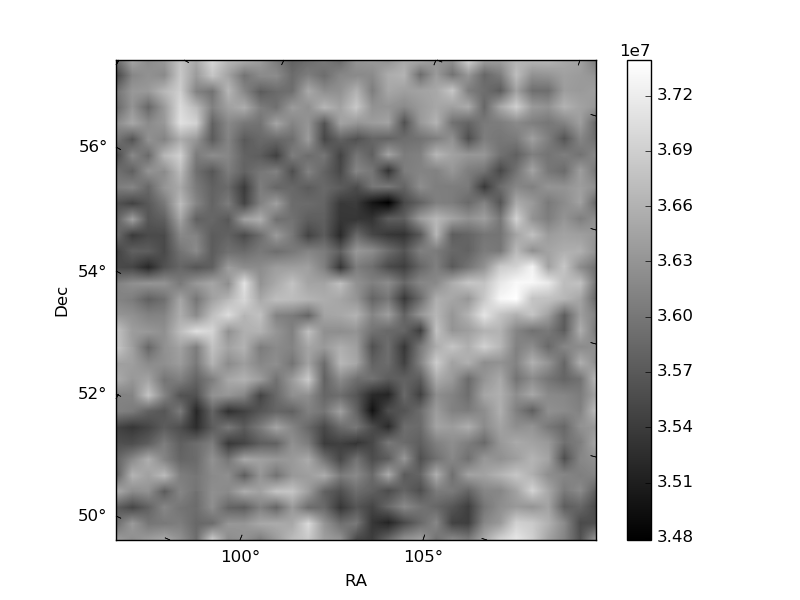
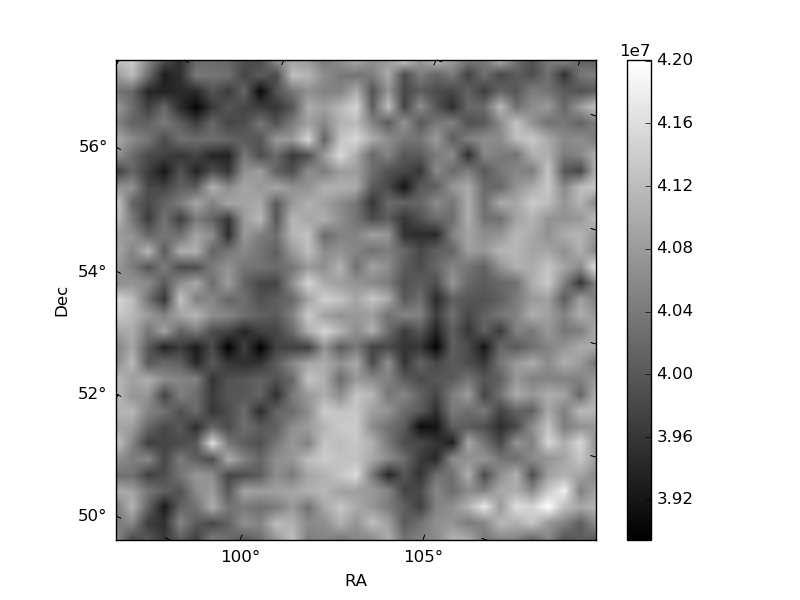
Histogram calculated using DETX and DETY for each event in the final _common_clean file
| Quadrant A | 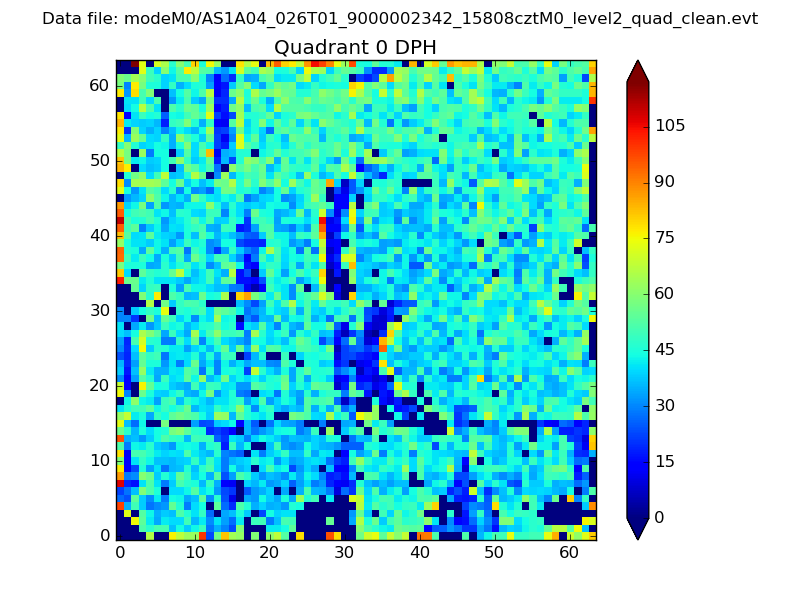 |
 |
Quadrant B |
|---|---|---|---|
| Quadrant D | 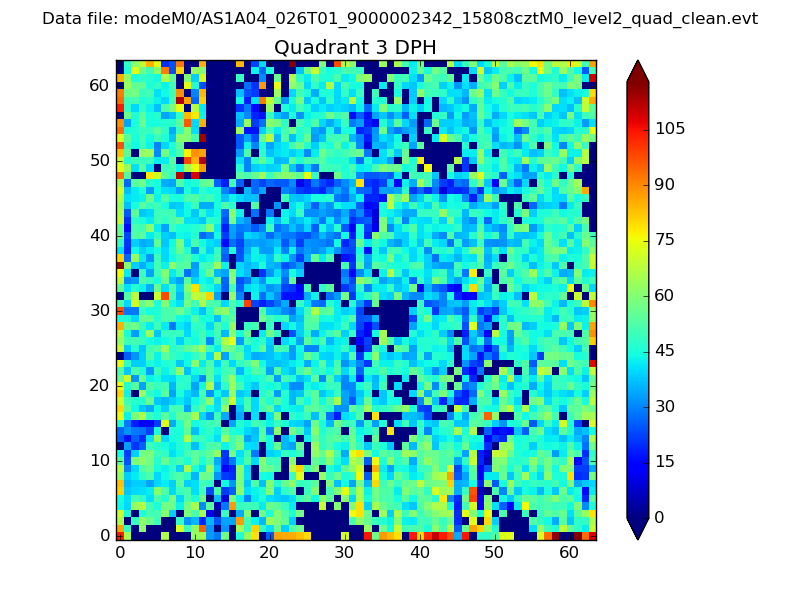 |
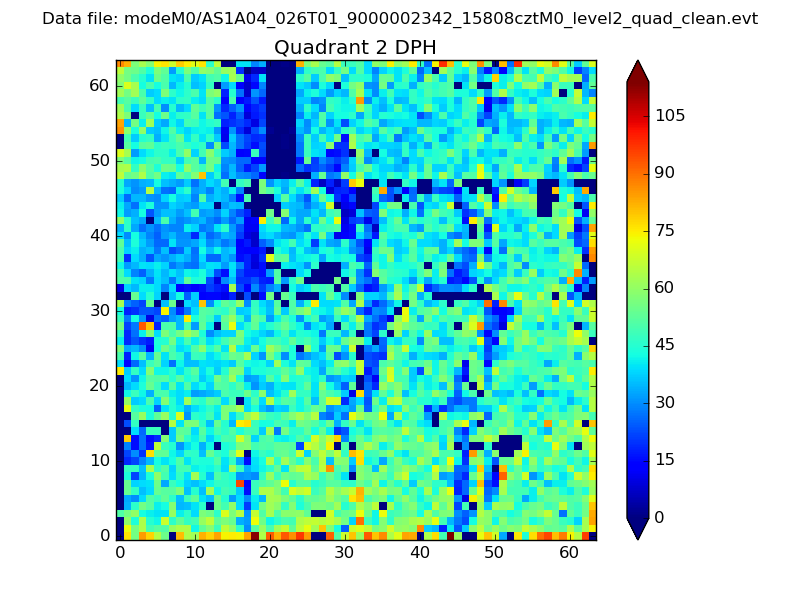 |
Quadrant C |
| Plot type | Count rate plots | Images |
|---|---|---|
| Comparison with Poisson distribution Blue bars denote a histogram of data divided into 1 sec bins. Red curve is a Poisson curve with rate = median count rate of data. |
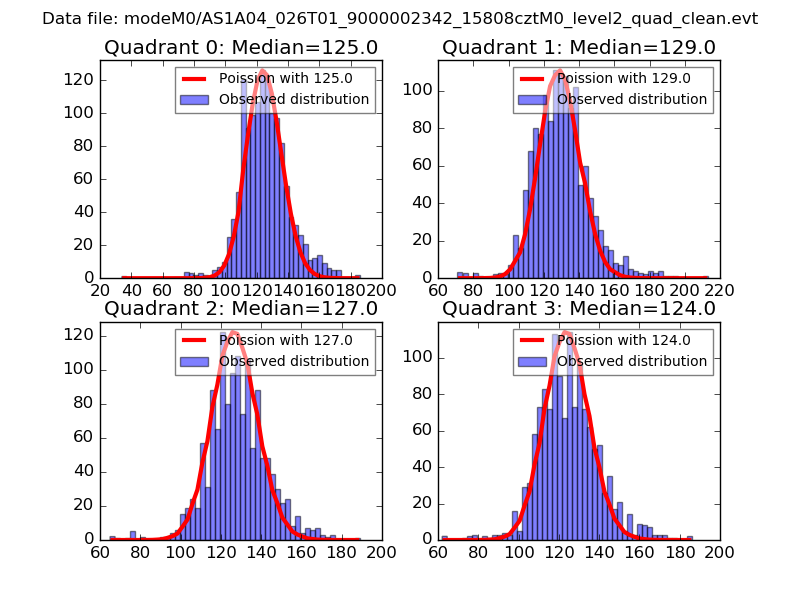 |
 |
| Quadrant-wise count rates Data is divided into 100 sec bins |
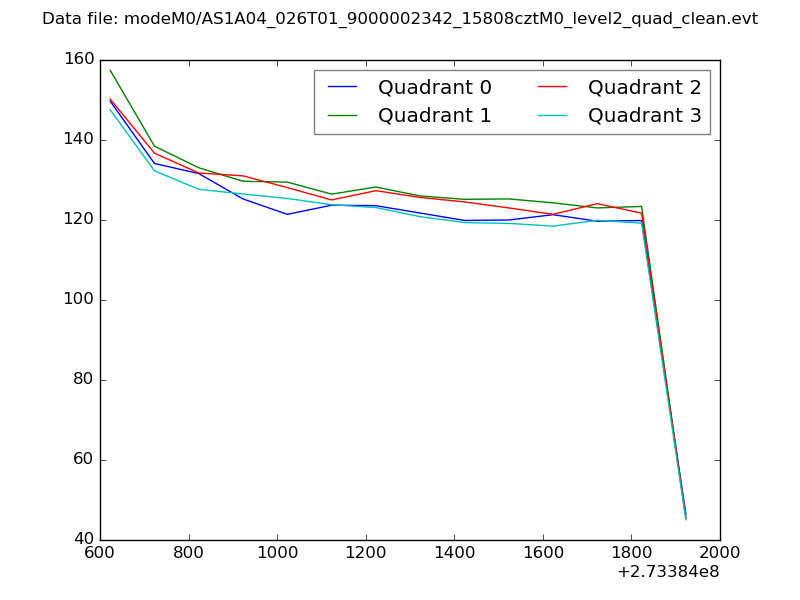 |
|
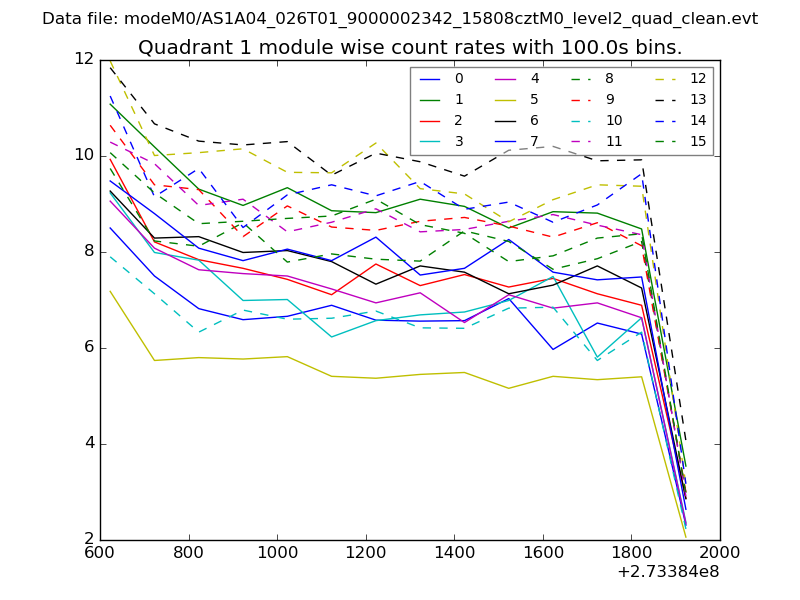
| Module-wise count rates for Quadrant A Data is divided into 100 sec bins |
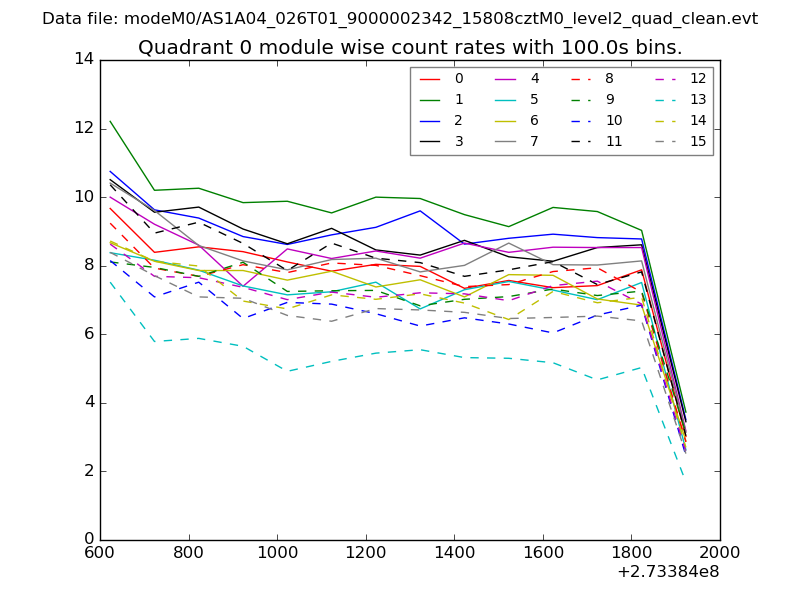 |
 |
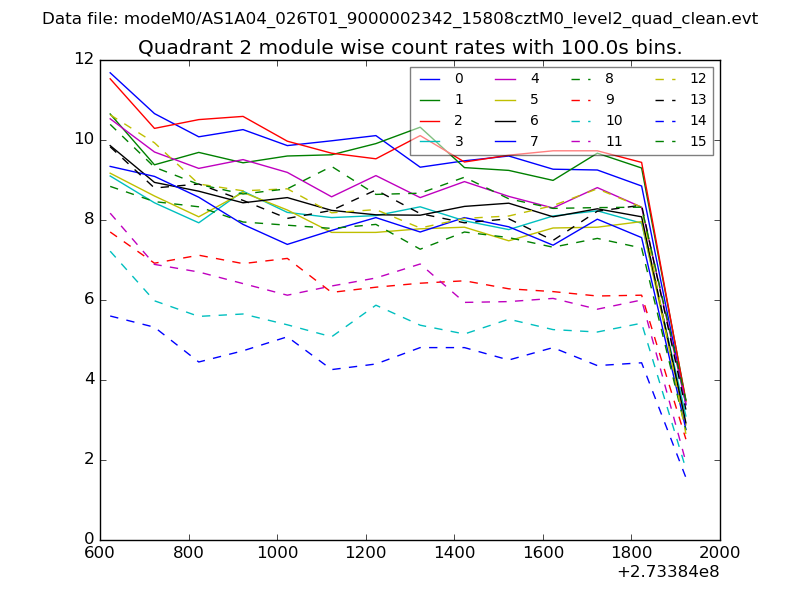
| Module-wise count rates for Quadrant B Data is divided into 100 sec bins |
 |
 |
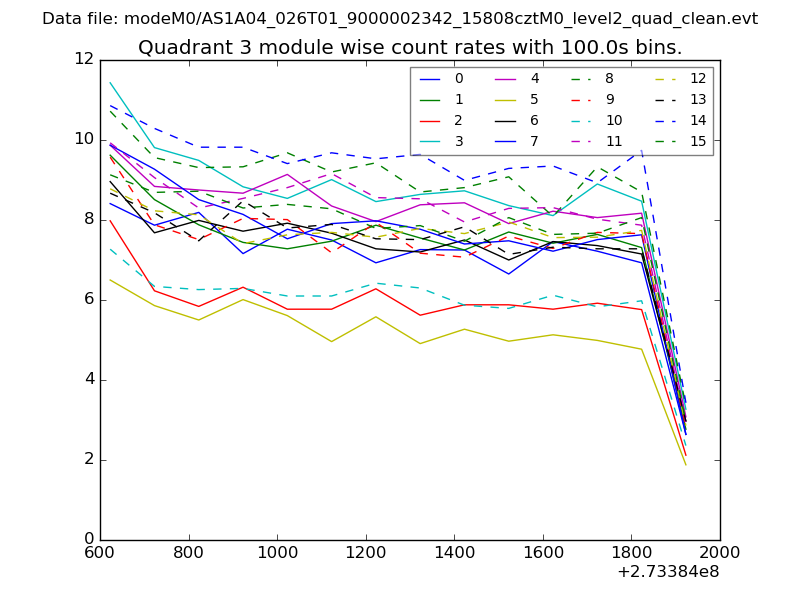
| Module-wise count rates for Quadrant C Data is divided into 100 sec bins |
 |
 |
| Module-wise count rates for Quadrant D Data is divided into 100 sec bins |
 |
 |
| Parameter | Plot |
|---|---|
| CZT HV Monitor | 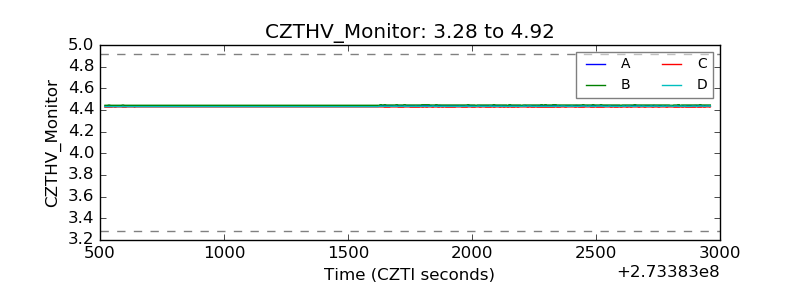 |
| D_VDD | 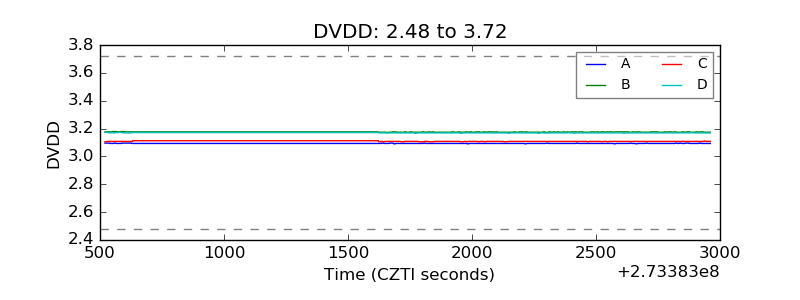 |
| Temperature 1 | 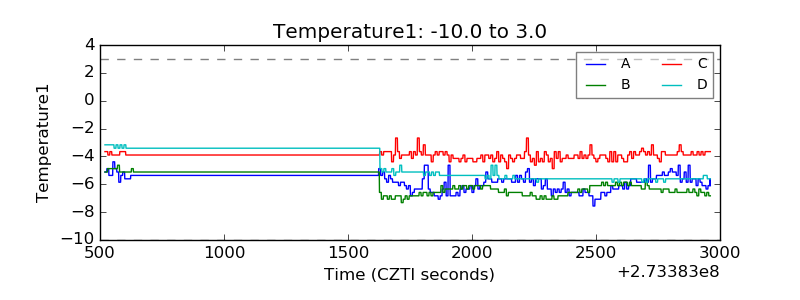 |
| Veto HV Monitor |  |
| Veto LLD |  |
| Alpha Counter | 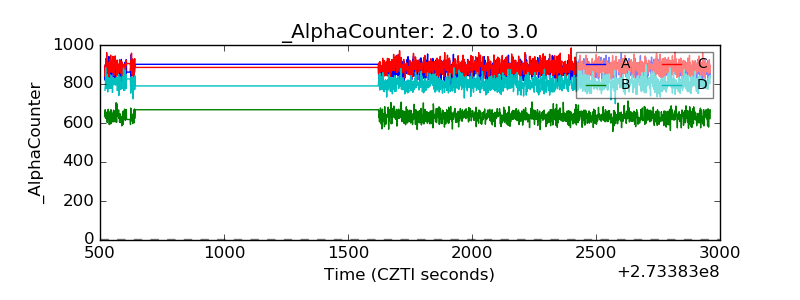 |
| _CPM_Rate | 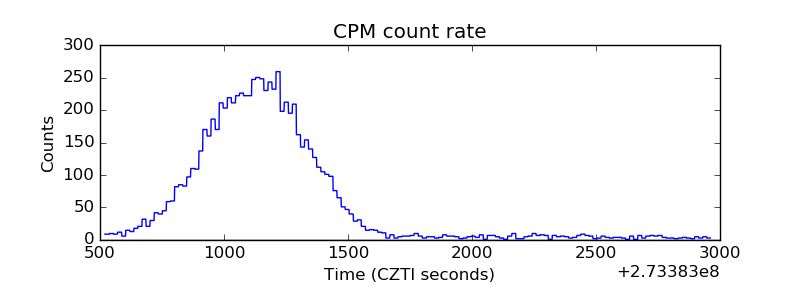 |
| CZT Counter | 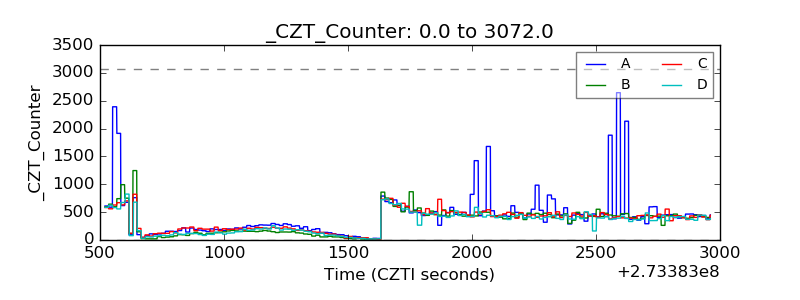 |
| +2.5 Volts monitor | 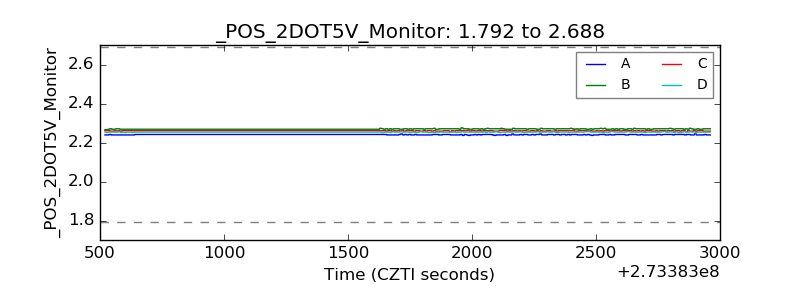 |
| +5 Volts monitor |  |
| _ROLL_ROT | 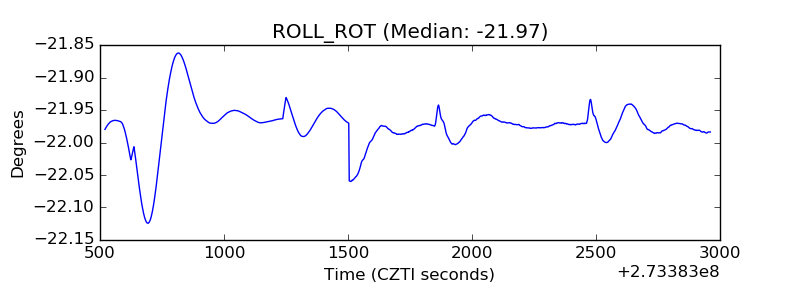 |
| _Roll_DEC | 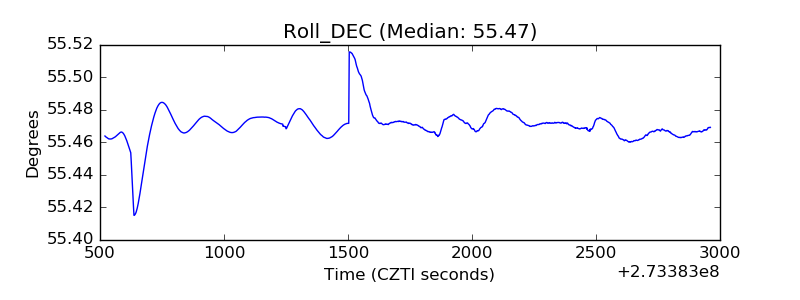 |
| _Roll_RA | 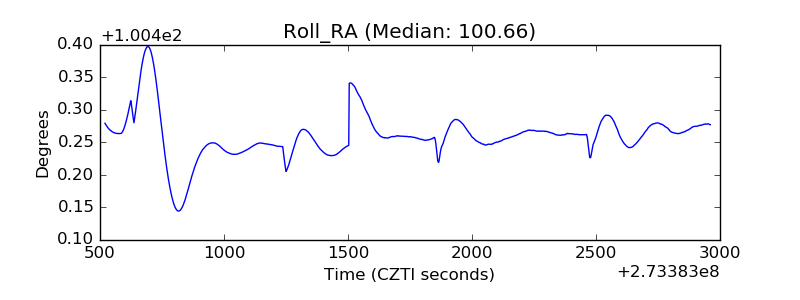 |
| Veto Counter | 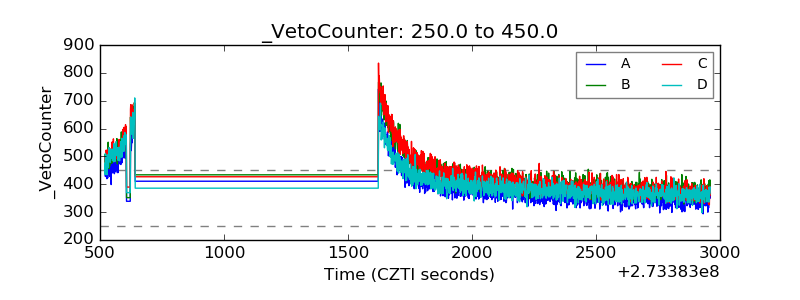 |