| Param | Original file | Final file |
|---|---|---|
| Filename | modeM0/AS1A04_026T01_9000002342_15809cztM0_level2.evt | modeM0/AS1A04_026T01_9000002342_15809cztM0_level2_quad_clean.evt |
| Size (bytes) | 15,004,800 | 4,636,800 |
| Size | 14.3 MB | 4.4 MB |
| Events in quadrant A | 129,317 | 27,924 |
| Events in quadrant B | 96,784 | 24,809 |
| Events in quadrant C | 105,257 | 30,768 |
| Events in quadrant D | 102,984 | 31,286 |
| Mode SS | |||
|---|---|---|---|
| Quadrant | BADHDUFLAG | Total packets | Discarded packets |
| A | 0 | 46 | 42 |
| B | 0 | 47 | 43 |
| C | 0 | 45 | 43 |
| D | 0 | 46 | 42 |
| Mode M9 | |||
|---|---|---|---|
| Quadrant | BADHDUFLAG | Total packets | Discarded packets |
| A | 0 | 5 | 5 |
| B | 0 | 5 | 5 |
| C | 0 | 6 | 6 |
| D | 0 | 6 | 6 |
| Mode M0 | |||
|---|---|---|---|
| Quadrant | BADHDUFLAG | Total packets | Discarded packets |
| A | 0 | 5212 | 4649 |
| B | 0 | 5628 | 5191 |
| C | 0 | 4728 | 4211 |
| D | 0 | 4622 | 4083 |
| Quadrant | Total seconds | Saturated seconds | Saturation percentage |
|---|---|---|---|
| A | 242 | 4 | 1.652893% |
| B | 208 | 0 | 0.000000% |
| C | 258 | 0 | 0.000000% |
| D | 270 | 0 | 0.000000% |
Noise dominated data is calculated using 1-second bins in cleaned event files. If a bin has >2000 counts, and if more than 50% of those come from <1% of pixels, then it is considered to be noise-dominated and hence unusable.
| Quadrant | # 1 sec bins | Bins with >0 counts | Bins with >2000 counts | High rate bins dominated by noise | Noise dominated (total time) | Noise dominated (detector-on time) | Marked lightcurve |
|---|---|---|---|---|---|---|---|
| A | 577 | 365 | 1 | 1 | 0.17% | 0.27% | 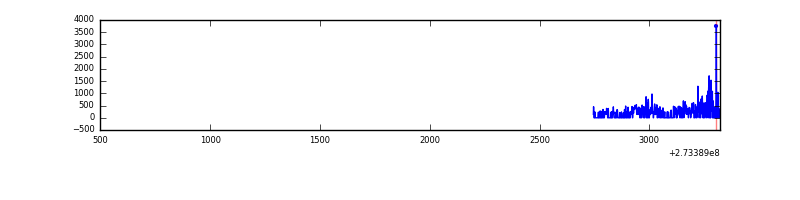 |
| B | 2824 | 320 | 0 | 0 | 0.00% | 0.00% | 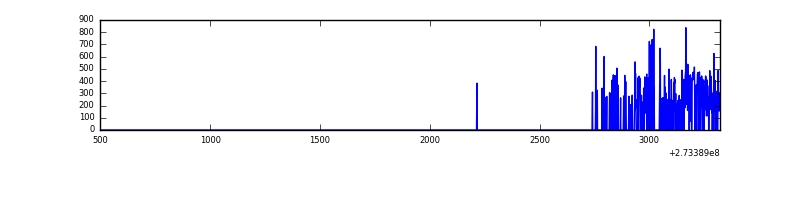 |
| C | 591 | 373 | 0 | 0 | 0.00% | 0.00% | 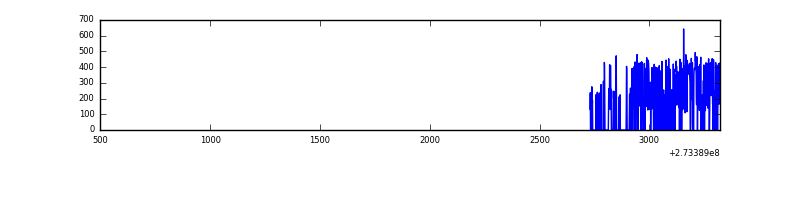 |
| D | 2814 | 395 | 0 | 0 | 0.00% | 0.00% | 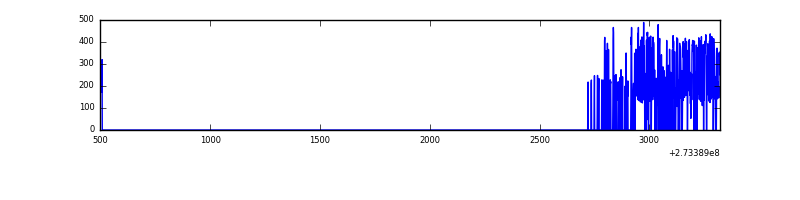 |
Top three noisy pixels from each quadrant. If the there are fewer than three noisy pixels in the level2.evt file, extra rows are filled as -1
| Pixel properties | Quadrant properties | ||||||
|---|---|---|---|---|---|---|---|
| Quadrant | DetID | PixID | Counts | Sigma | Mean | Median | Sigma |
| A | 15 | 239 | 31719 | 4456.82 | 25 | 24 | 7.1 |
| A | 0 | 226 | 216 | 27.0 | 25 | 24 | 7.1 |
| A | 3 | 137 | 206 | 25.59 | 25 | 24 | 7.1 |
| B | 4 | 173 | 5364 | 864.94 | 22 | 21 | 6.2 |
| B | 10 | 245 | 4127 | 664.69 | 22 | 21 | 6.2 |
| B | 0 | 229 | 845 | 133.39 | 22 | 21 | 6.2 |
| C | 14 | 238 | 4014 | 519.74 | 25 | 25 | 7.7 |
| C | 3 | 233 | 944 | 119.74 | 25 | 25 | 7.7 |
| C | 13 | 61 | 208 | 23.84 | 25 | 25 | 7.7 |
| D | 2 | 234 | 1032 | 115.82 | 26 | 25 | 8.7 |
| D | 5 | 51 | 645 | 71.31 | 26 | 25 | 8.7 |
| D | 14 | 226 | 294 | 30.94 | 26 | 25 | 8.7 |
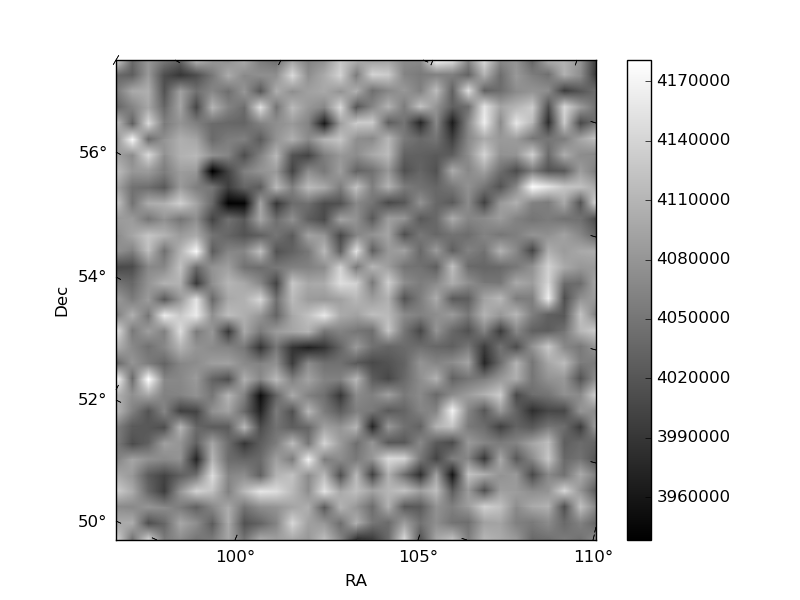
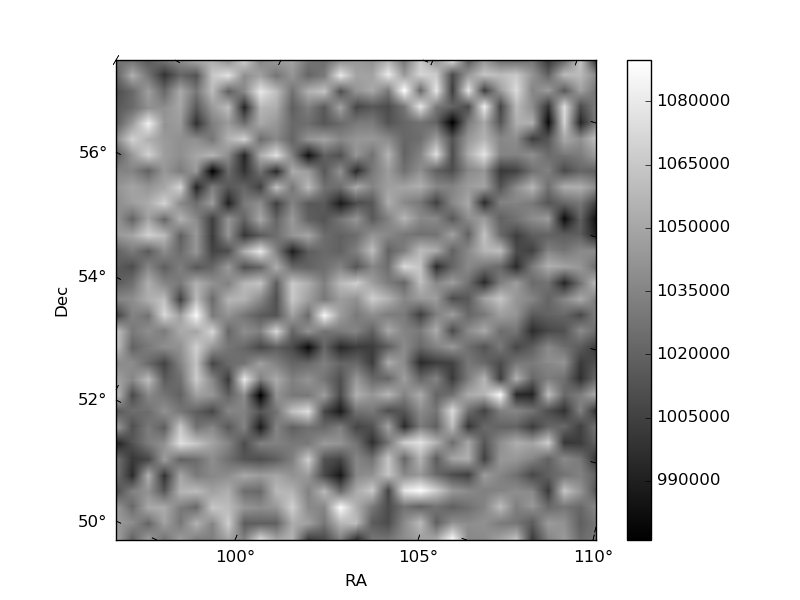
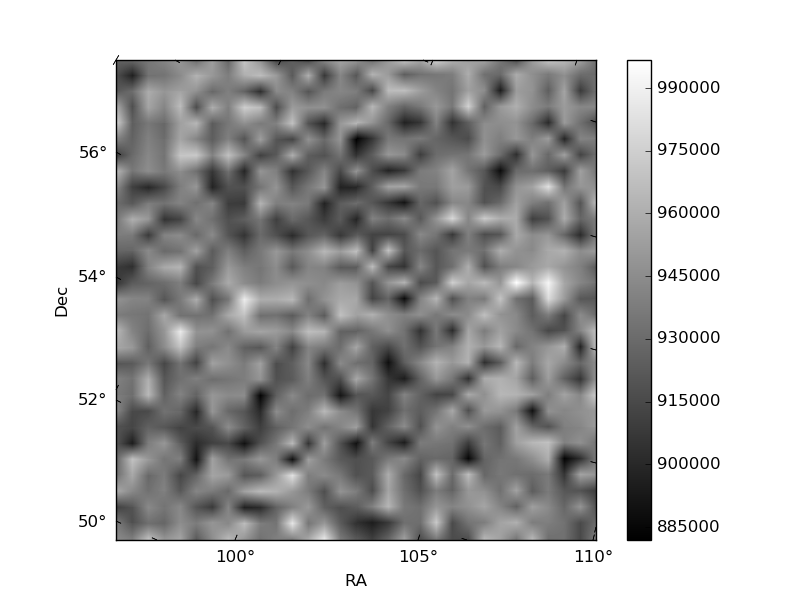
Histogram calculated using DETX and DETY for each event in the final _common_clean file
| Quadrant A | 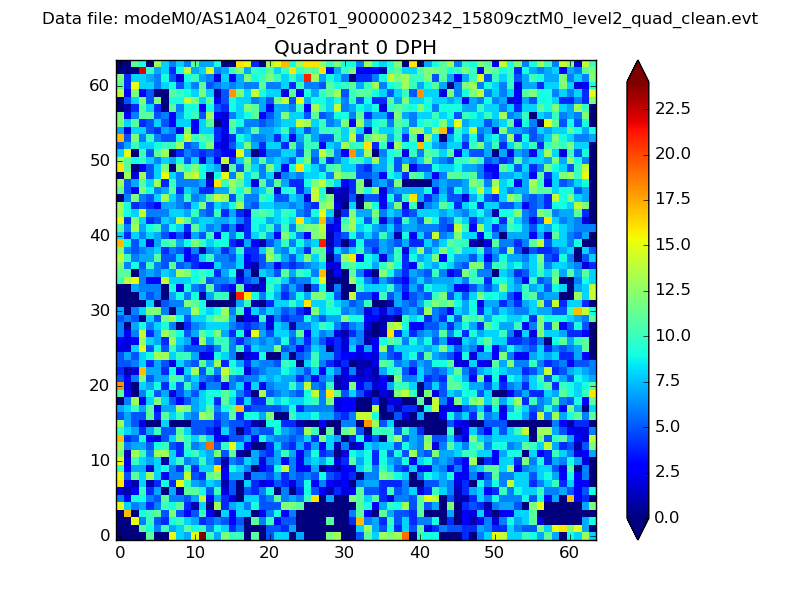 |
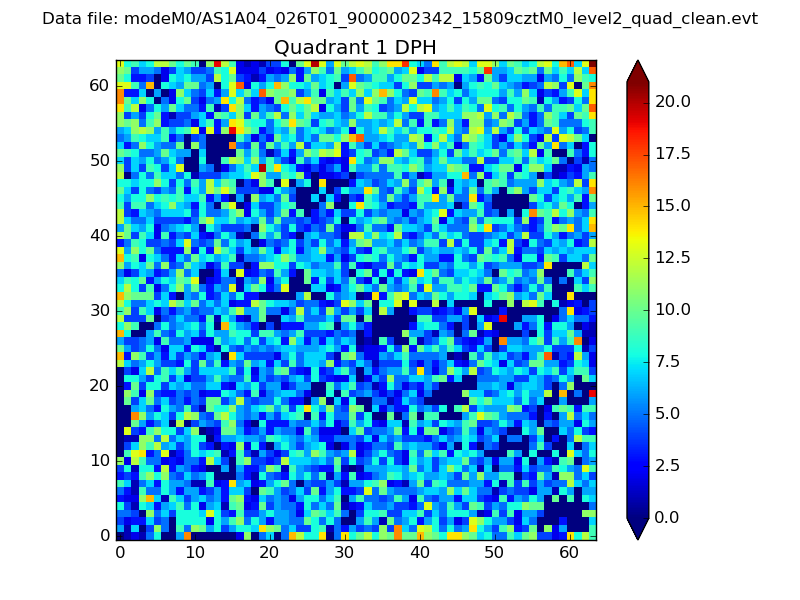 |
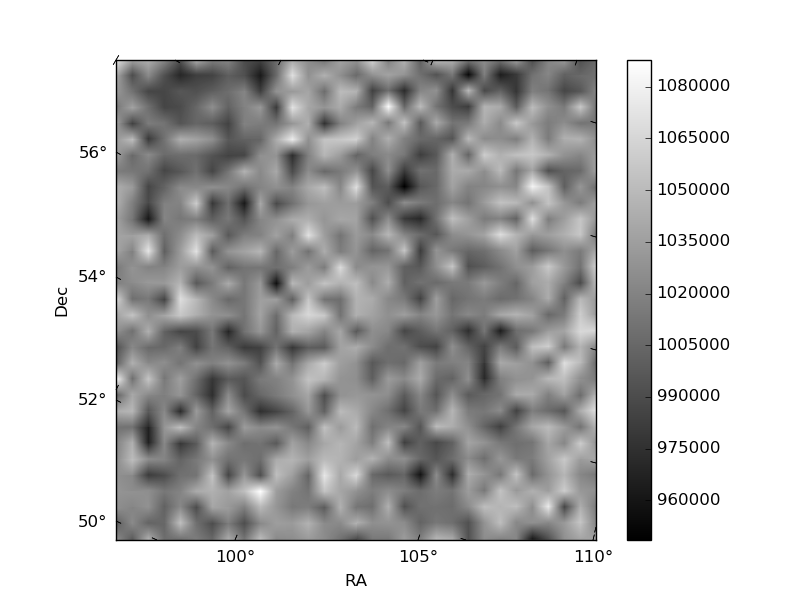
Quadrant B |
|---|---|---|---|
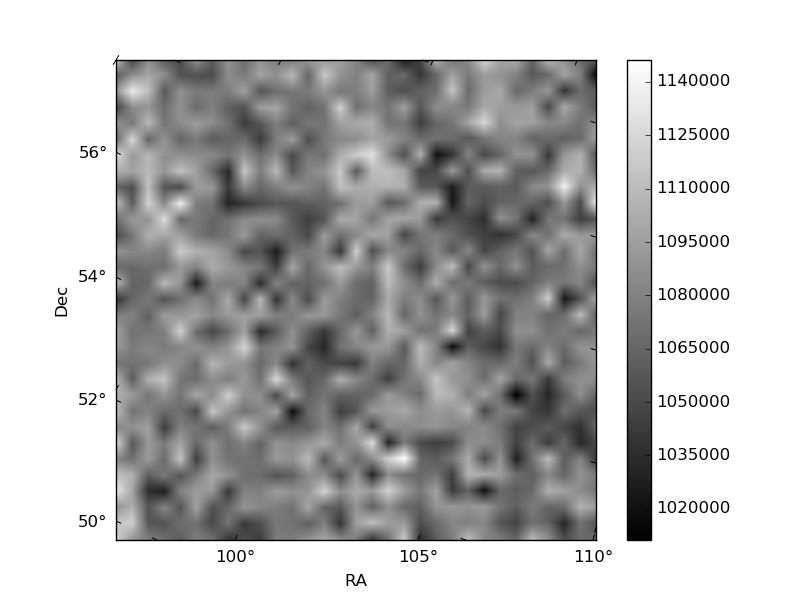
| Quadrant D | 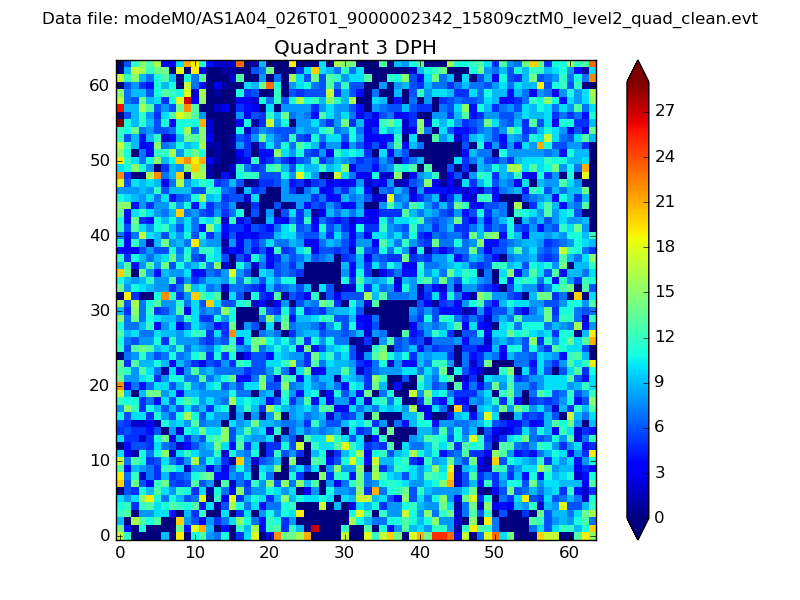 |
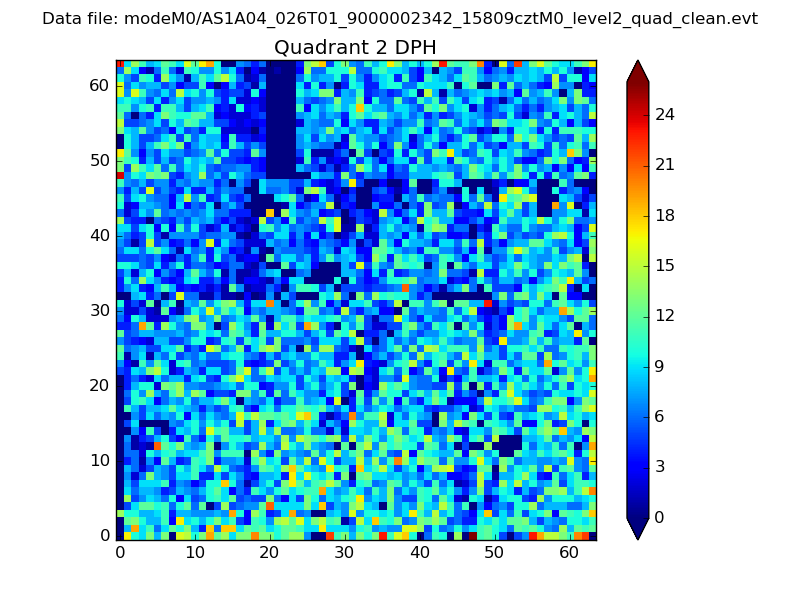 |
Quadrant C |
| Plot type | Count rate plots | Images |
|---|---|---|
| Comparison with Poisson distribution Blue bars denote a histogram of data divided into 1 sec bins. Red curve is a Poisson curve with rate = median count rate of data. |
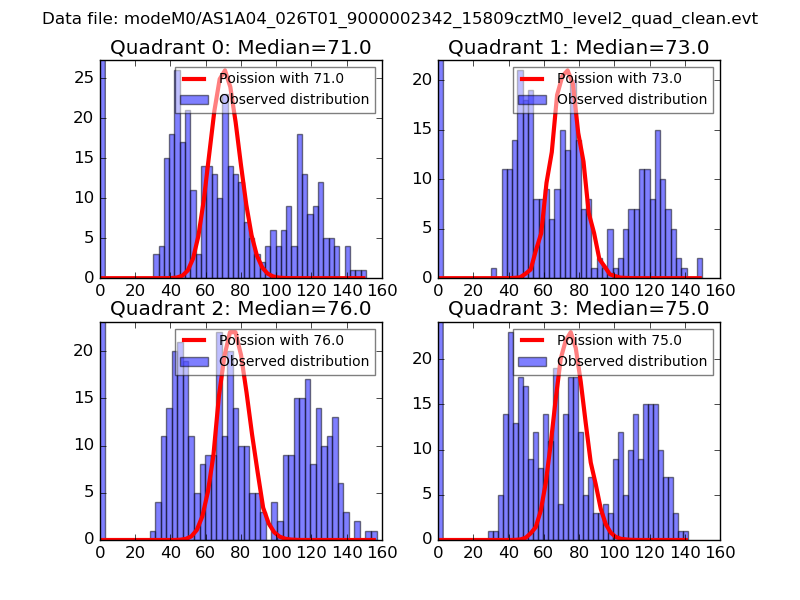 |
 |
| Quadrant-wise count rates Data is divided into 100 sec bins |
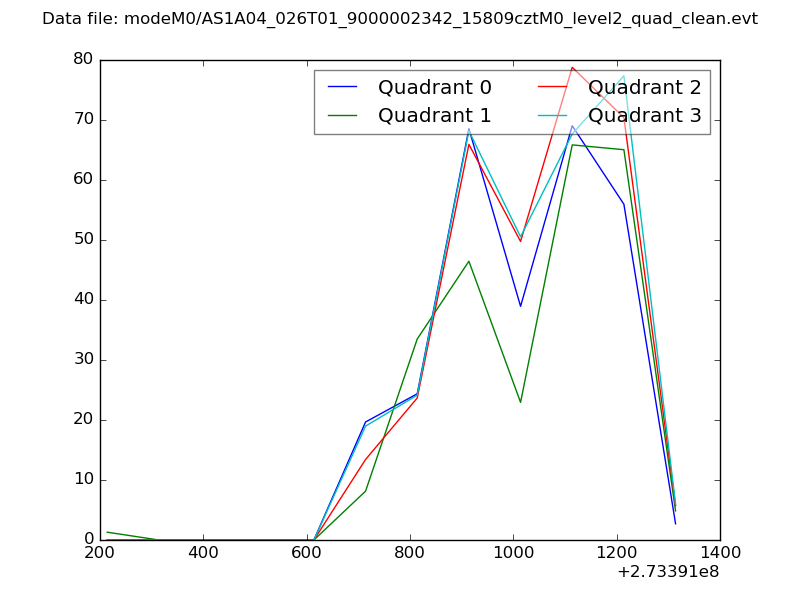 |
|
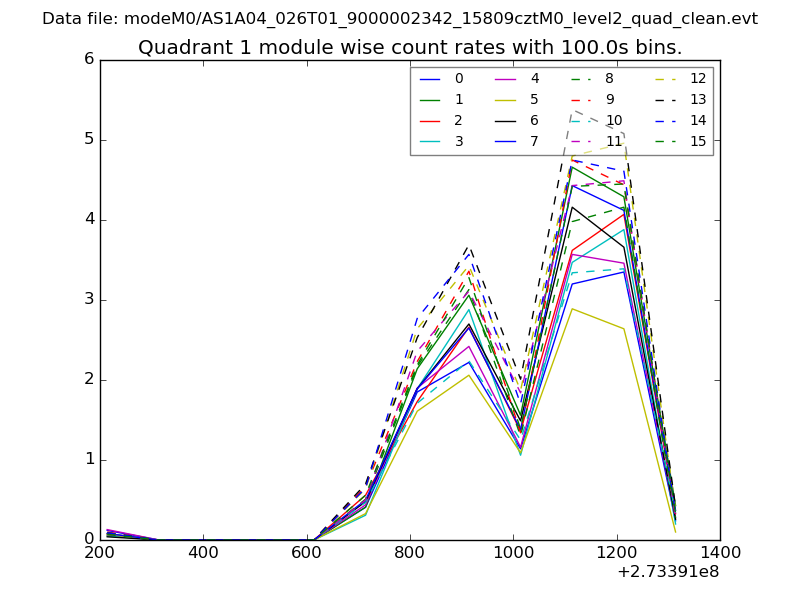
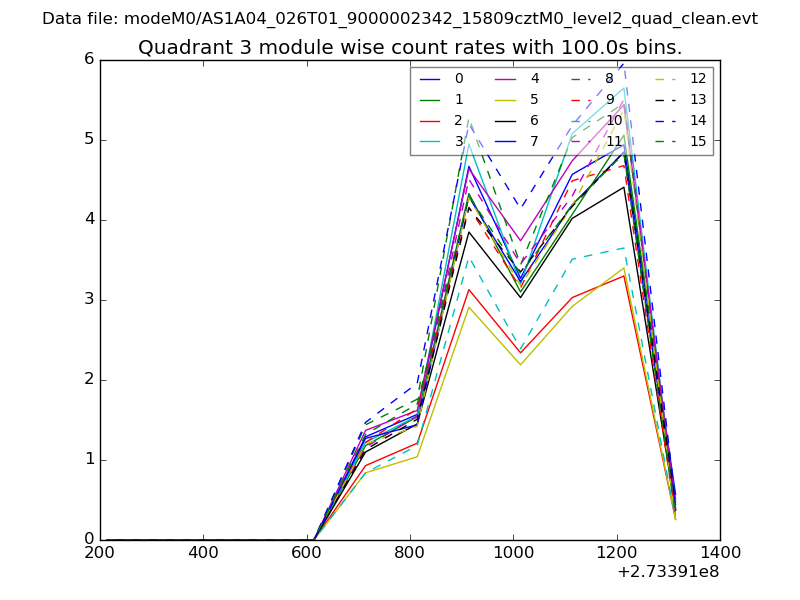
| Module-wise count rates for Quadrant A Data is divided into 100 sec bins |
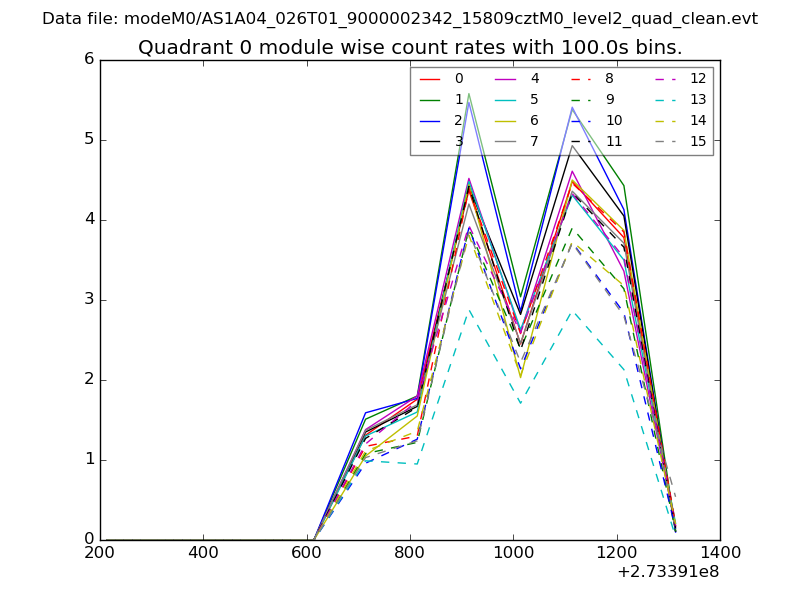 |
 |
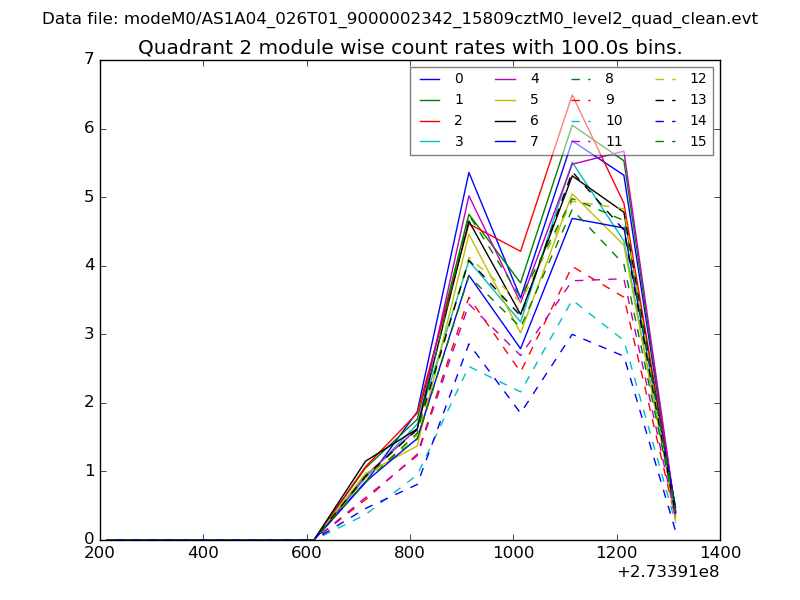
| Module-wise count rates for Quadrant B Data is divided into 100 sec bins |
 |
 |
| Module-wise count rates for Quadrant C Data is divided into 100 sec bins |
 |
 |
| Module-wise count rates for Quadrant D Data is divided into 100 sec bins |
 |
 |
| Parameter | Plot |
|---|---|
| CZT HV Monitor | 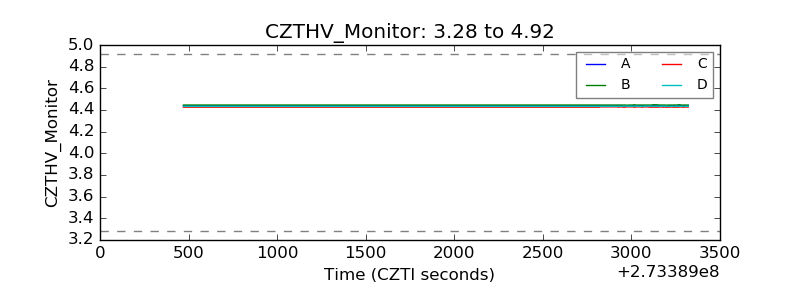 |
| D_VDD | 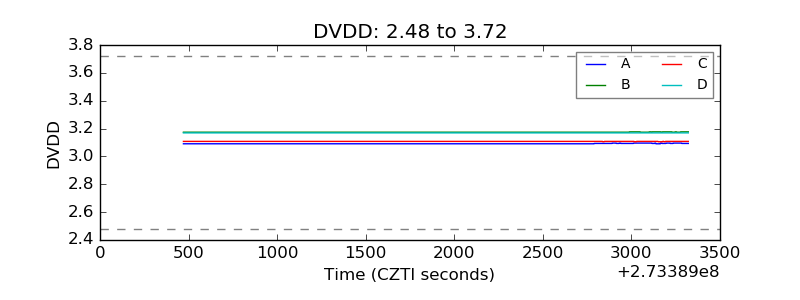 |
| Temperature 1 | 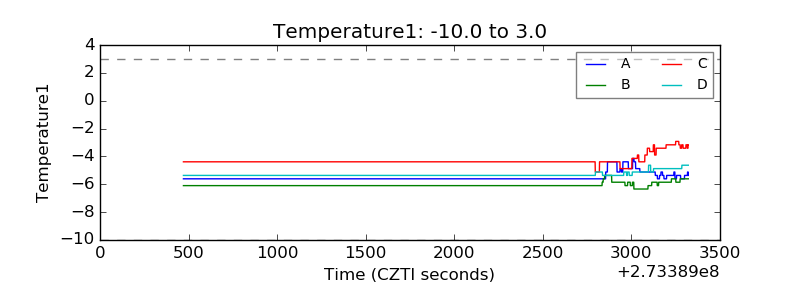 |
| Veto HV Monitor | 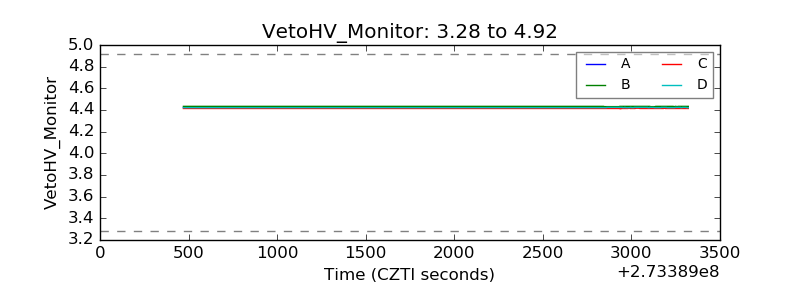 |
| Veto LLD | 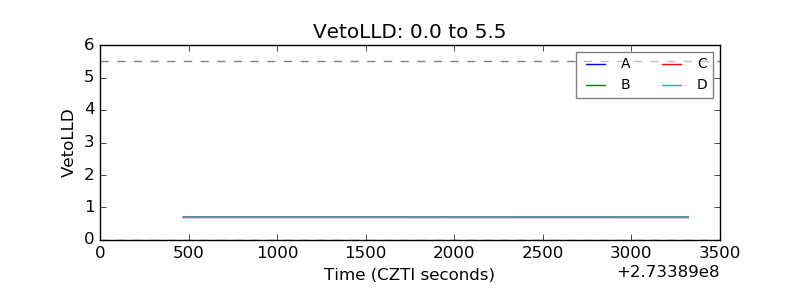 |
| Alpha Counter | 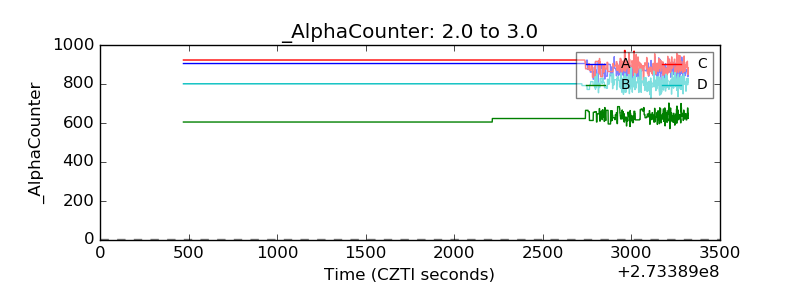 |
| _CPM_Rate | 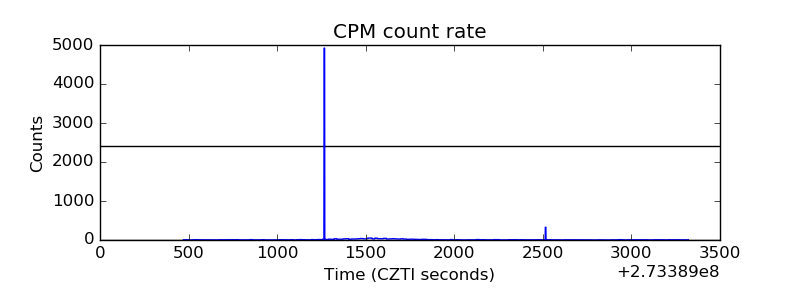 |
| CZT Counter | 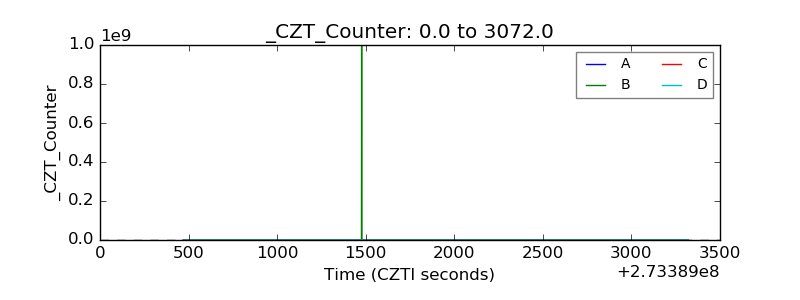 |
| +2.5 Volts monitor |  |
| +5 Volts monitor |  |
| _ROLL_ROT | 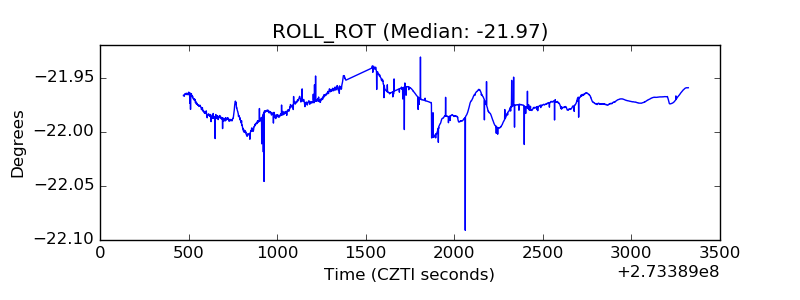 |
| _Roll_DEC | 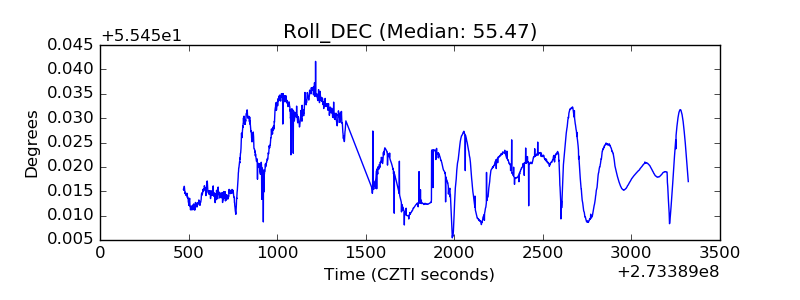 |
| _Roll_RA | 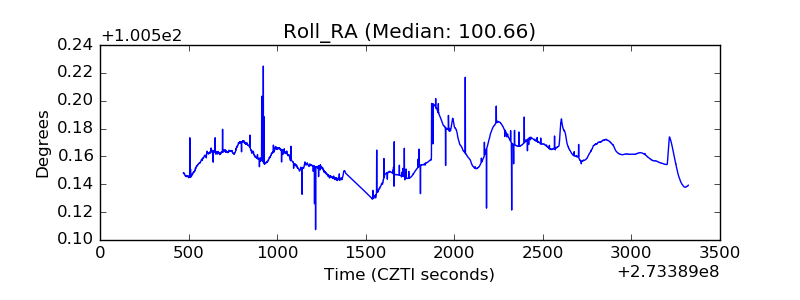 |
| Veto Counter | 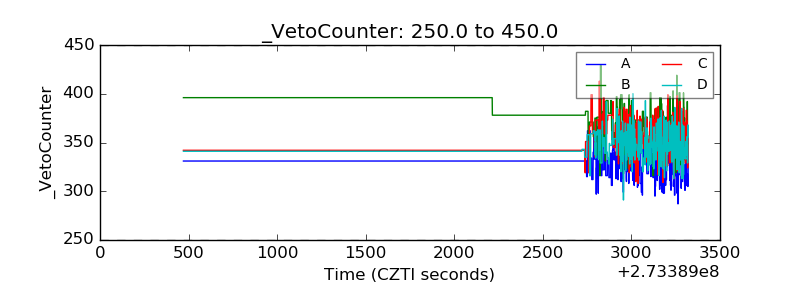 |