| Param | Original file | Final file |
|---|---|---|
| Filename | modeM0/AS1A04_026T01_9000002342_15810cztM0_level2.evt | modeM0/AS1A04_026T01_9000002342_15810cztM0_level2_quad_clean.evt |
| Size (bytes) | 936,233,280 | 175,273,920 |
| Size | 892.9 MB | 167.2 MB |
| Events in quadrant A | 8,750,782 | 1,069,291 |
| Events in quadrant B | 6,953,716 | 1,125,230 |
| Events in quadrant C | 6,040,277 | 1,120,618 |
| Events in quadrant D | 5,734,407 | 1,099,952 |
| Mode SS | |||
|---|---|---|---|
| Quadrant | BADHDUFLAG | Total packets | Discarded packets |
| A | 0 | 264 | 0 |
| B | 0 | 264 | 0 |
| C | 0 | 264 | 0 |
| D | 0 | 264 | 0 |
| Mode M9 | |||
|---|---|---|---|
| Quadrant | BADHDUFLAG | Total packets | Discarded packets |
| A | 0 | 7 | 0 |
| B | 0 | 7 | 0 |
| C | 0 | 7 | 0 |
| D | 0 | 7 | 0 |
| Mode M0 | |||
|---|---|---|---|
| Quadrant | BADHDUFLAG | Total packets | Discarded packets |
| A | 0 | 34818 | 4 |
| B | 0 | 29372 | 3 |
| C | 0 | 26797 | 3 |
| D | 0 | 26746 | 3 |
| Quadrant | Total seconds | Saturated seconds | Saturation percentage |
|---|---|---|---|
| A | 12917 | 850 | 6.580475% |
| B | 12917 | 327 | 2.531548% |
| C | 12917 | 240 | 1.858017% |
| D | 12917 | 133 | 1.029651% |
Noise dominated data is calculated using 1-second bins in cleaned event files. If a bin has >2000 counts, and if more than 50% of those come from <1% of pixels, then it is considered to be noise-dominated and hence unusable.
| Quadrant | # 1 sec bins | Bins with >0 counts | Bins with >2000 counts | High rate bins dominated by noise | Noise dominated (total time) | Noise dominated (detector-on time) | Marked lightcurve |
|---|---|---|---|---|---|---|---|
| A | 13623 | 12924 | 500 | 500 | 3.67% | 3.87% | 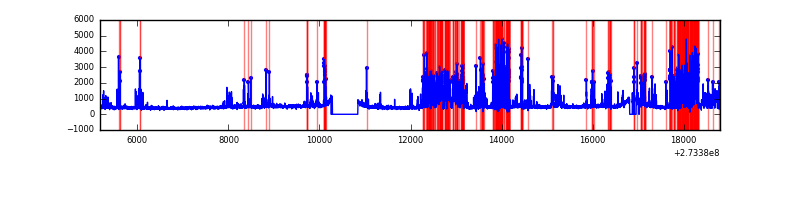 |
| B | 13623 | 12924 | 59 | 59 | 0.43% | 0.46% | 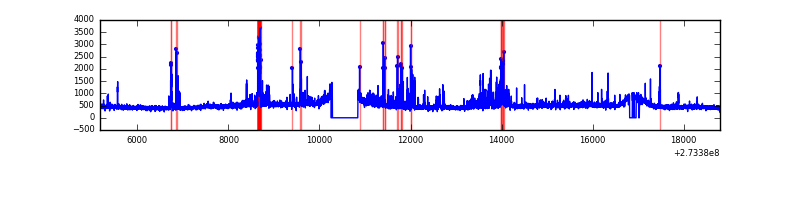 |
| C | 13623 | 12924 | 2 | 2 | 0.01% | 0.02% | 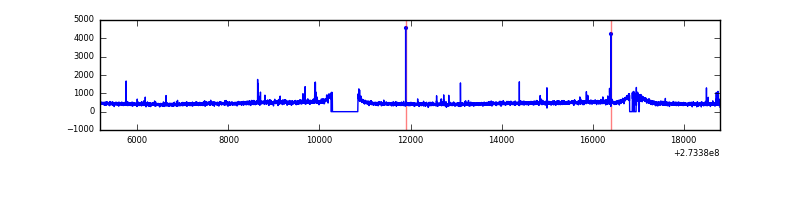 |
| D | 13623 | 12924 | 21 | 21 | 0.15% | 0.16% |  |
Top three noisy pixels from each quadrant. If the there are fewer than three noisy pixels in the level2.evt file, extra rows are filled as -1
| Pixel properties | Quadrant properties | ||||||
|---|---|---|---|---|---|---|---|
| Quadrant | DetID | PixID | Counts | Sigma | Mean | Median | Sigma |
| A | 15 | 239 | 3000588 | 9974.0 | 1487 | 1453 | 300.7 |
| A | 9 | 143 | 19849 | 61.18 | 1487 | 1453 | 300.7 |
| A | 0 | 226 | 13210 | 39.1 | 1487 | 1453 | 300.7 |
| B | 10 | 245 | 433194 | 1491.78 | 1519 | 1479 | 289.4 |
| B | 4 | 173 | 220034 | 755.21 | 1519 | 1479 | 289.4 |
| B | 0 | 229 | 134559 | 459.85 | 1519 | 1479 | 289.4 |
| C | 14 | 238 | 223798 | 655.93 | 1461 | 1470 | 338.9 |
| C | 3 | 233 | 42646 | 121.48 | 1461 | 1470 | 338.9 |
| C | 0 | 207 | 35370 | 100.01 | 1461 | 1470 | 338.9 |
| D | 2 | 234 | 53624 | 142.36 | 1480 | 1436 | 366.6 |
| D | 10 | 70 | 45134 | 119.2 | 1480 | 1436 | 366.6 |
| D | 2 | 120 | 38631 | 101.46 | 1480 | 1436 | 366.6 |
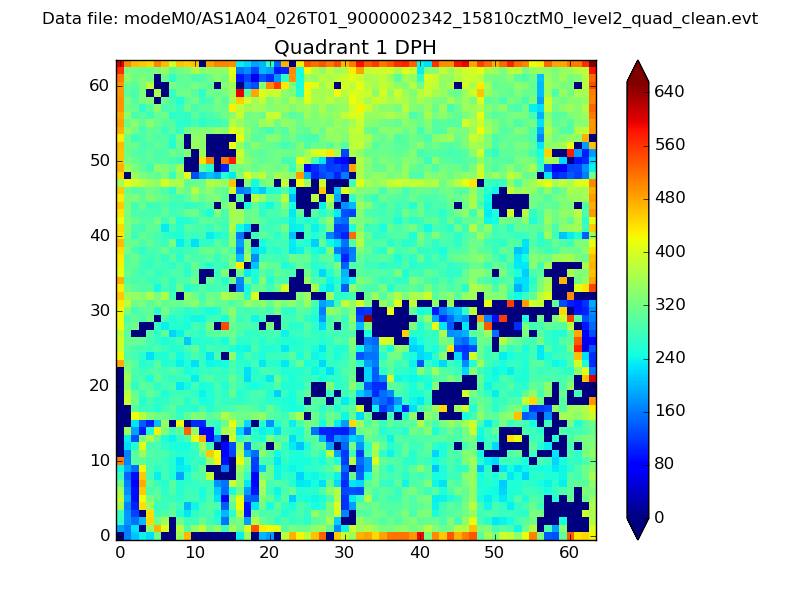
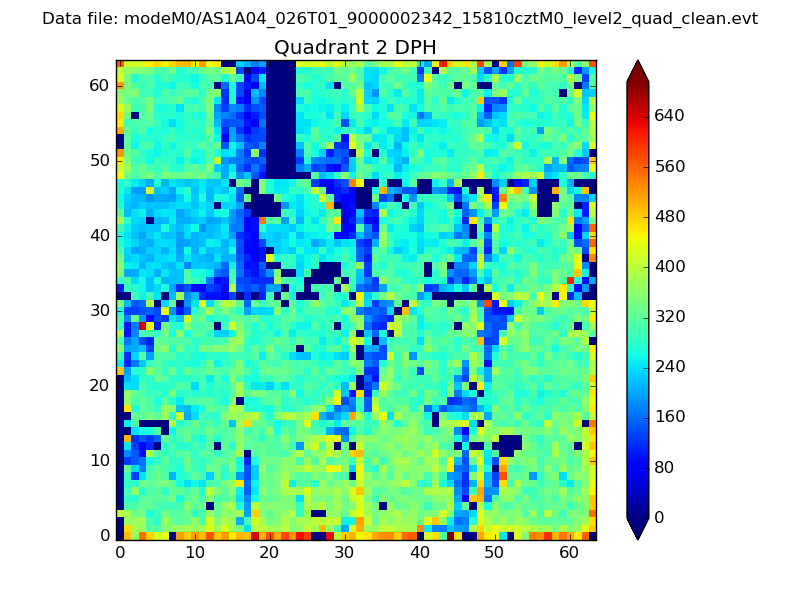
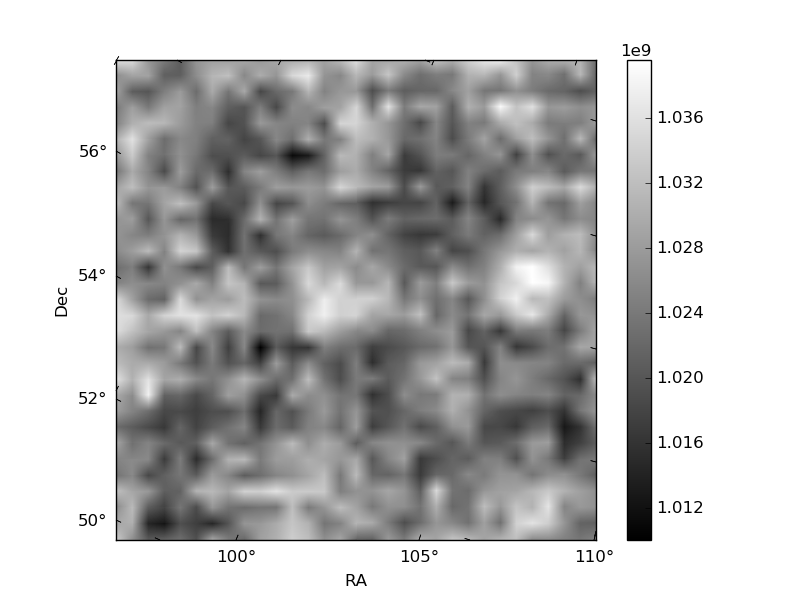
Histogram calculated using DETX and DETY for each event in the final _common_clean file
| Quadrant A | 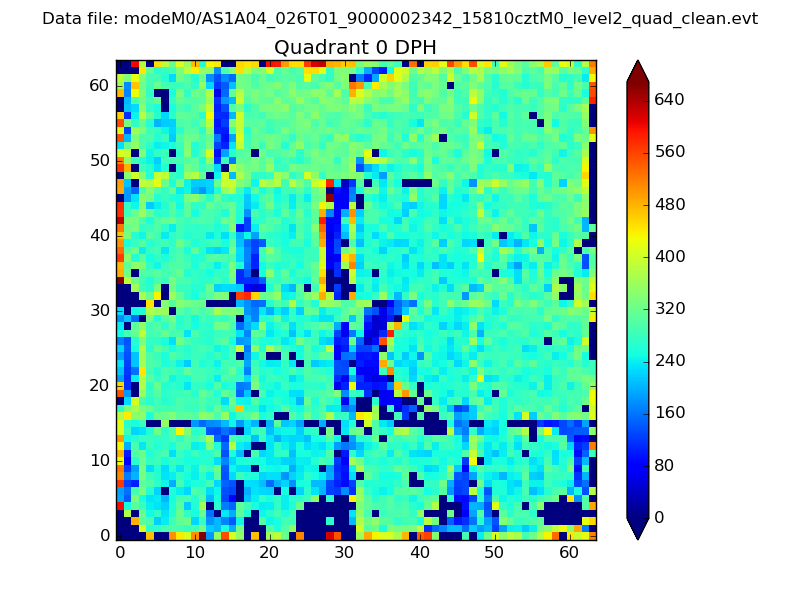 |
 |
Quadrant B |
|---|---|---|---|
| Quadrant D | 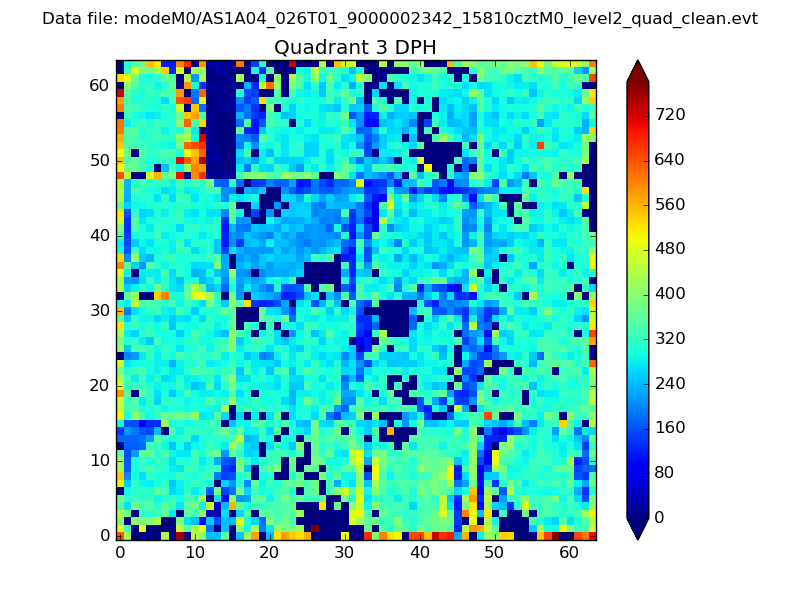 |
 |
Quadrant C |
| Plot type | Count rate plots | Images |
|---|---|---|
| Comparison with Poisson distribution Blue bars denote a histogram of data divided into 1 sec bins. Red curve is a Poisson curve with rate = median count rate of data. |
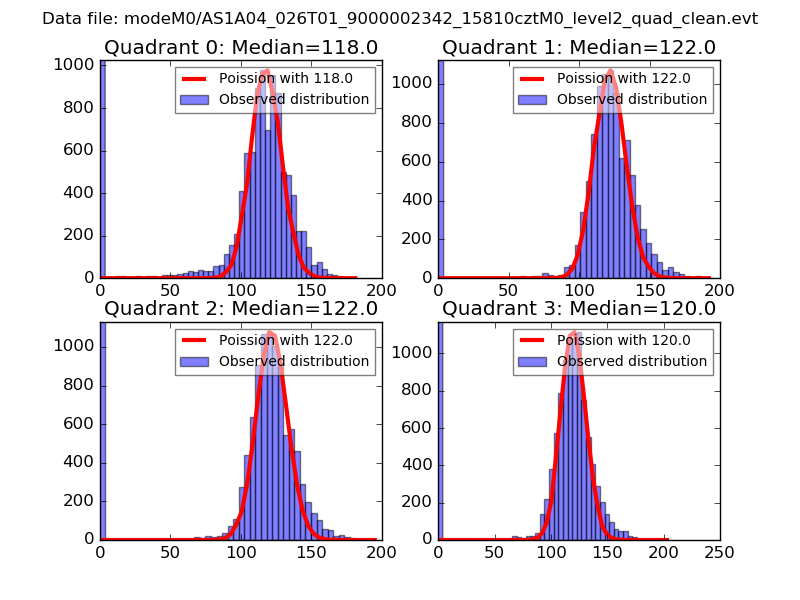 |
 |
| Quadrant-wise count rates Data is divided into 100 sec bins |
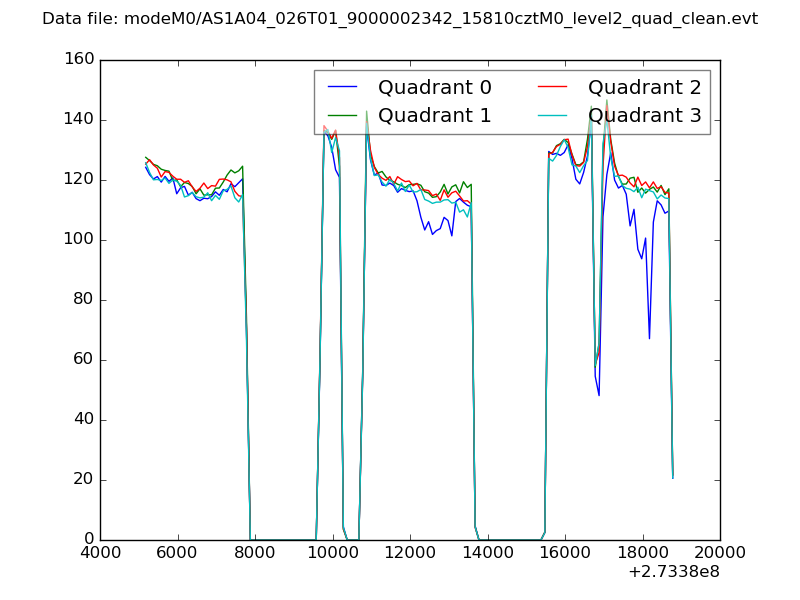 |
|
| Module-wise count rates for Quadrant A Data is divided into 100 sec bins |
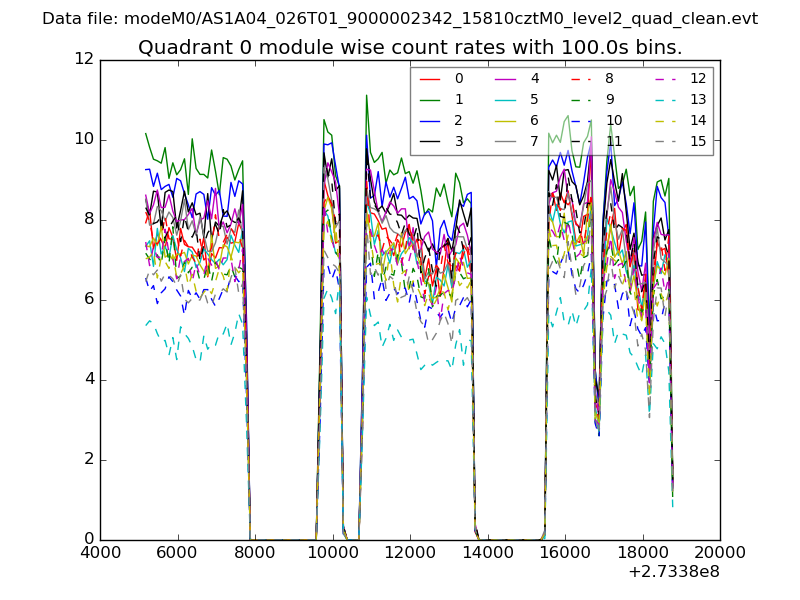 |
 |
| Module-wise count rates for Quadrant B Data is divided into 100 sec bins |
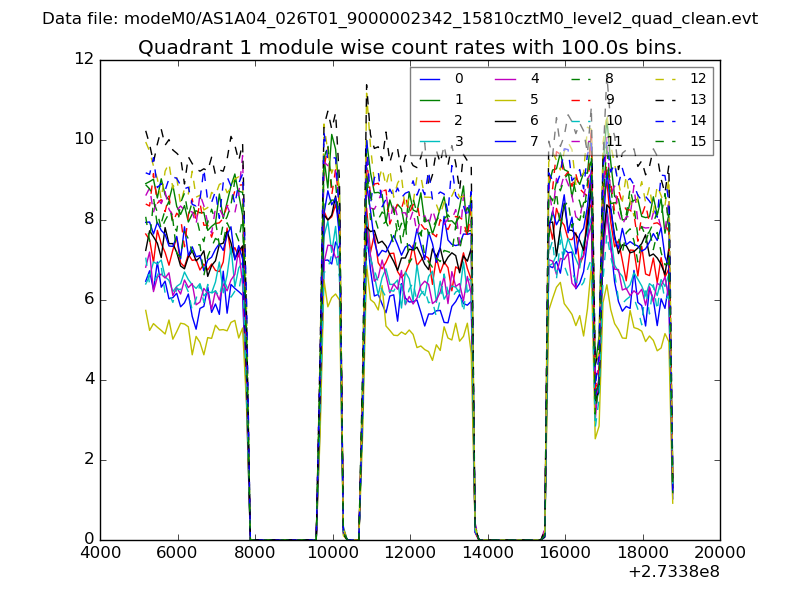 |
 |
| Module-wise count rates for Quadrant C Data is divided into 100 sec bins |
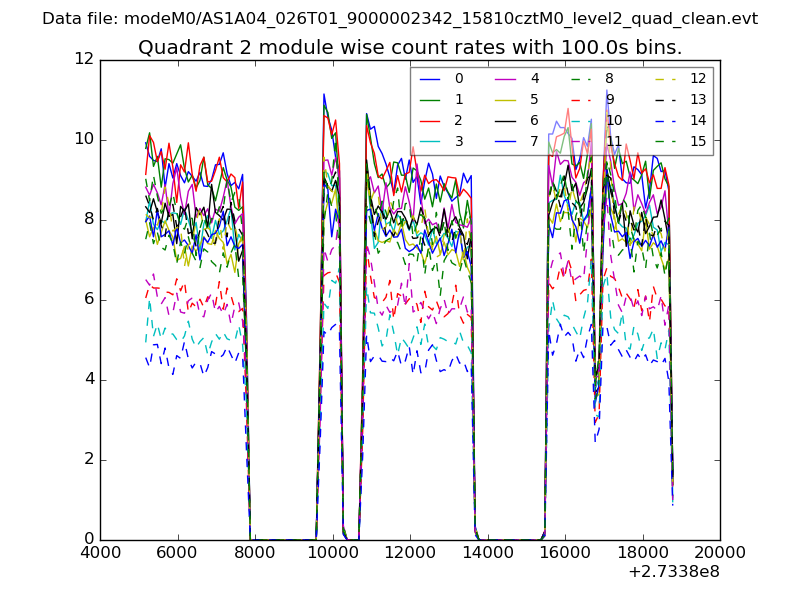 |
 |
| Module-wise count rates for Quadrant D Data is divided into 100 sec bins |
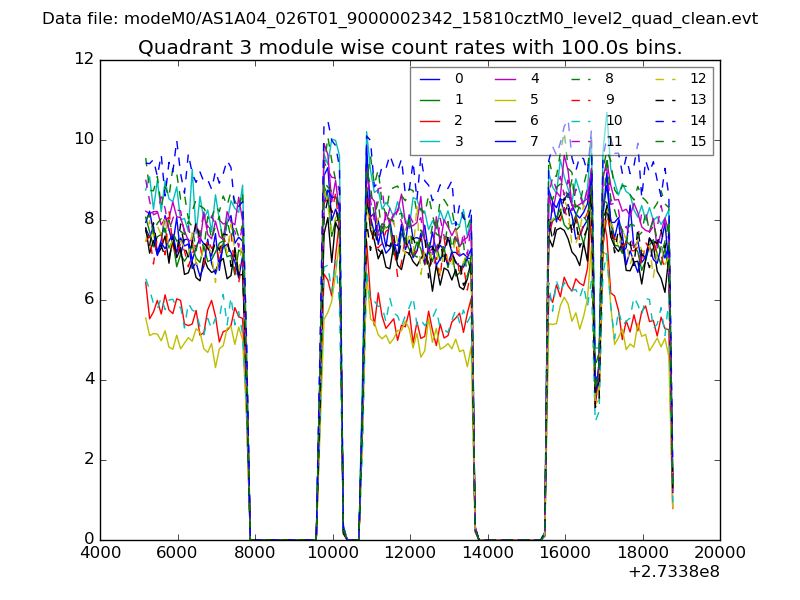 |
 |
| Parameter | Plot |
|---|---|
| CZT HV Monitor | 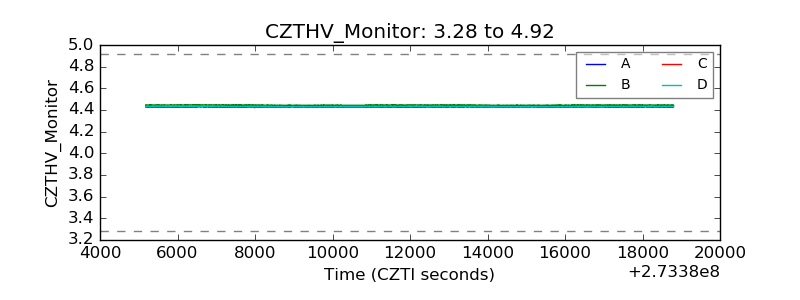 |
| D_VDD |  |
| Temperature 1 | 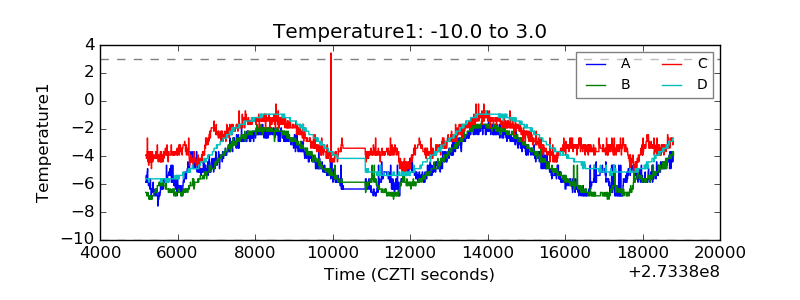 |
| Veto HV Monitor | 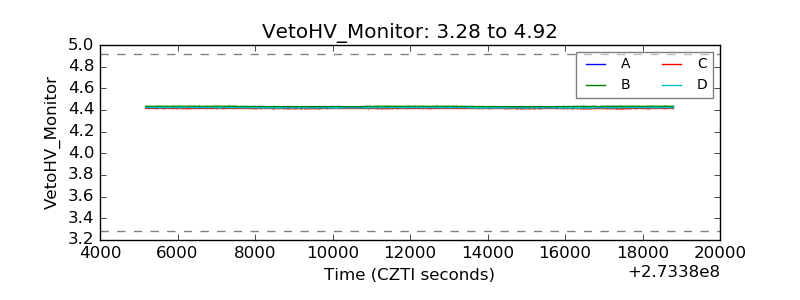 |
| Veto LLD | 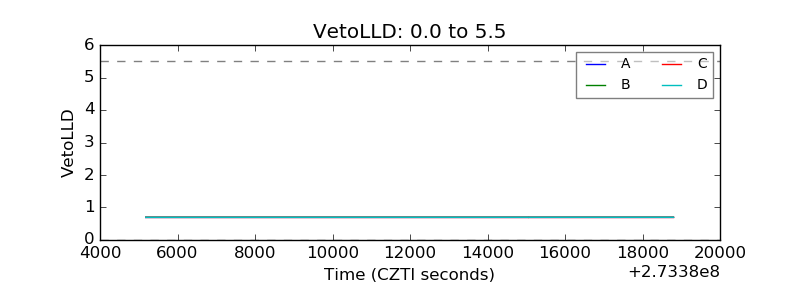 |
| Alpha Counter | 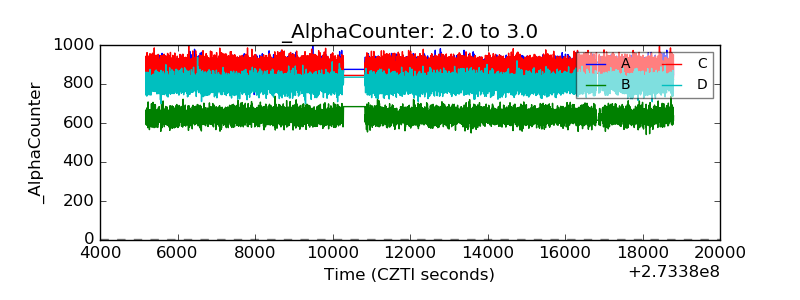 |
| _CPM_Rate | 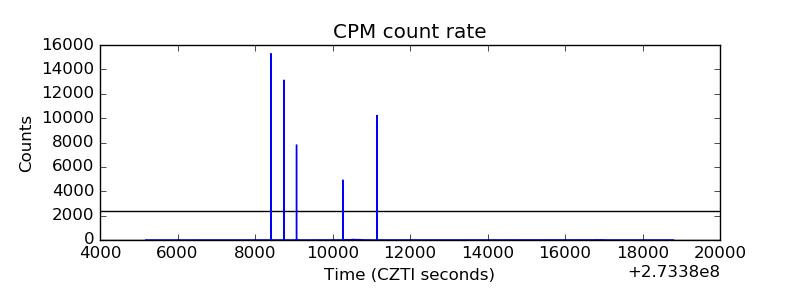 |
| CZT Counter | 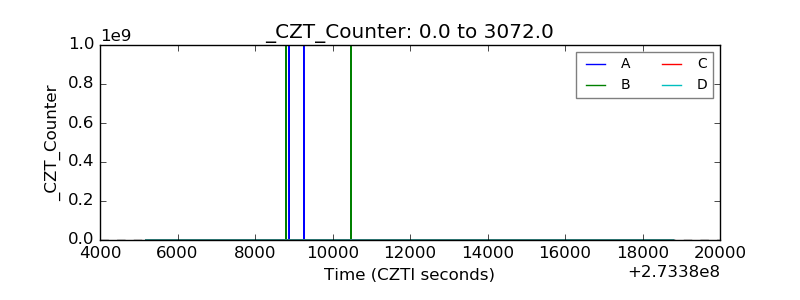 |
| +2.5 Volts monitor |  |
| +5 Volts monitor | 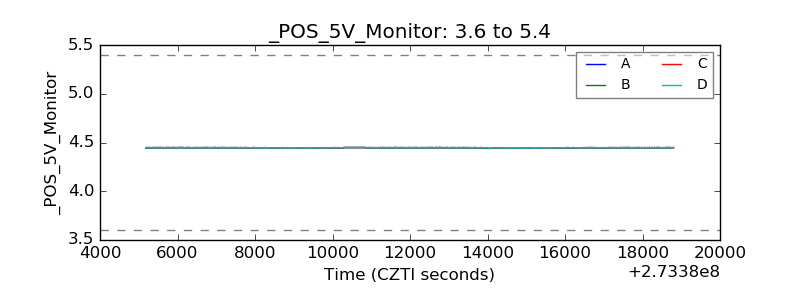 |
| _ROLL_ROT | 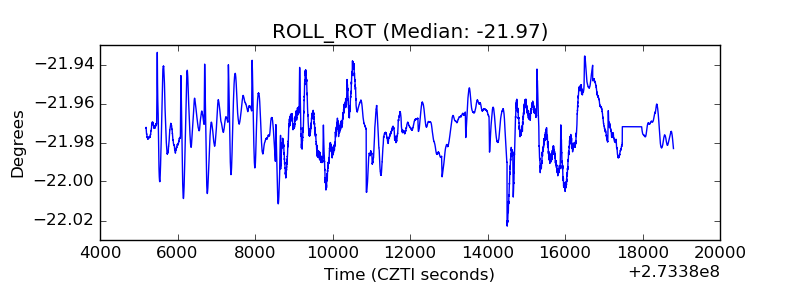 |
| _Roll_DEC | 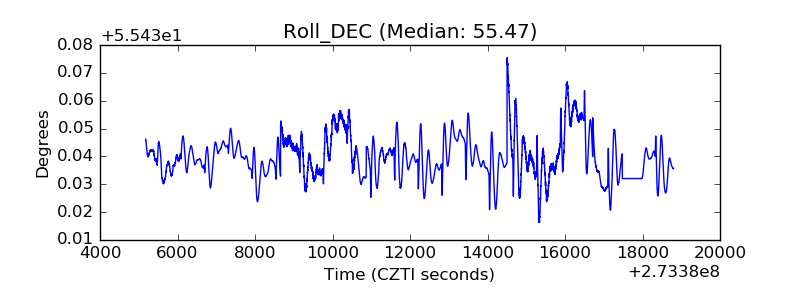 |
| _Roll_RA | 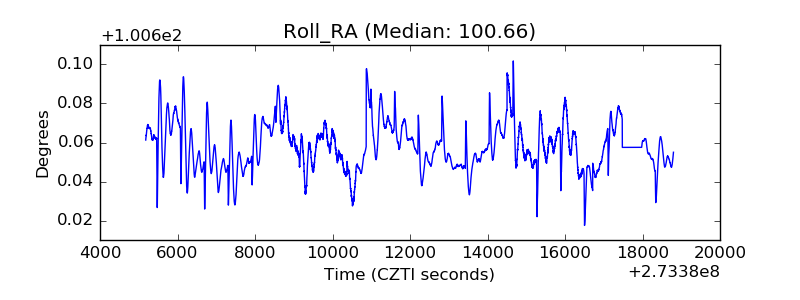 |
| Veto Counter | 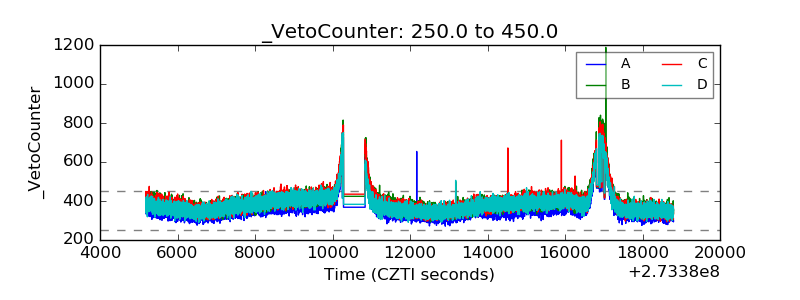 |