| Param | Original file | Final file |
|---|---|---|
| Filename | modeM0/AS1A04_026T01_9000002342_15811cztM0_level2.evt | modeM0/AS1A04_026T01_9000002342_15811cztM0_level2_quad_clean.evt |
| Size (bytes) | 482,993,280 | 91,961,280 |
| Size | 460.6 MB | 87.7 MB |
| Events in quadrant A | 4,753,961 | 558,338 |
| Events in quadrant B | 3,283,649 | 592,569 |
| Events in quadrant C | 3,106,393 | 588,627 |
| Events in quadrant D | 3,024,706 | 574,790 |
| Mode SS | |||
|---|---|---|---|
| Quadrant | BADHDUFLAG | Total packets | Discarded packets |
| A | 0 | 138 | 0 |
| B | 0 | 138 | 0 |
| C | 0 | 138 | 0 |
| D | 0 | 138 | 0 |
| Mode M9 | |||
|---|---|---|---|
| Quadrant | BADHDUFLAG | Total packets | Discarded packets |
| A | 0 | 2 | 0 |
| B | 0 | 2 | 0 |
| C | 0 | 2 | 0 |
| D | 0 | 2 | 0 |
| Mode M0 | |||
|---|---|---|---|
| Quadrant | BADHDUFLAG | Total packets | Discarded packets |
| A | 0 | 18620 | 2 |
| B | 0 | 14271 | 1 |
| C | 0 | 13833 | 1 |
| D | 0 | 14019 | 1 |
| Quadrant | Total seconds | Saturated seconds | Saturation percentage |
|---|---|---|---|
| A | 6746 | 525 | 7.782390% |
| B | 6746 | 112 | 1.660243% |
| C | 6746 | 100 | 1.482360% |
| D | 6746 | 69 | 1.022828% |
Noise dominated data is calculated using 1-second bins in cleaned event files. If a bin has >2000 counts, and if more than 50% of those come from <1% of pixels, then it is considered to be noise-dominated and hence unusable.
| Quadrant | # 1 sec bins | Bins with >0 counts | Bins with >2000 counts | High rate bins dominated by noise | Noise dominated (total time) | Noise dominated (detector-on time) | Marked lightcurve |
|---|---|---|---|---|---|---|---|
| A | 6997 | 6749 | 328 | 328 | 4.69% | 4.86% | 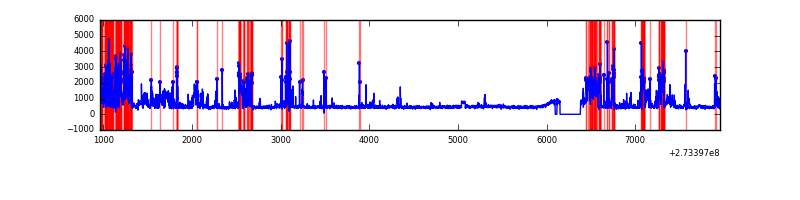 |
| B | 6997 | 6749 | 10 | 10 | 0.14% | 0.15% | 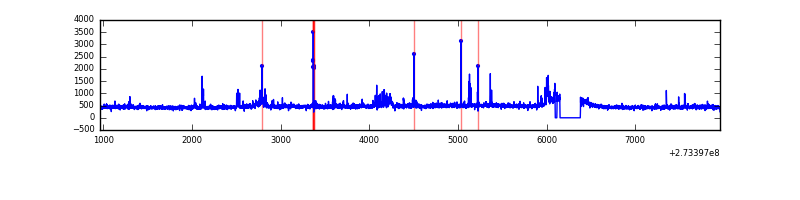 |
| C | 6997 | 6749 | 5 | 5 | 0.07% | 0.07% | 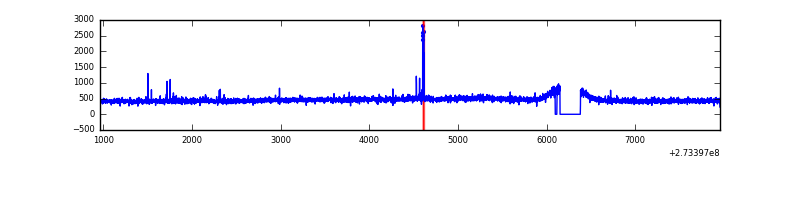 |
| D | 6997 | 6749 | 7 | 7 | 0.10% | 0.10% | 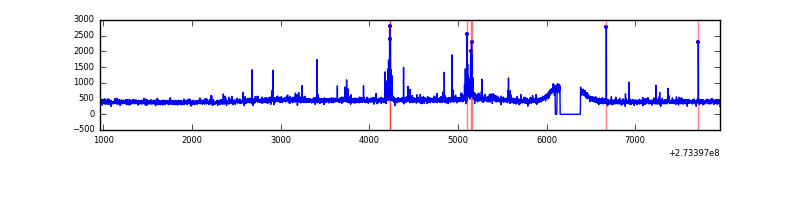 |
Top three noisy pixels from each quadrant. If the there are fewer than three noisy pixels in the level2.evt file, extra rows are filled as -1
| Pixel properties | Quadrant properties | ||||||
|---|---|---|---|---|---|---|---|
| Quadrant | DetID | PixID | Counts | Sigma | Mean | Median | Sigma |
| A | 15 | 239 | 1734936 | 11037.96 | 765 | 746 | 157.1 |
| A | 13 | 210 | 50935 | 319.45 | 765 | 746 | 157.1 |
| A | 13 | 248 | 18073 | 110.28 | 765 | 746 | 157.1 |
| B | 4 | 173 | 63813 | 423.85 | 780 | 762 | 148.8 |
| B | 4 | 216 | 54288 | 359.82 | 780 | 762 | 148.8 |
| B | 4 | 48 | 46897 | 310.14 | 780 | 762 | 148.8 |
| C | 14 | 238 | 115270 | 654.9 | 749 | 753 | 174.9 |
| C | 10 | 22 | 39985 | 224.36 | 749 | 753 | 174.9 |
| C | 3 | 233 | 24986 | 138.58 | 749 | 753 | 174.9 |
| D | 10 | 70 | 44323 | 235.31 | 761 | 735 | 185.2 |
| D | 13 | 172 | 38487 | 203.8 | 761 | 735 | 185.2 |
| D | 2 | 152 | 32505 | 171.51 | 761 | 735 | 185.2 |
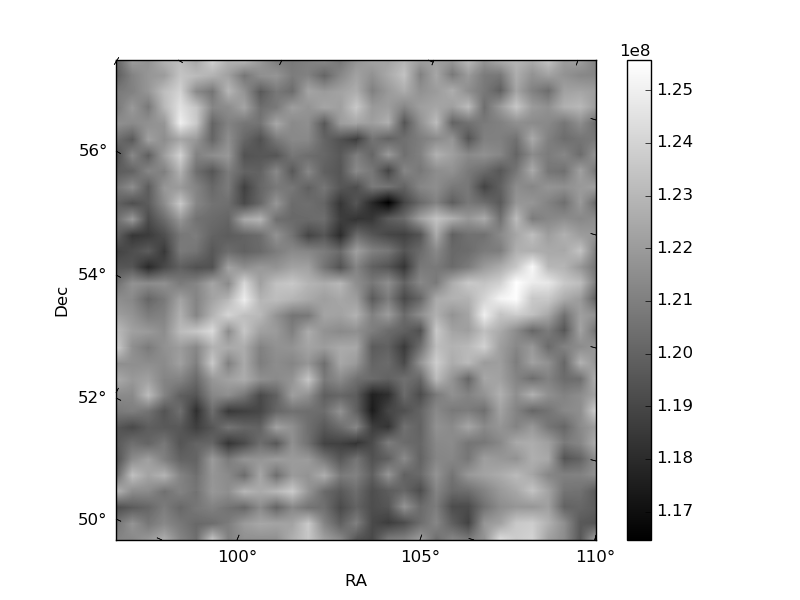
Histogram calculated using DETX and DETY for each event in the final _common_clean file
| Quadrant A | 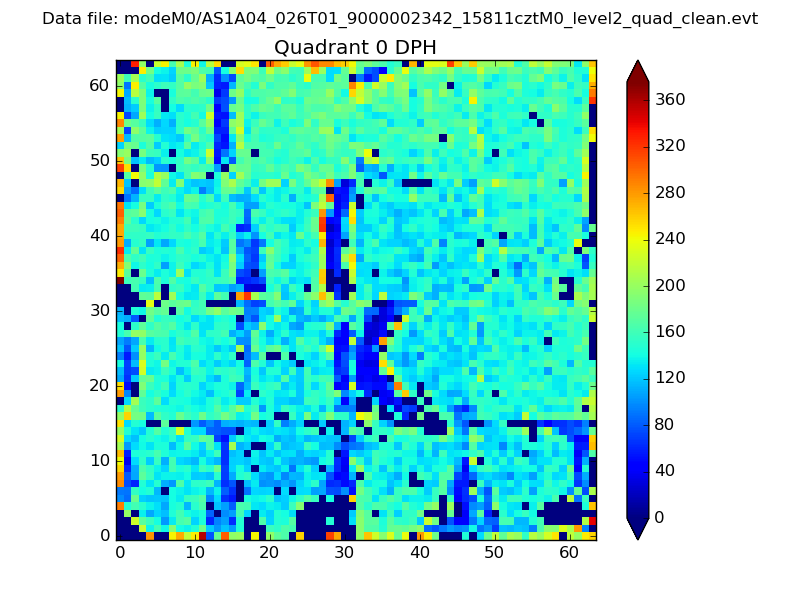 |
 |
Quadrant B |
|---|---|---|---|
| Quadrant D | 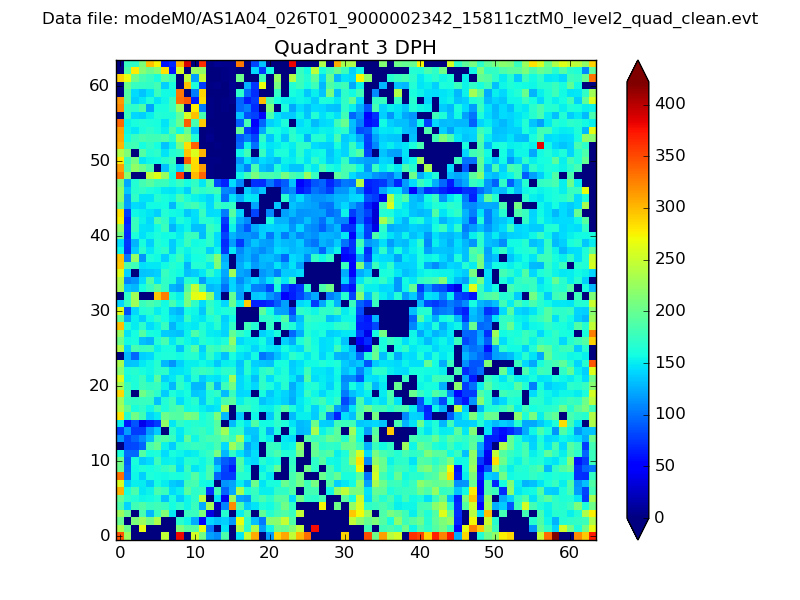 |
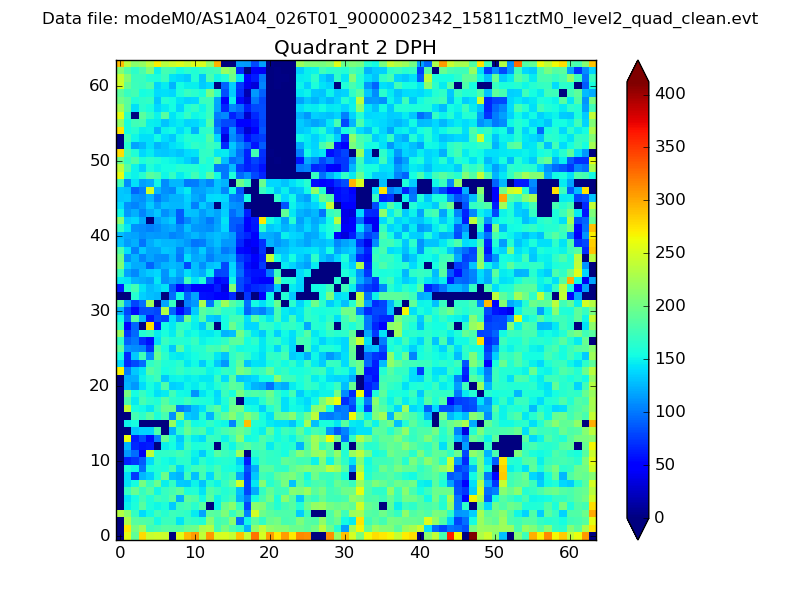 |
Quadrant C |
| Plot type | Count rate plots | Images |
|---|---|---|
| Comparison with Poisson distribution Blue bars denote a histogram of data divided into 1 sec bins. Red curve is a Poisson curve with rate = median count rate of data. |
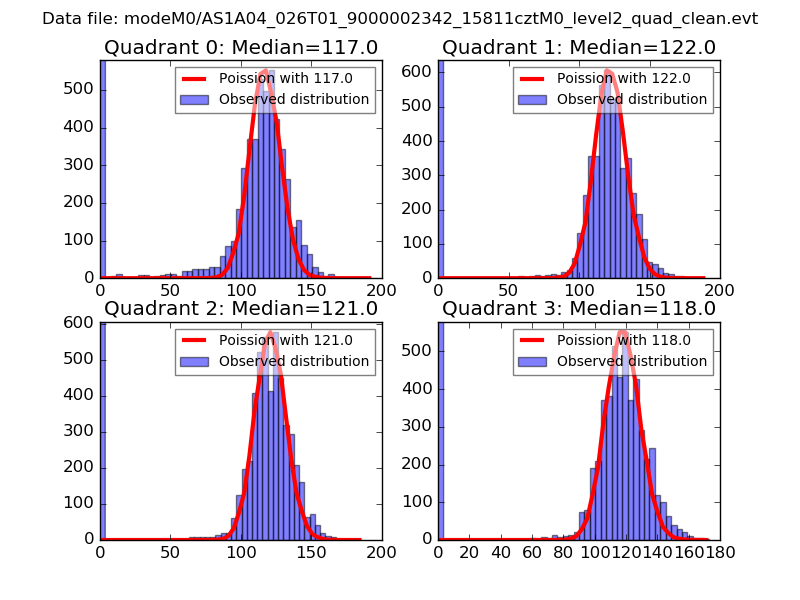 |
 |
| Quadrant-wise count rates Data is divided into 100 sec bins |
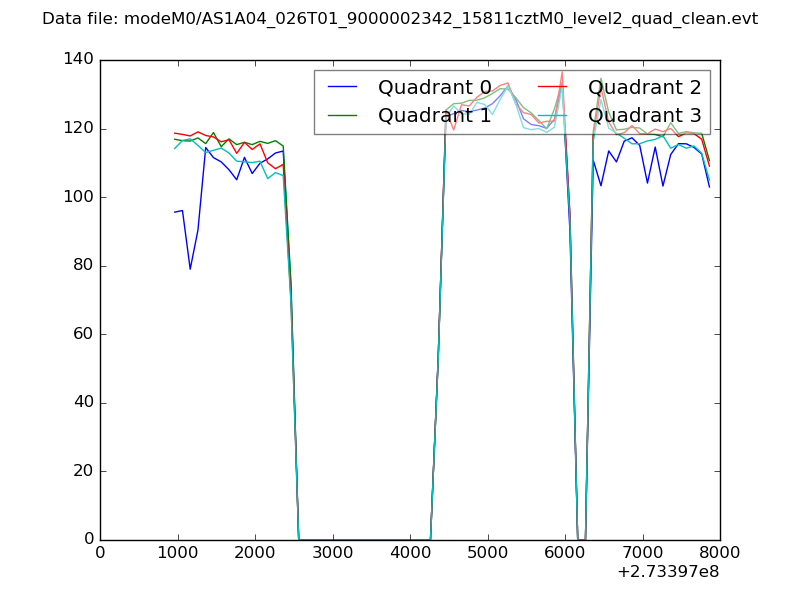 |
|
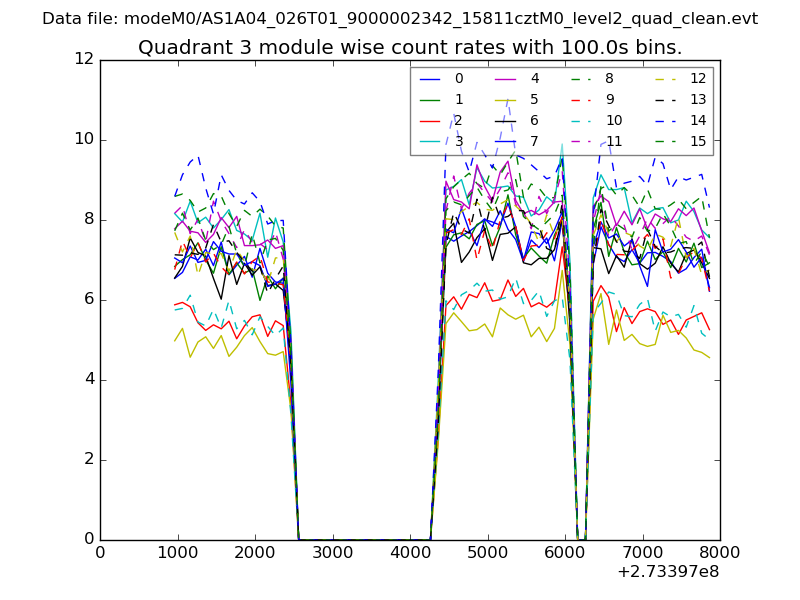
| Module-wise count rates for Quadrant A Data is divided into 100 sec bins |
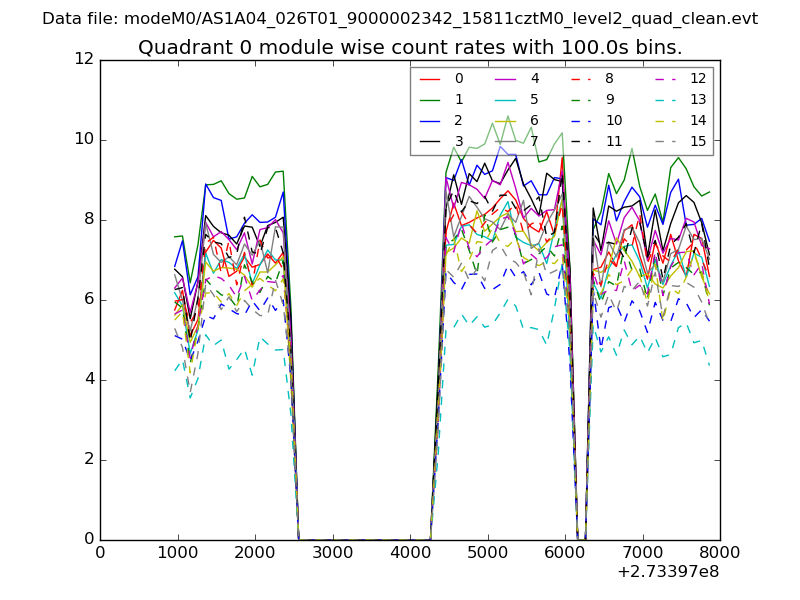 |
 |
| Module-wise count rates for Quadrant B Data is divided into 100 sec bins |
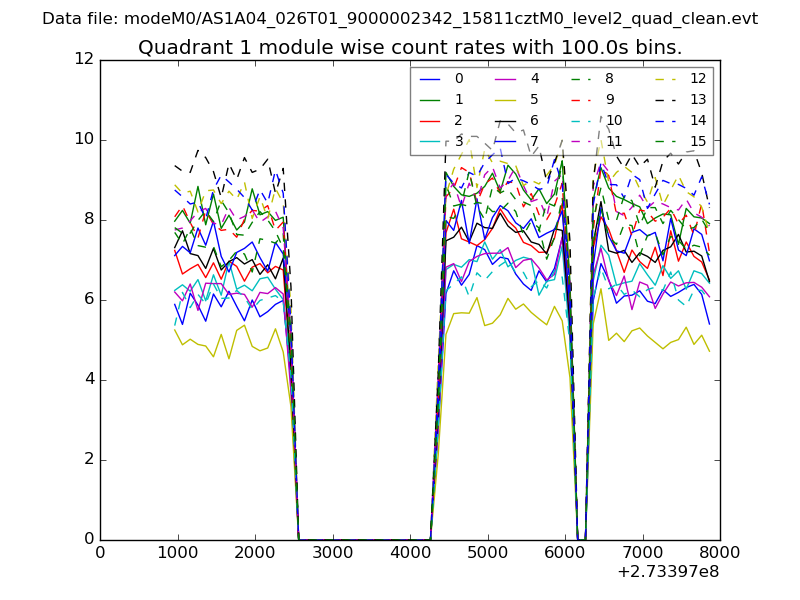 |
 |
| Module-wise count rates for Quadrant C Data is divided into 100 sec bins |
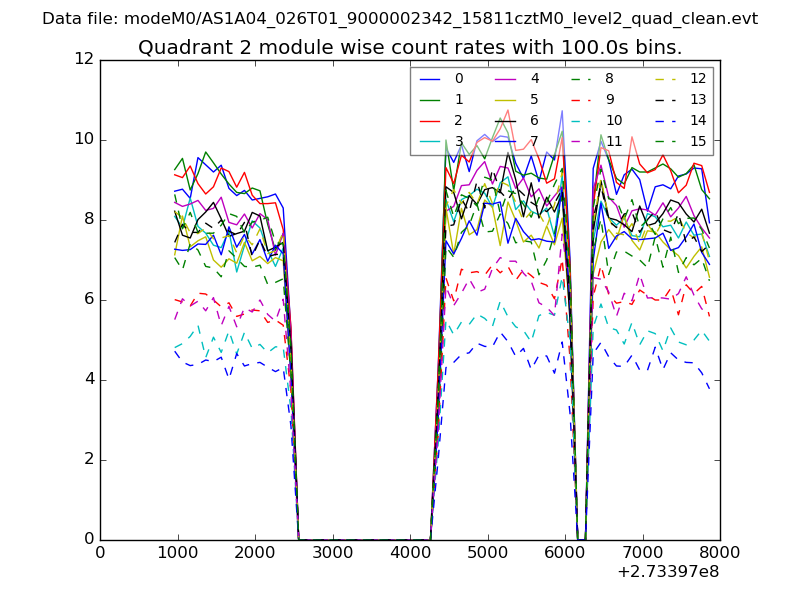 |
 |
| Module-wise count rates for Quadrant D Data is divided into 100 sec bins |
 |
 |
| Parameter | Plot |
|---|---|
| CZT HV Monitor | 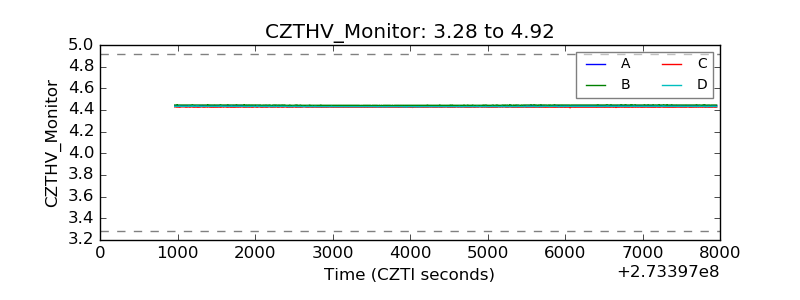 |
| D_VDD | 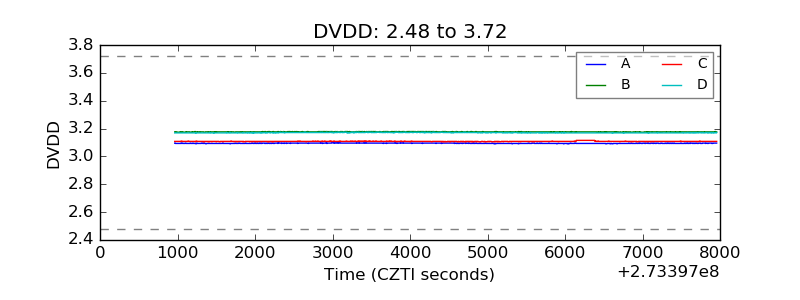 |
| Temperature 1 | 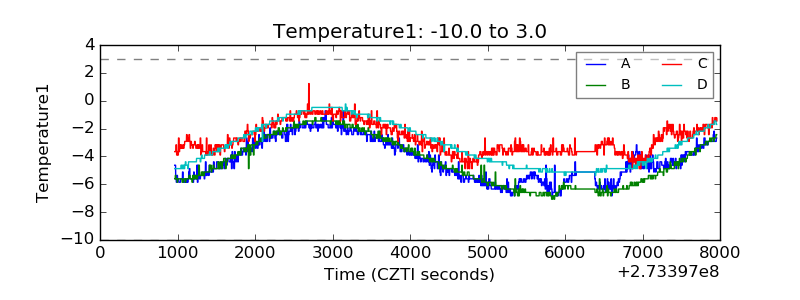 |
| Veto HV Monitor | 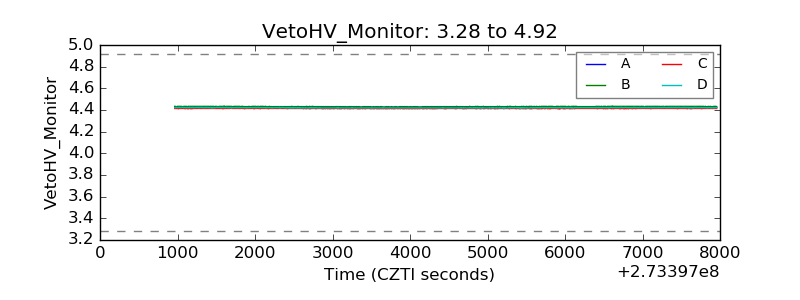 |
| Veto LLD | 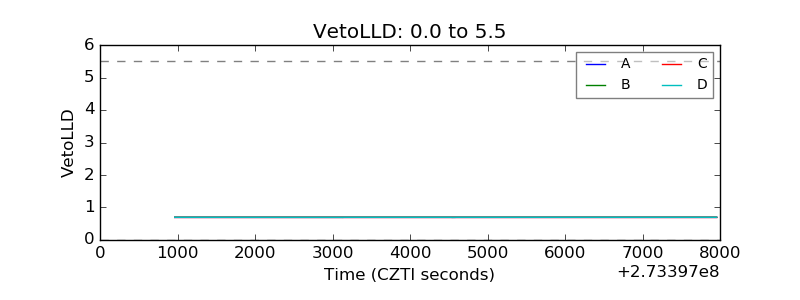 |
| Alpha Counter | 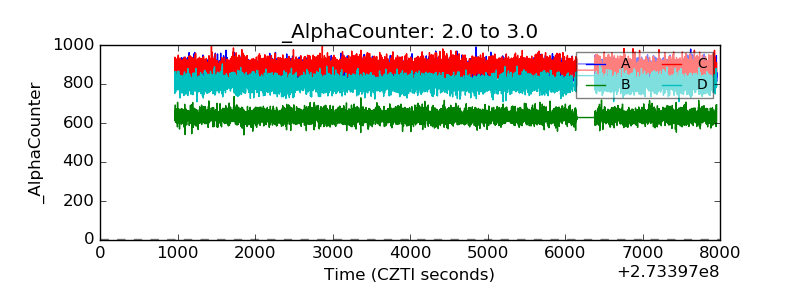 |
| _CPM_Rate | 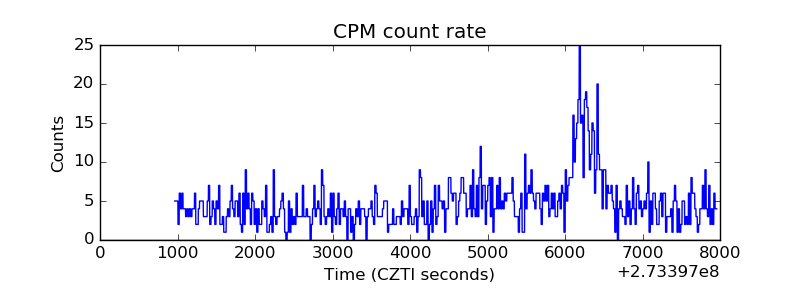 |
| CZT Counter | 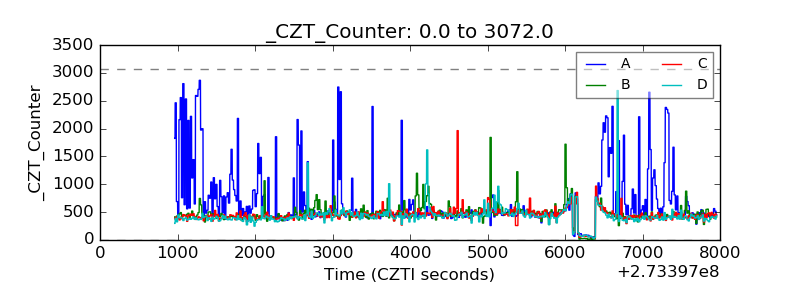 |
| +2.5 Volts monitor | 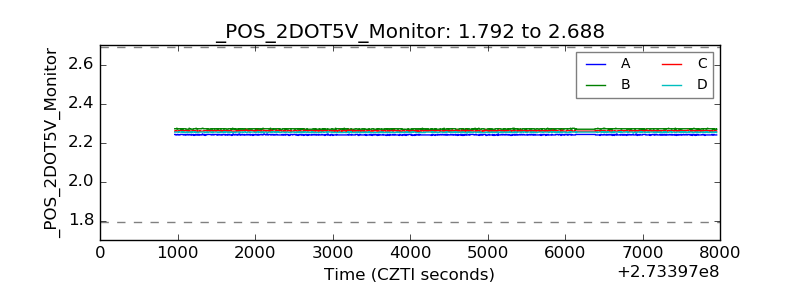 |
| +5 Volts monitor |  |
| _ROLL_ROT | 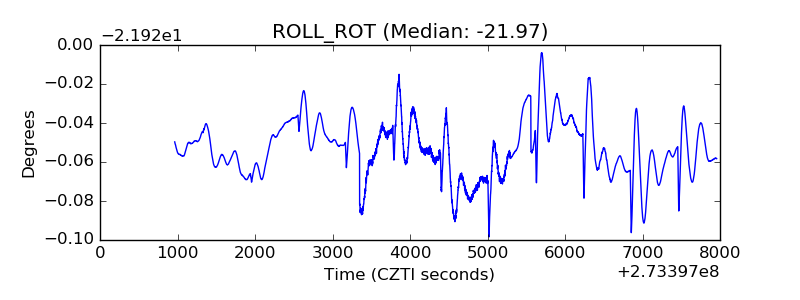 |
| _Roll_DEC | 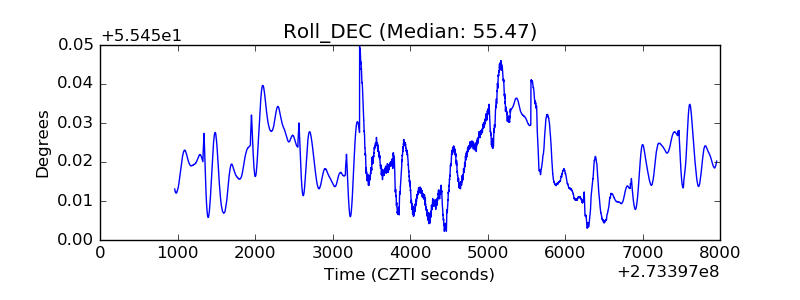 |
| _Roll_RA |  |
| Veto Counter | 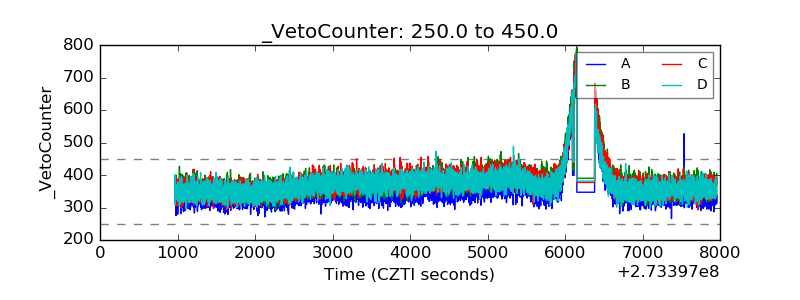 |