| Param | Original file | Final file |
|---|---|---|
| Filename | modeM0/AS1A04_026T01_9000002342_15814cztM0_level2.evt | modeM0/AS1A04_026T01_9000002342_15814cztM0_level2_quad_clean.evt |
| Size (bytes) | 833,567,040 | 156,427,200 |
| Size | 795.0 MB | 149.2 MB |
| Events in quadrant A | 6,651,116 | 963,219 |
| Events in quadrant B | 6,594,266 | 991,606 |
| Events in quadrant C | 5,853,618 | 986,204 |
| Events in quadrant D | 5,338,811 | 972,340 |
| Mode SS | |||
|---|---|---|---|
| Quadrant | BADHDUFLAG | Total packets | Discarded packets |
| A | 0 | 240 | 0 |
| B | 0 | 240 | 0 |
| C | 0 | 240 | 0 |
| D | 0 | 240 | 0 |
| Mode M9 | |||
|---|---|---|---|
| Quadrant | BADHDUFLAG | Total packets | Discarded packets |
| A | 0 | 11 | 0 |
| B | 0 | 11 | 0 |
| C | 0 | 11 | 0 |
| D | 0 | 11 | 0 |
| Mode M0 | |||
|---|---|---|---|
| Quadrant | BADHDUFLAG | Total packets | Discarded packets |
| A | 0 | 27775 | 3 |
| B | 0 | 27267 | 2 |
| C | 0 | 25034 | 2 |
| D | 0 | 24404 | 2 |
| Quadrant | Total seconds | Saturated seconds | Saturation percentage |
|---|---|---|---|
| A | 11921 | 406 | 3.405755% |
| B | 11921 | 310 | 2.600453% |
| C | 11921 | 224 | 1.879037% |
| D | 11921 | 122 | 1.023404% |
Noise dominated data is calculated using 1-second bins in cleaned event files. If a bin has >2000 counts, and if more than 50% of those come from <1% of pixels, then it is considered to be noise-dominated and hence unusable.
| Quadrant | # 1 sec bins | Bins with >0 counts | Bins with >2000 counts | High rate bins dominated by noise | Noise dominated (total time) | Noise dominated (detector-on time) | Marked lightcurve |
|---|---|---|---|---|---|---|---|
| A | 12982 | 11923 | 192 | 192 | 1.48% | 1.61% | 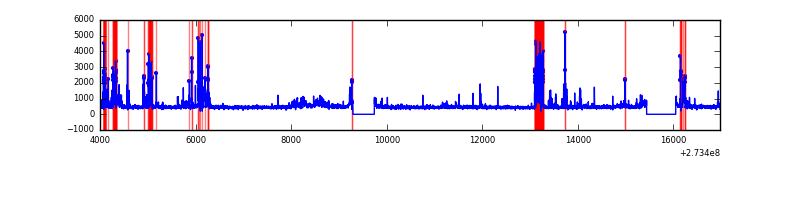 |
| B | 12982 | 11924 | 121 | 121 | 0.93% | 1.01% | 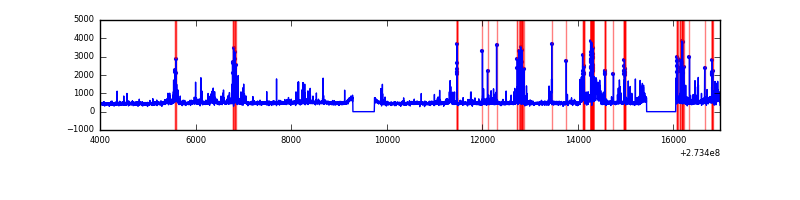 |
| C | 12982 | 11924 | 15 | 15 | 0.12% | 0.13% | 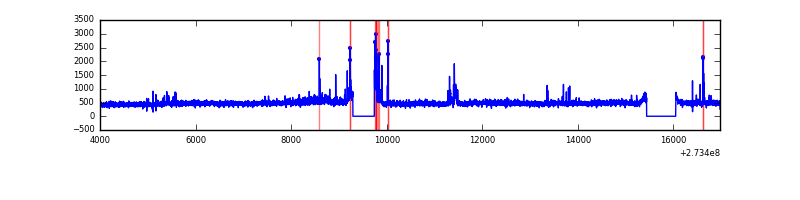 |
| D | 12982 | 11924 | 12 | 12 | 0.09% | 0.10% | 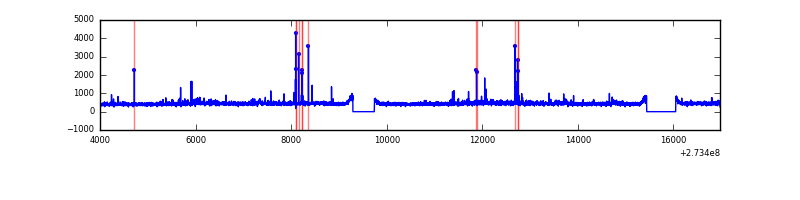 |
Top three noisy pixels from each quadrant. If the there are fewer than three noisy pixels in the level2.evt file, extra rows are filled as -1
| Pixel properties | Quadrant properties | ||||||
|---|---|---|---|---|---|---|---|
| Quadrant | DetID | PixID | Counts | Sigma | Mean | Median | Sigma |
| A | 15 | 239 | 1285476 | 4620.71 | 1371 | 1341 | 277.9 |
| A | 13 | 210 | 44890 | 156.7 | 1371 | 1341 | 277.9 |
| A | 13 | 248 | 29623 | 101.77 | 1371 | 1341 | 277.9 |
| B | 5 | 65 | 604205 | 2296.04 | 1376 | 1337 | 262.6 |
| B | 7 | 220 | 186342 | 704.6 | 1376 | 1337 | 262.6 |
| B | 4 | 48 | 88472 | 331.86 | 1376 | 1337 | 262.6 |
| C | 3 | 233 | 217007 | 700.56 | 1327 | 1334 | 307.9 |
| C | 14 | 238 | 204331 | 659.38 | 1327 | 1334 | 307.9 |
| C | 9 | 54 | 186956 | 602.95 | 1327 | 1334 | 307.9 |
| D | 2 | 152 | 80781 | 226.63 | 1344 | 1308 | 350.7 |
| D | 2 | 234 | 51353 | 142.71 | 1344 | 1308 | 350.7 |
| D | 1 | 52 | 28732 | 78.2 | 1344 | 1308 | 350.7 |
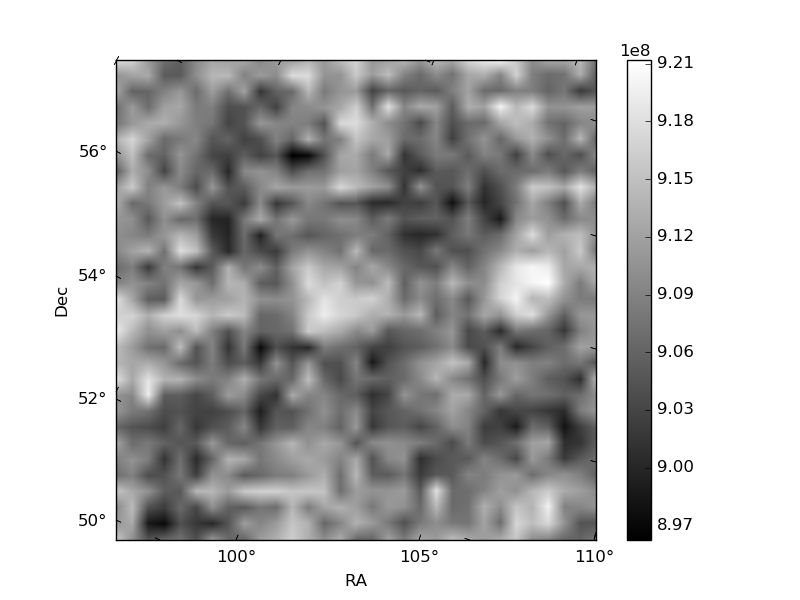
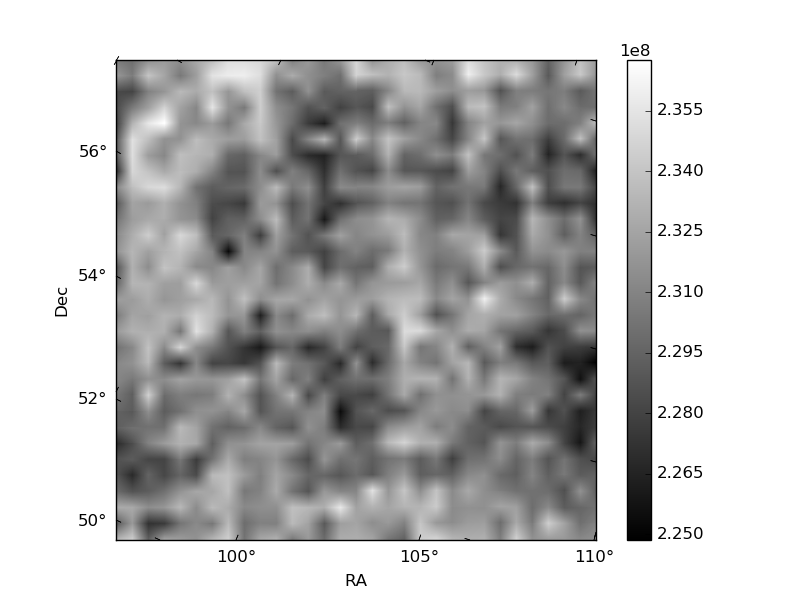
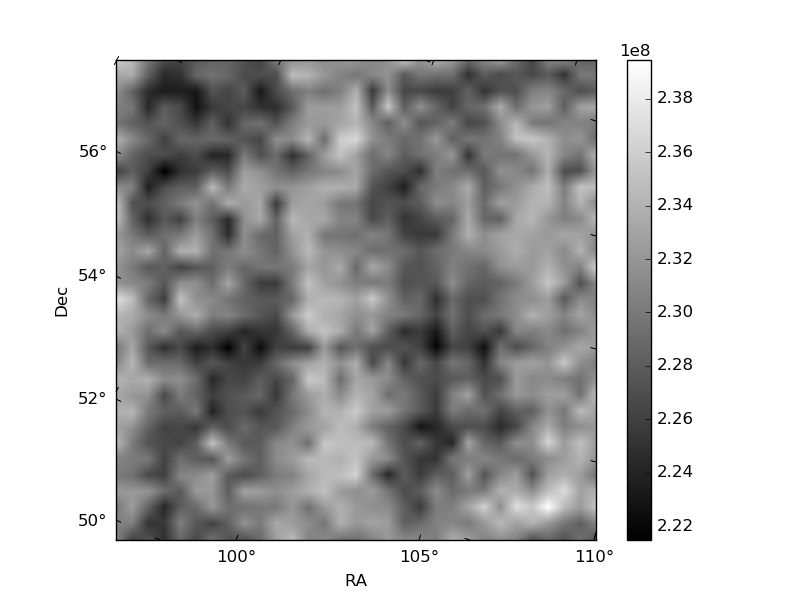
Histogram calculated using DETX and DETY for each event in the final _common_clean file
| Quadrant A | 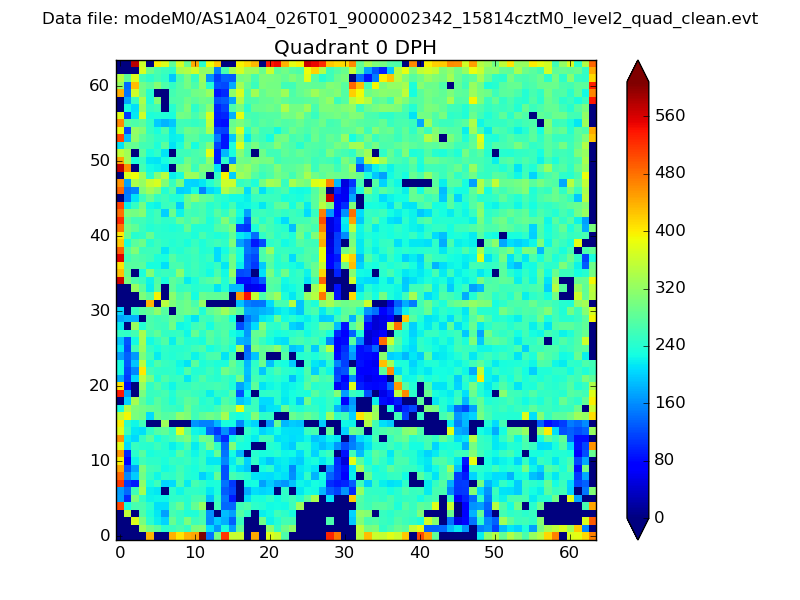 |
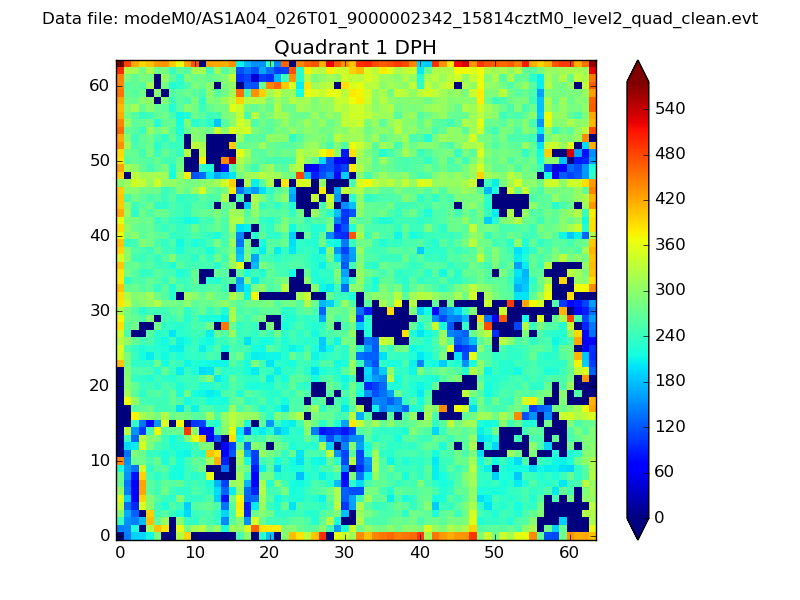 |
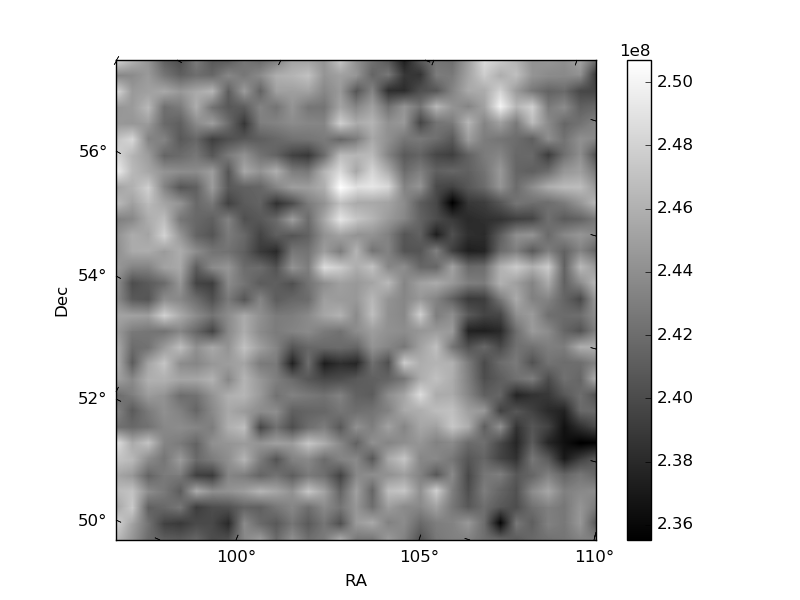
Quadrant B |
|---|---|---|---|
| Quadrant D | 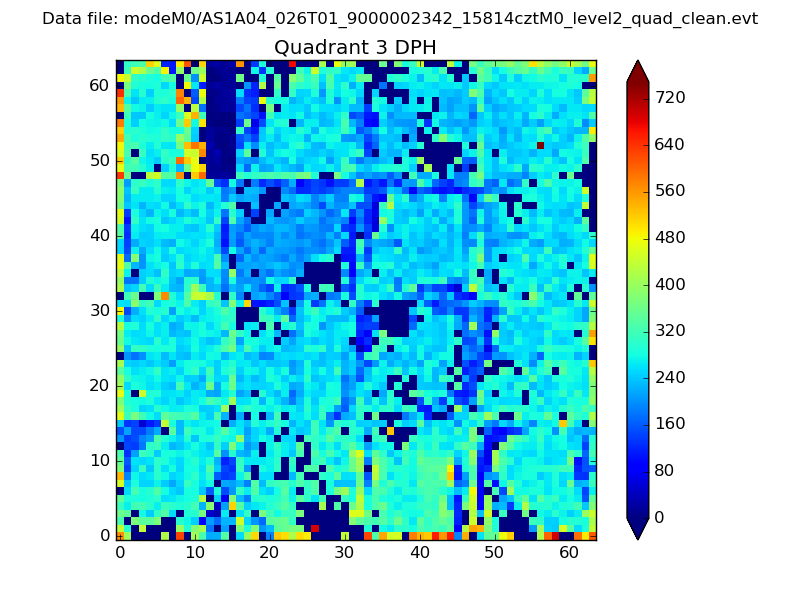 |
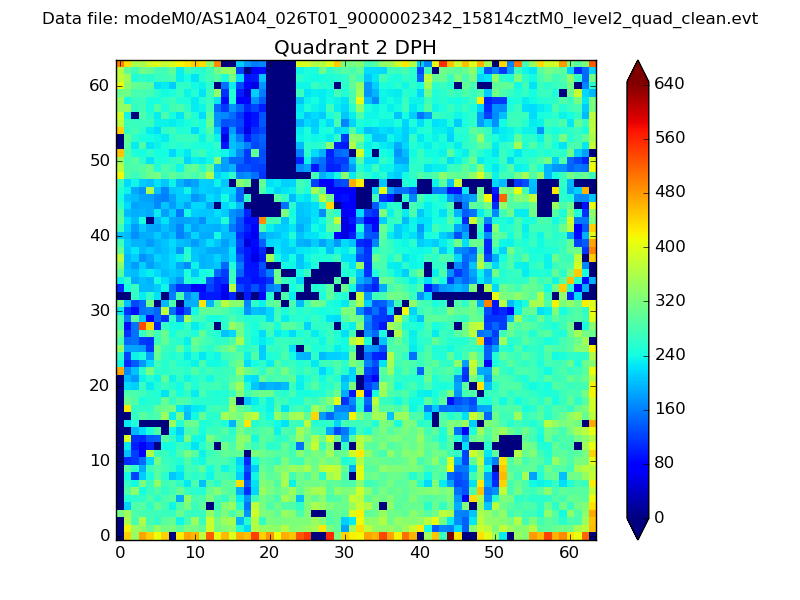 |
Quadrant C |
| Plot type | Count rate plots | Images |
|---|---|---|
| Comparison with Poisson distribution Blue bars denote a histogram of data divided into 1 sec bins. Red curve is a Poisson curve with rate = median count rate of data. |
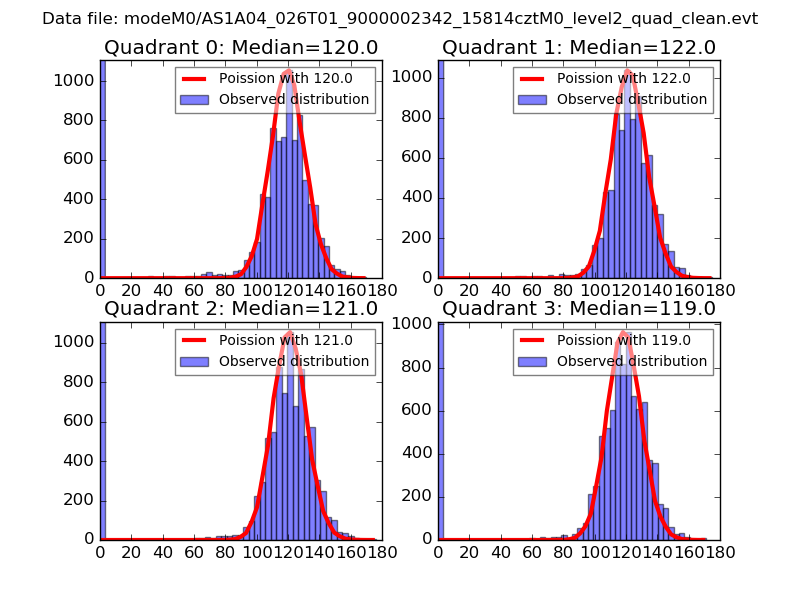 |
 |
| Quadrant-wise count rates Data is divided into 100 sec bins |
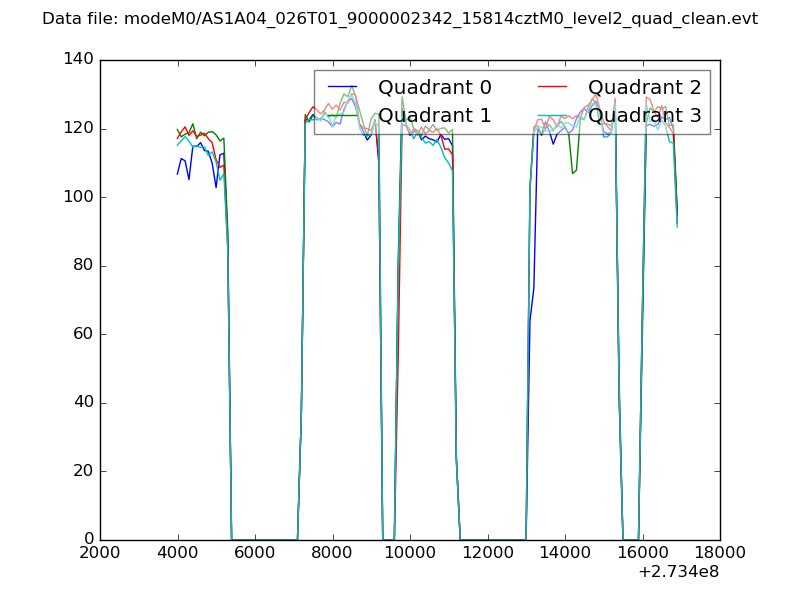 |
|
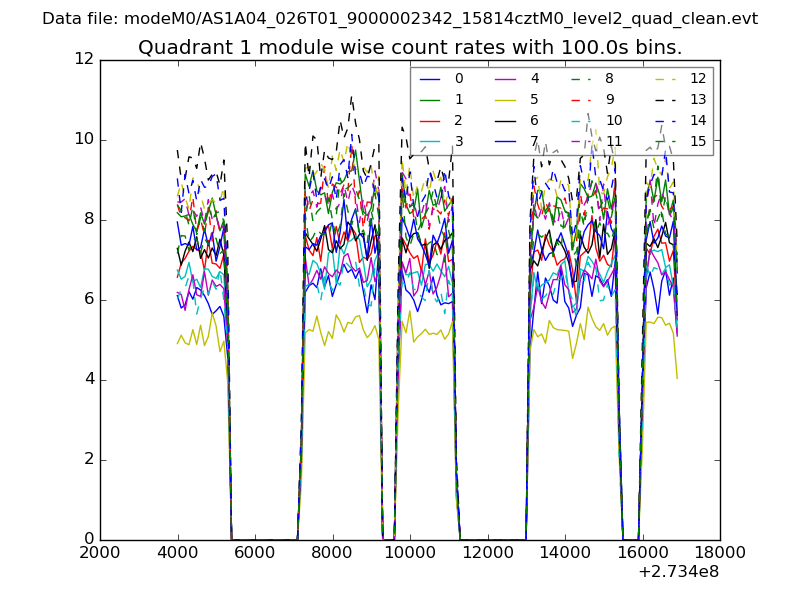
| Module-wise count rates for Quadrant A Data is divided into 100 sec bins |
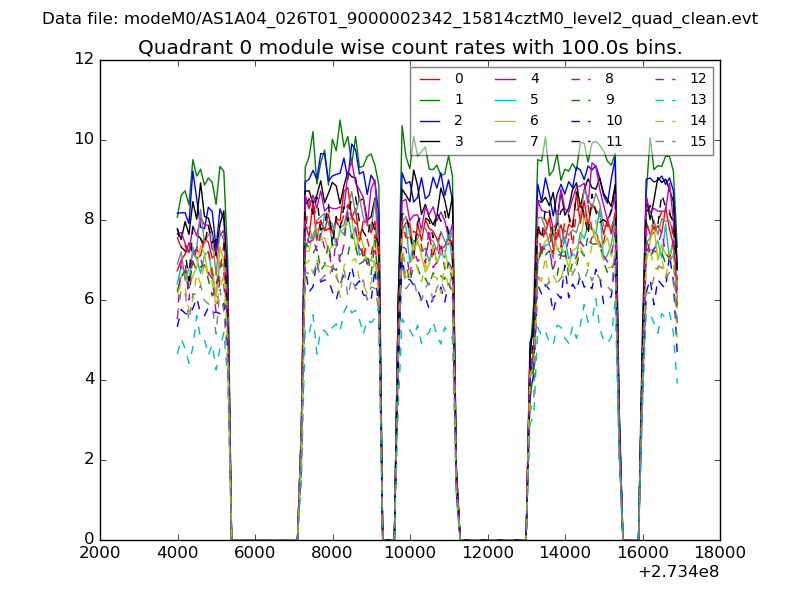 |
 |
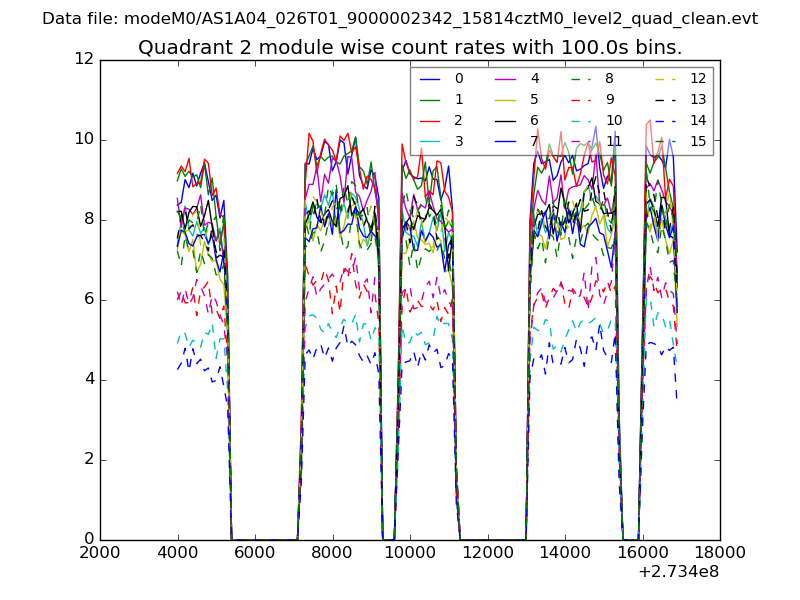
| Module-wise count rates for Quadrant B Data is divided into 100 sec bins |
 |
 |
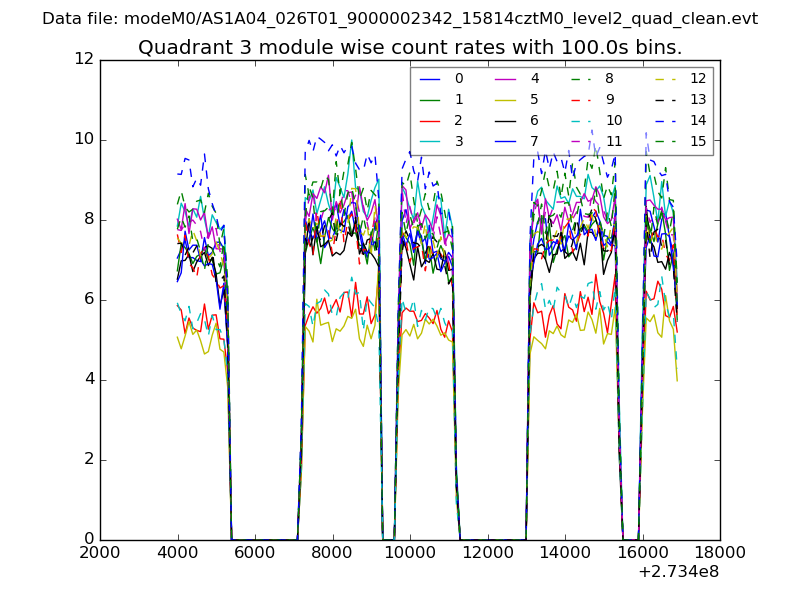
| Module-wise count rates for Quadrant C Data is divided into 100 sec bins |
 |
 |
| Module-wise count rates for Quadrant D Data is divided into 100 sec bins |
 |
 |
| Parameter | Plot |
|---|---|
| CZT HV Monitor | 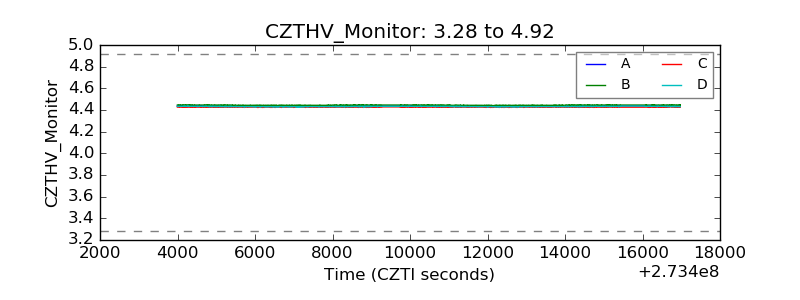 |
| D_VDD | 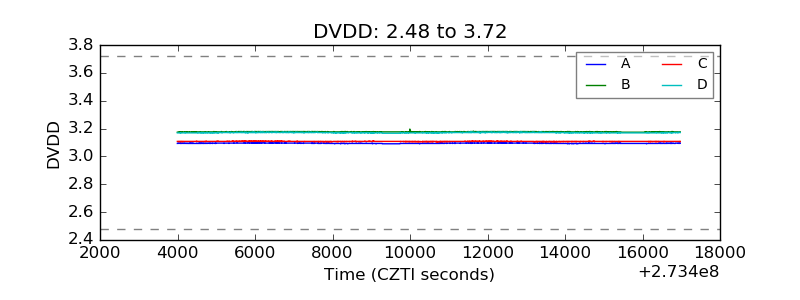 |
| Temperature 1 | 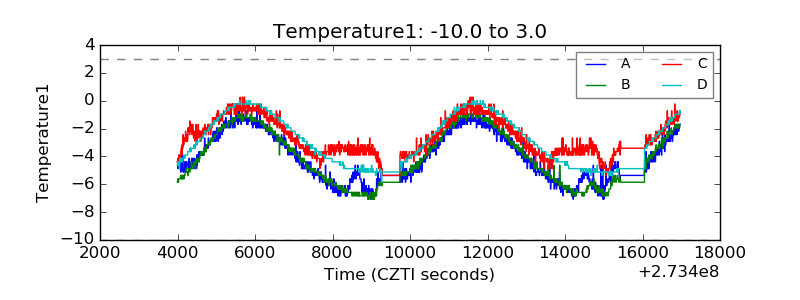 |
| Veto HV Monitor |  |
| Veto LLD | 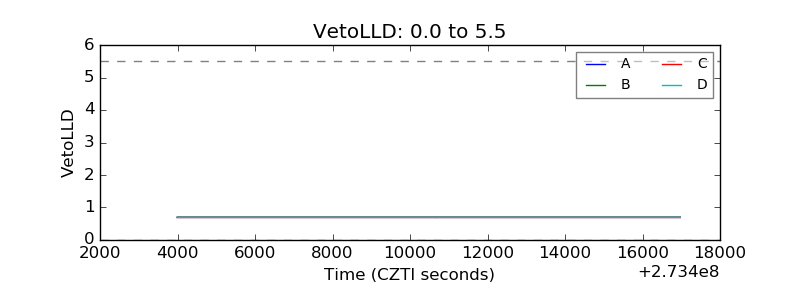 |
| Alpha Counter | 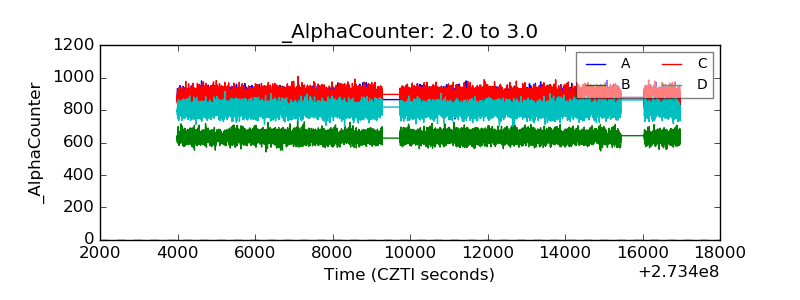 |
| _CPM_Rate | 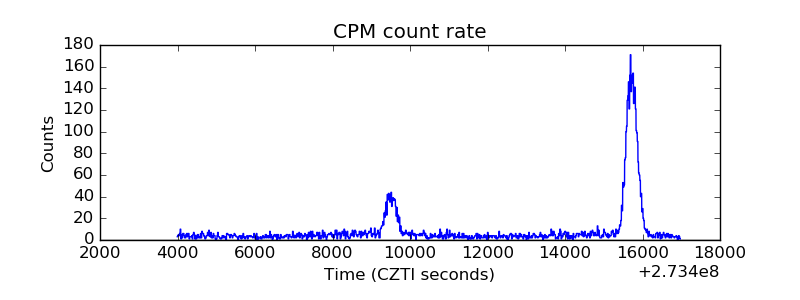 |
| CZT Counter | 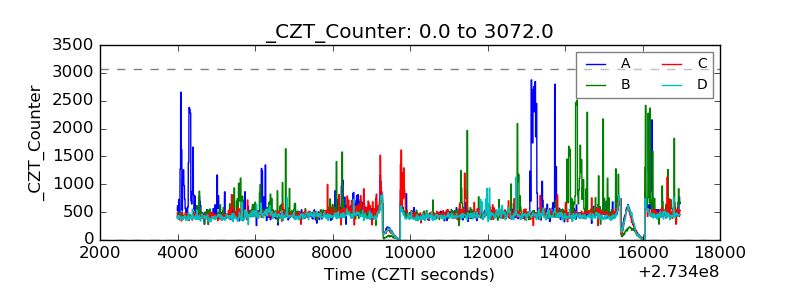 |
| +2.5 Volts monitor |  |
| +5 Volts monitor |  |
| _ROLL_ROT | 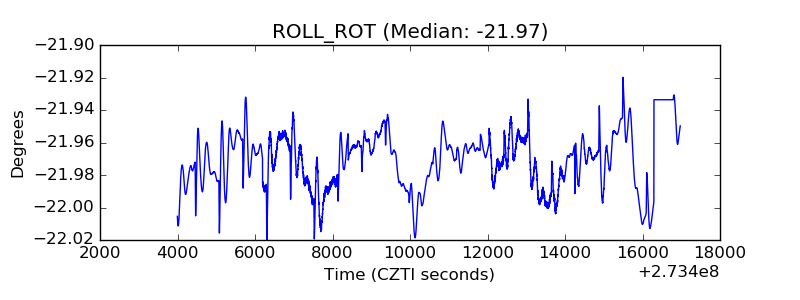 |
| _Roll_DEC | 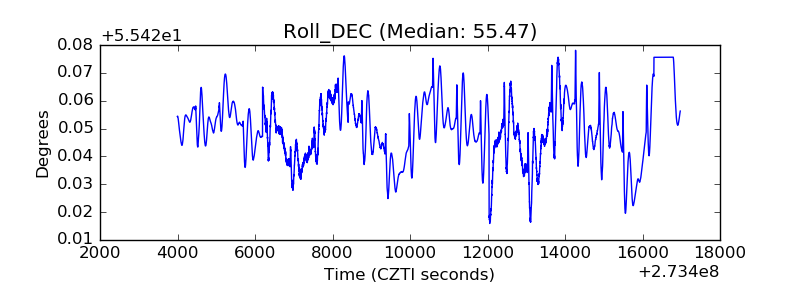 |
| _Roll_RA | 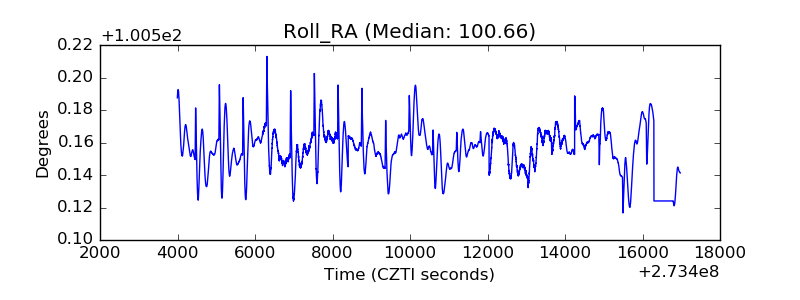 |
| Veto Counter | 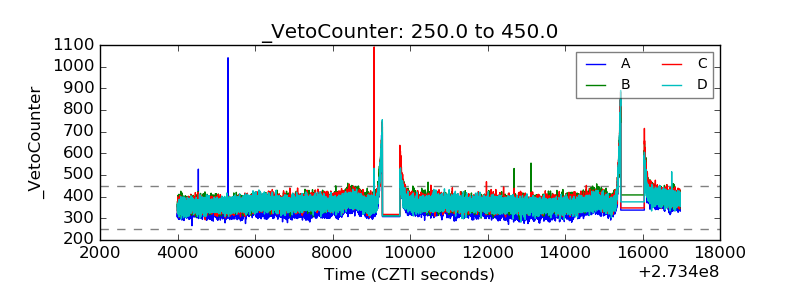 |