| Param | Original file | Final file |
|---|---|---|
| Filename | modeM0/AS1A04_026T01_9000002342_15817cztM0_level2.evt | modeM0/AS1A04_026T01_9000002342_15817cztM0_level2_quad_clean.evt |
| Size (bytes) | 563,446,080 | 68,256,000 |
| Size | 537.3 MB | 65.1 MB |
| Events in quadrant A | 3,171,832 | 402,010 |
| Events in quadrant B | 6,962,728 | 395,165 |
| Events in quadrant C | 3,302,932 | 409,342 |
| Events in quadrant D | 3,186,512 | 406,814 |
| Mode SS | |||
|---|---|---|---|
| Quadrant | BADHDUFLAG | Total packets | Discarded packets |
| A | 0 | 132 | 0 |
| B | 0 | 132 | 0 |
| C | 0 | 132 | 0 |
| D | 0 | 132 | 0 |
| Mode M9 | |||
|---|---|---|---|
| Quadrant | BADHDUFLAG | Total packets | Discarded packets |
| A | 0 | 15 | 0 |
| B | 0 | 15 | 0 |
| C | 0 | 15 | 0 |
| D | 0 | 16 | 0 |
| Mode M0 | |||
|---|---|---|---|
| Quadrant | BADHDUFLAG | Total packets | Discarded packets |
| A | 0 | 13793 | 3 |
| B | 0 | 25353 | 2 |
| C | 0 | 13999 | 2 |
| D | 0 | 13889 | 2 |
| Quadrant | Total seconds | Saturated seconds | Saturation percentage |
|---|---|---|---|
| A | 6498 | 54 | 0.831025% |
| B | 6498 | 406 | 6.248076% |
| C | 6498 | 94 | 1.446599% |
| D | 6498 | 64 | 0.984918% |
Noise dominated data is calculated using 1-second bins in cleaned event files. If a bin has >2000 counts, and if more than 50% of those come from <1% of pixels, then it is considered to be noise-dominated and hence unusable.
| Quadrant | # 1 sec bins | Bins with >0 counts | Bins with >2000 counts | High rate bins dominated by noise | Noise dominated (total time) | Noise dominated (detector-on time) | Marked lightcurve |
|---|---|---|---|---|---|---|---|
| A | 7609 | 6500 | 7 | 7 | 0.09% | 0.11% | 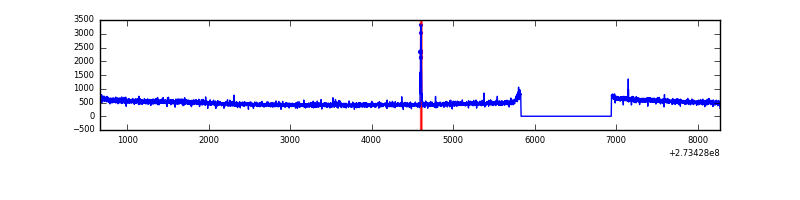 |
| B | 7609 | 6499 | 86 | 86 | 1.13% | 1.32% | 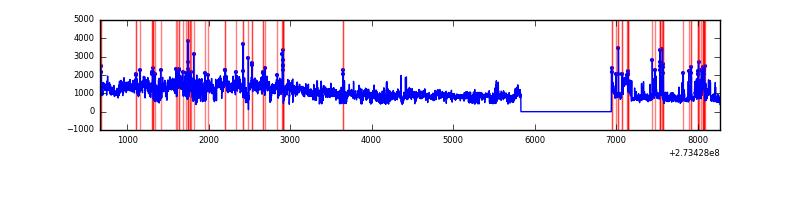 |
| C | 7609 | 6500 | 5 | 5 | 0.07% | 0.08% | 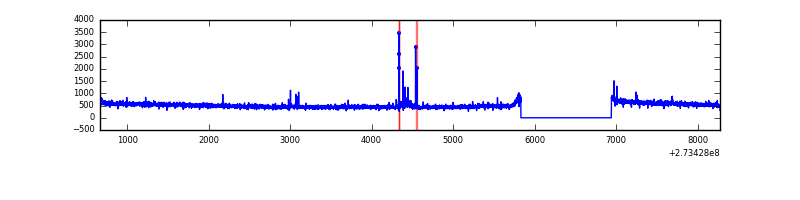 |
| D | 7609 | 6500 | 10 | 10 | 0.13% | 0.15% | 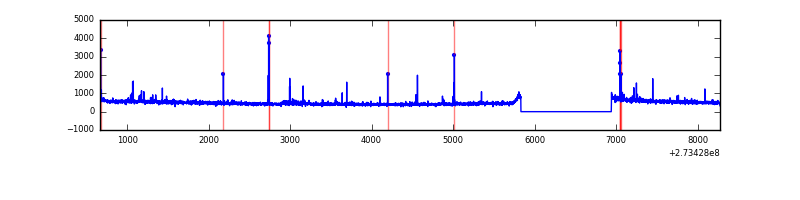 |
Top three noisy pixels from each quadrant. If the there are fewer than three noisy pixels in the level2.evt file, extra rows are filled as -1
| Pixel properties | Quadrant properties | ||||||
|---|---|---|---|---|---|---|---|
| Quadrant | DetID | PixID | Counts | Sigma | Mean | Median | Sigma |
| A | 15 | 174 | 32290 | 193.77 | 809 | 792 | 162.6 |
| A | 15 | 239 | 20565 | 121.64 | 809 | 792 | 162.6 |
| A | 0 | 226 | 7193 | 39.38 | 809 | 792 | 162.6 |
| B | 5 | 65 | 3357285 | 22331.28 | 800 | 780 | 150.3 |
| B | 7 | 220 | 103327 | 682.26 | 800 | 780 | 150.3 |
| B | 3 | 209 | 77251 | 508.77 | 800 | 780 | 150.3 |
| C | 14 | 238 | 120659 | 656.88 | 788 | 794 | 182.5 |
| C | 9 | 54 | 56851 | 307.2 | 788 | 794 | 182.5 |
| C | 3 | 233 | 38656 | 207.49 | 788 | 794 | 182.5 |
| D | 2 | 152 | 75234 | 359.52 | 798 | 776 | 207.1 |
| D | 2 | 234 | 26010 | 121.84 | 798 | 776 | 207.1 |
| D | 13 | 172 | 18628 | 86.2 | 798 | 776 | 207.1 |
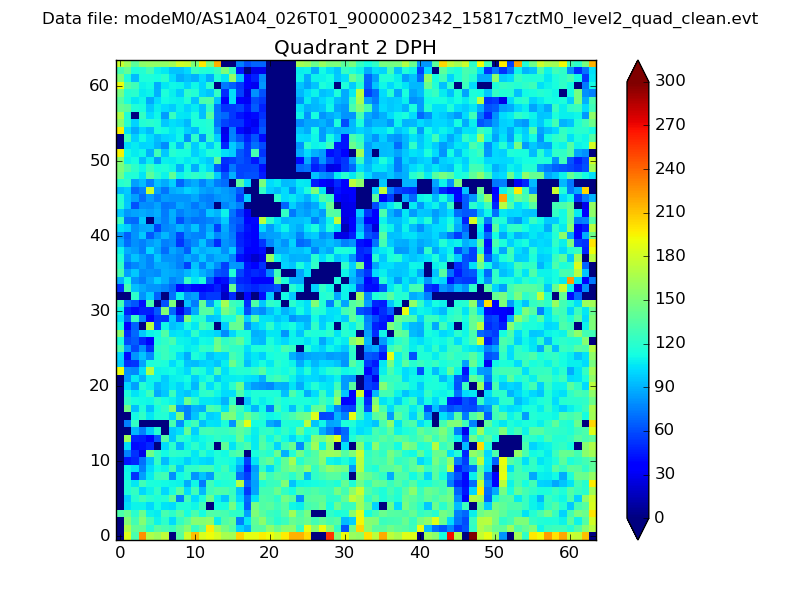
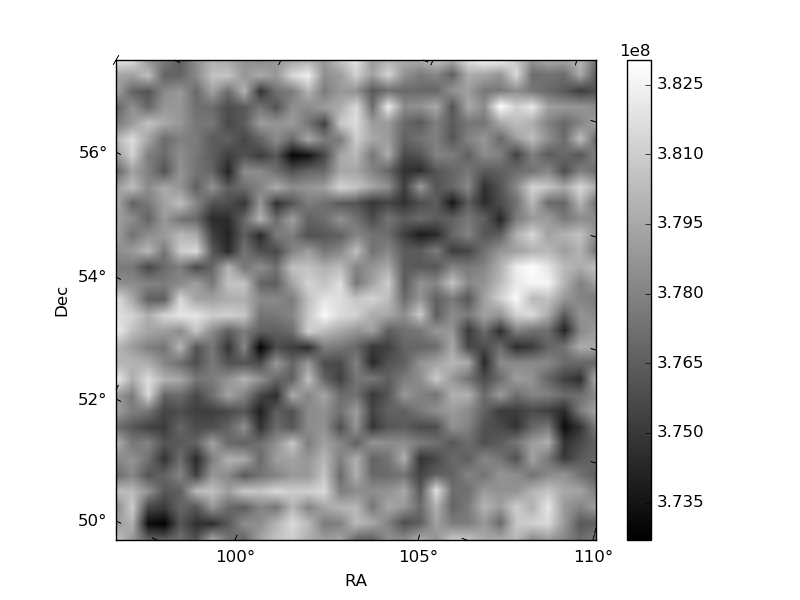
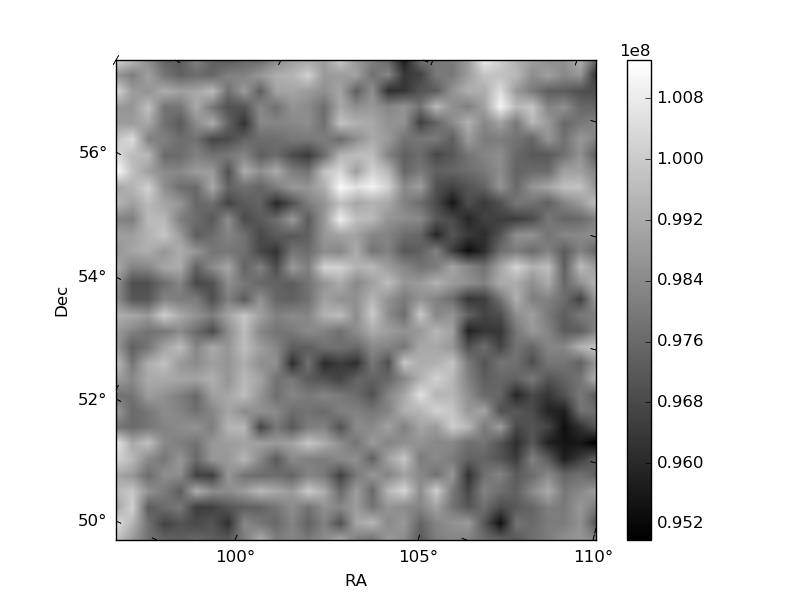
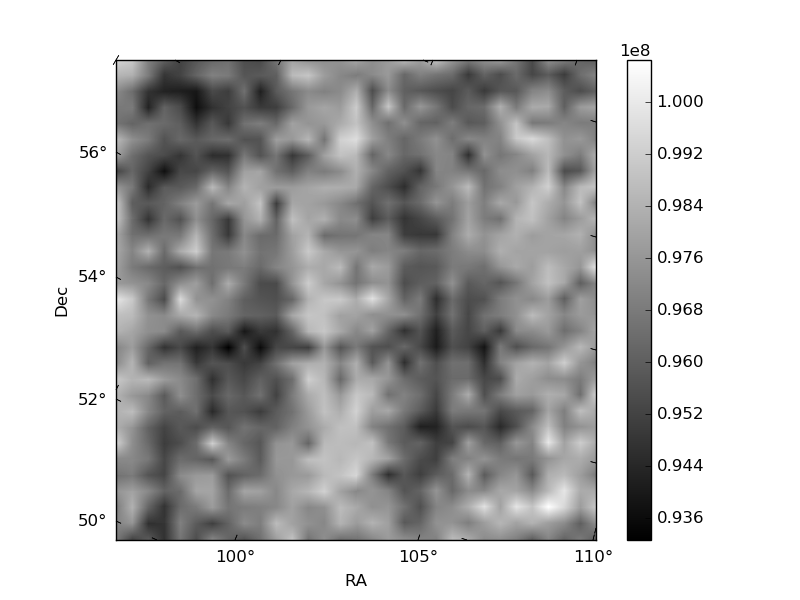
Histogram calculated using DETX and DETY for each event in the final _common_clean file
| Quadrant A | 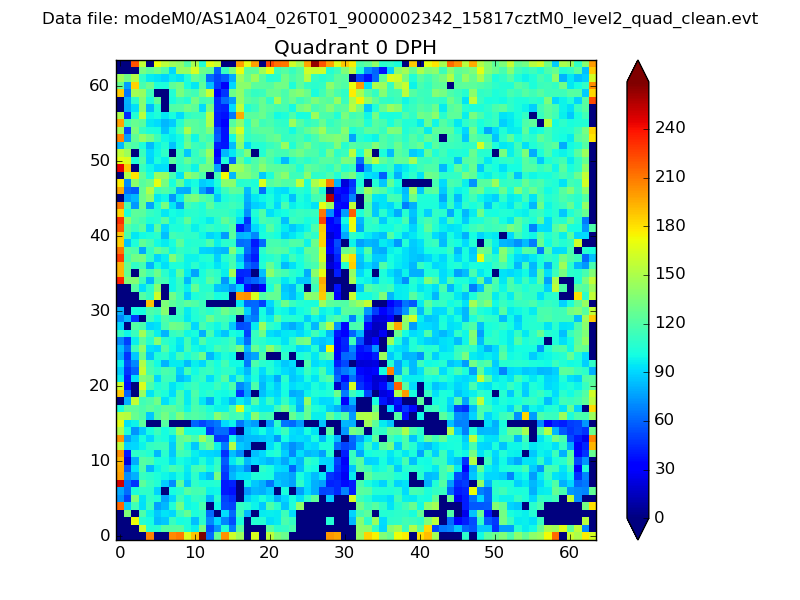 |
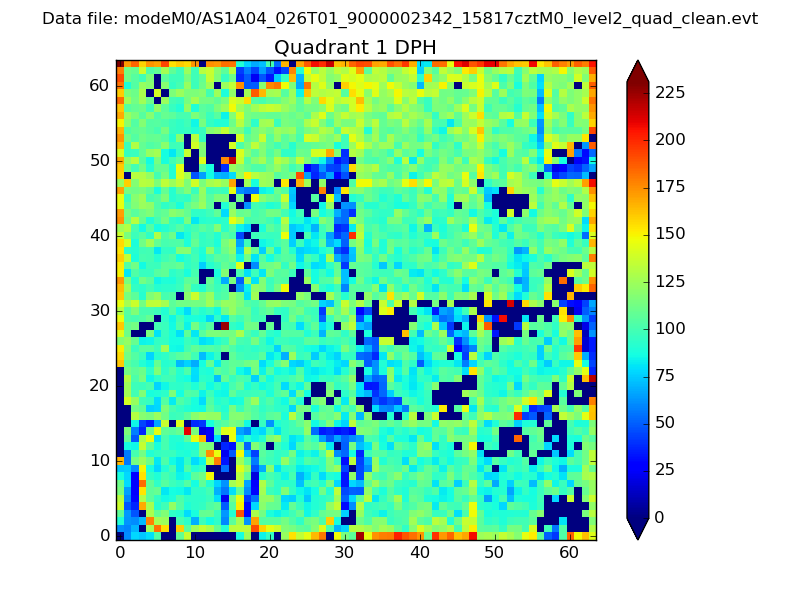 |
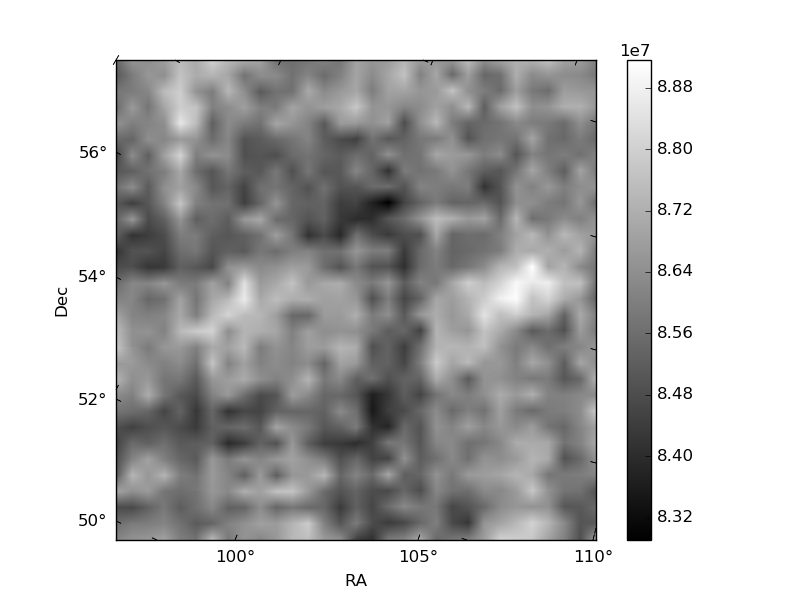
Quadrant B |
|---|---|---|---|
| Quadrant D | 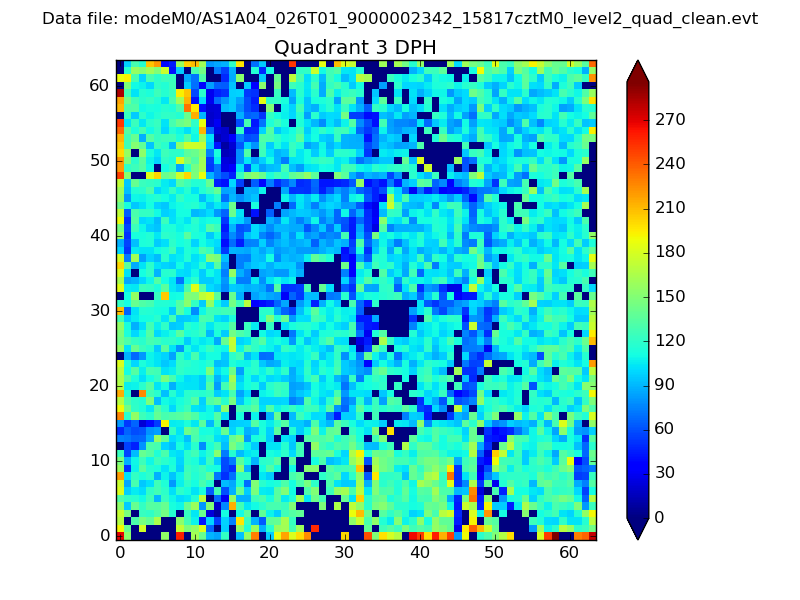 |
 |
Quadrant C |
| Plot type | Count rate plots | Images |
|---|---|---|
| Comparison with Poisson distribution Blue bars denote a histogram of data divided into 1 sec bins. Red curve is a Poisson curve with rate = median count rate of data. |
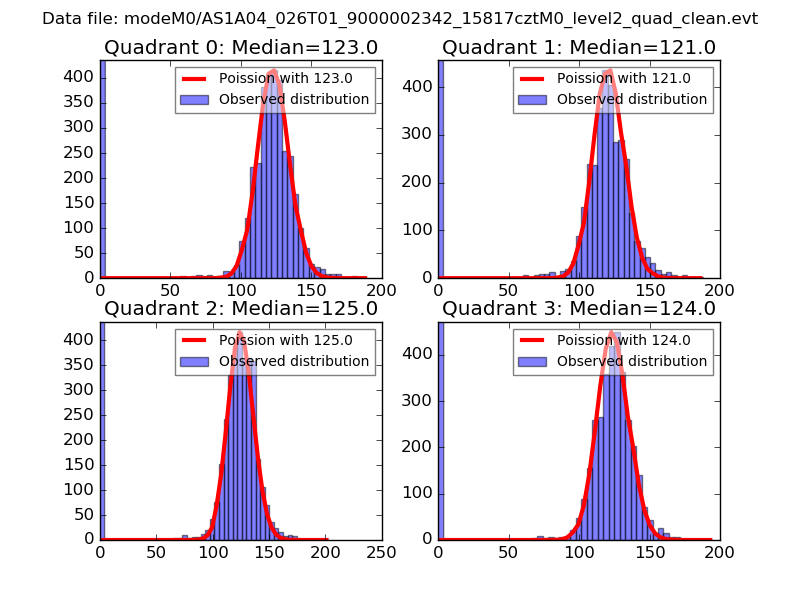 |
 |
| Quadrant-wise count rates Data is divided into 100 sec bins |
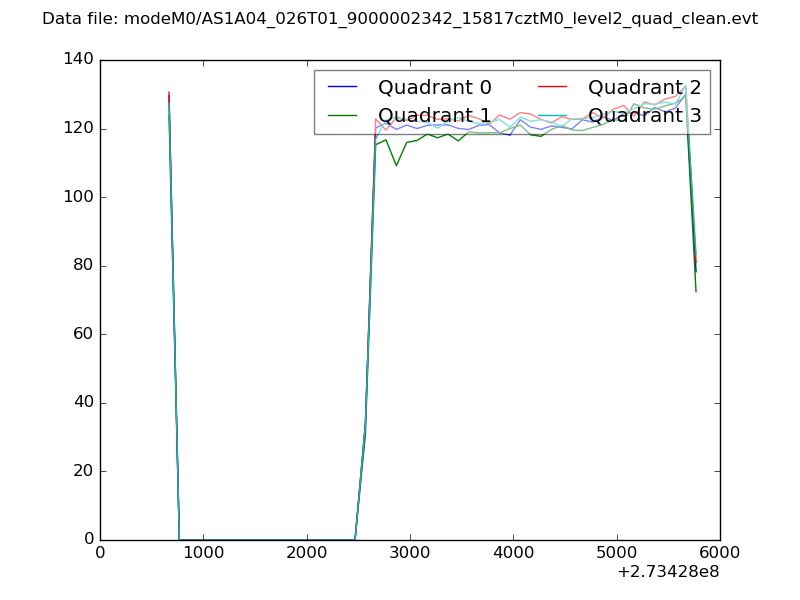 |
|
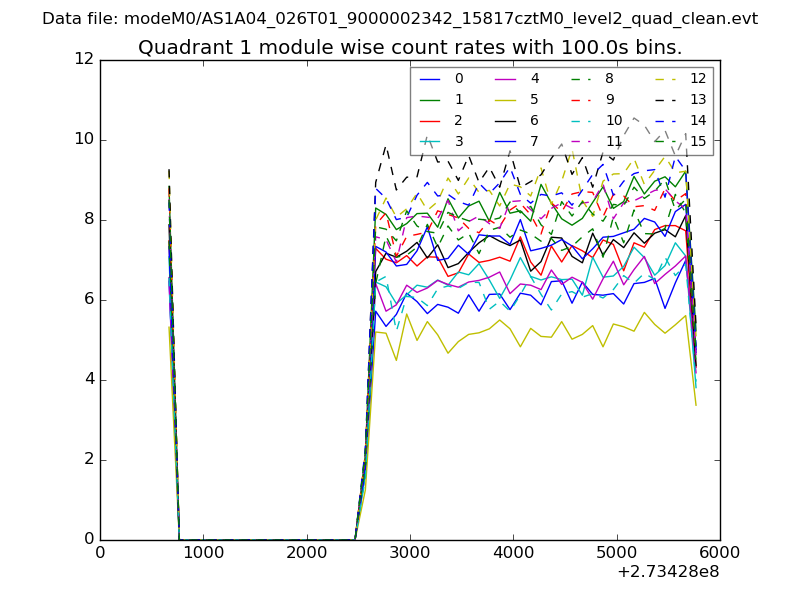
| Module-wise count rates for Quadrant A Data is divided into 100 sec bins |
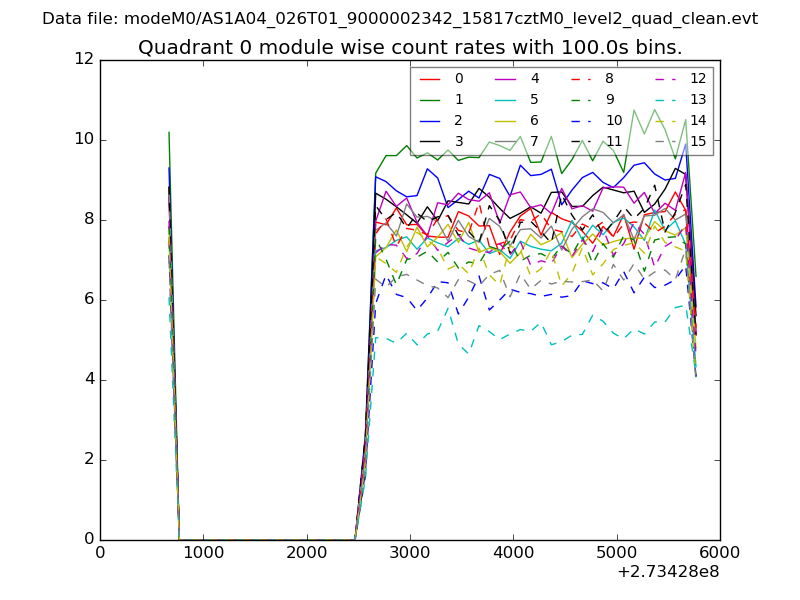 |
 |
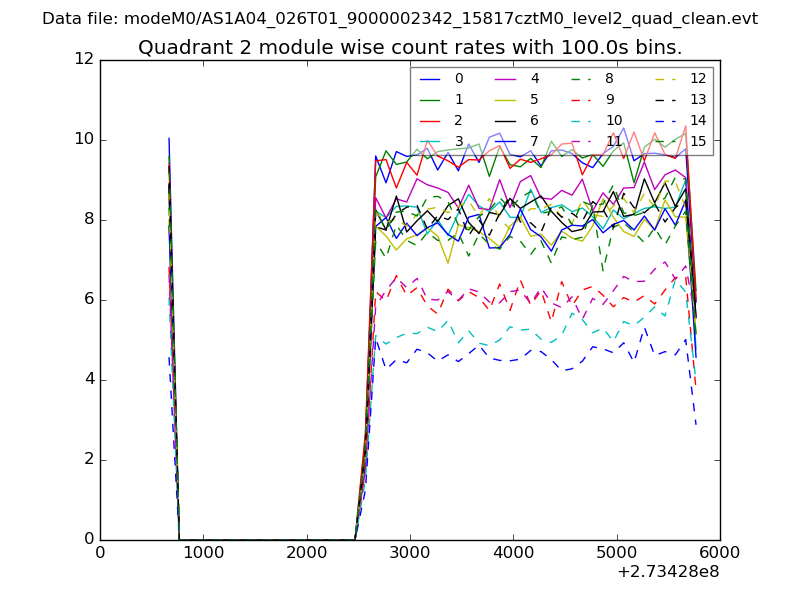
| Module-wise count rates for Quadrant B Data is divided into 100 sec bins |
 |
 |
| Module-wise count rates for Quadrant C Data is divided into 100 sec bins |
 |
 |
| Module-wise count rates for Quadrant D Data is divided into 100 sec bins |
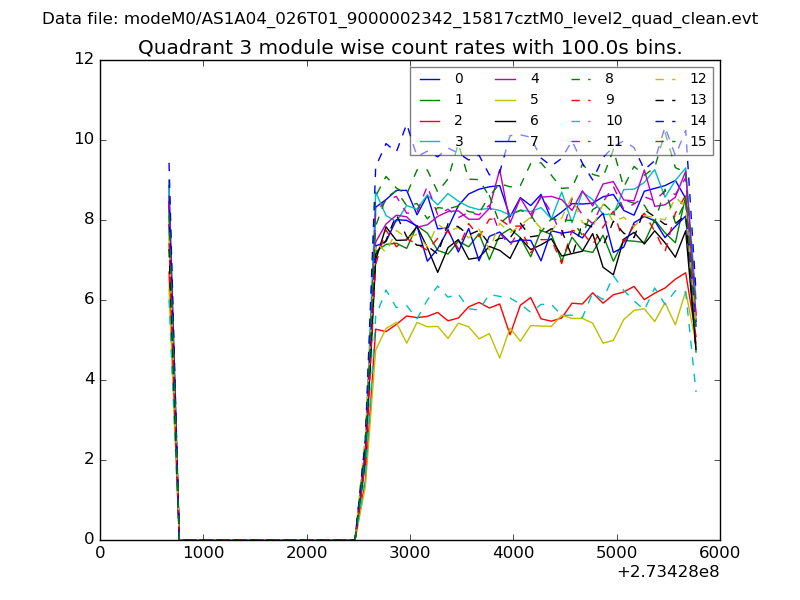 |
 |
| Parameter | Plot |
|---|---|
| CZT HV Monitor | 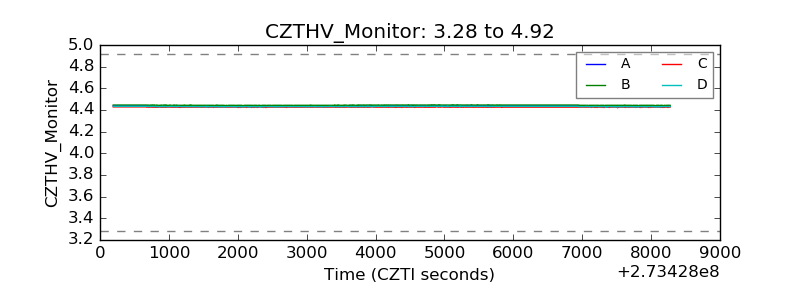 |
| D_VDD |  |
| Temperature 1 | 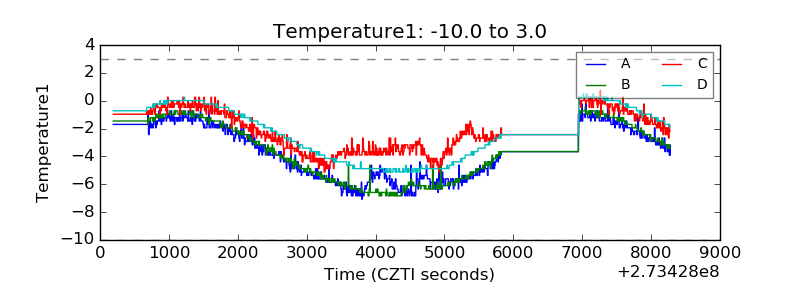 |
| Veto HV Monitor | 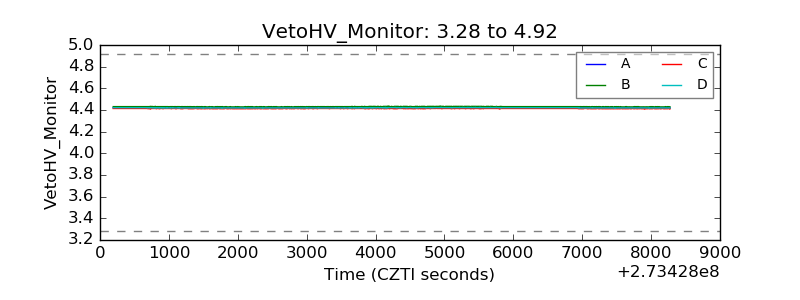 |
| Veto LLD | 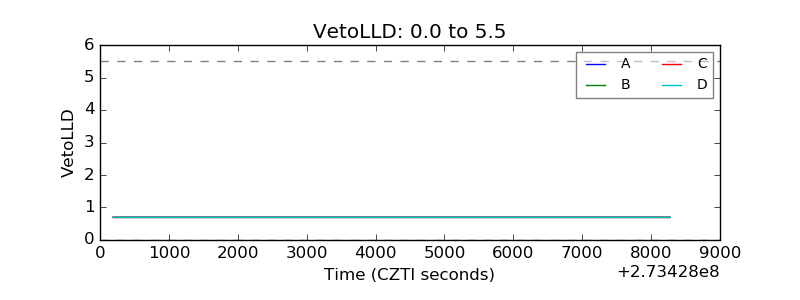 |
| Alpha Counter | 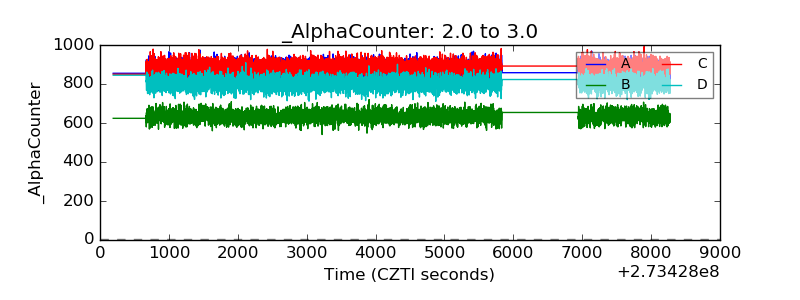 |
| _CPM_Rate | 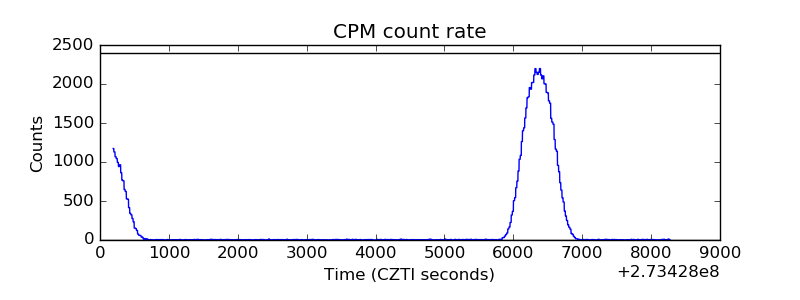 |
| CZT Counter | 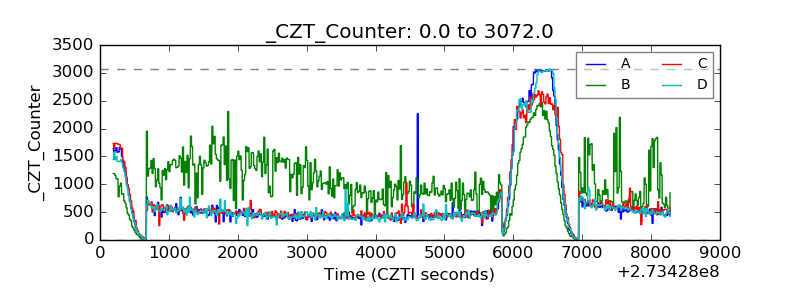 |
| +2.5 Volts monitor | 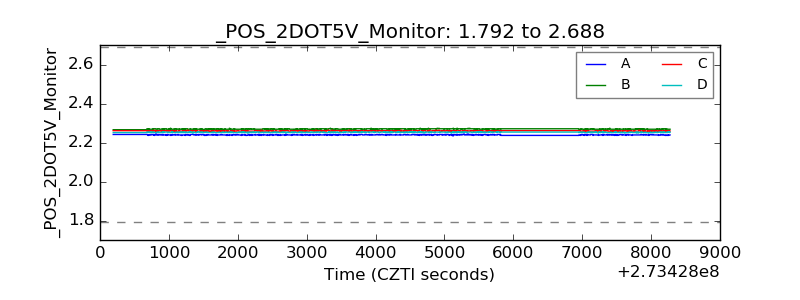 |
| +5 Volts monitor |  |
| _ROLL_ROT | 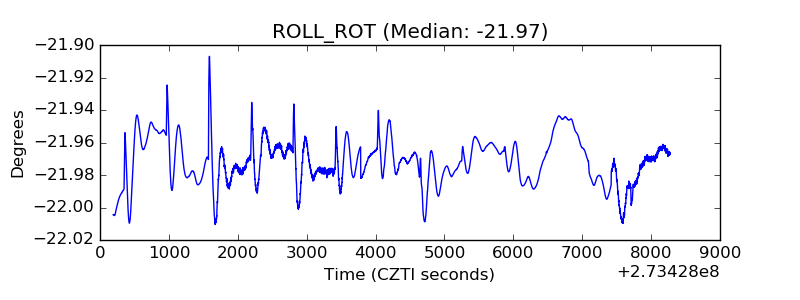 |
| _Roll_DEC | 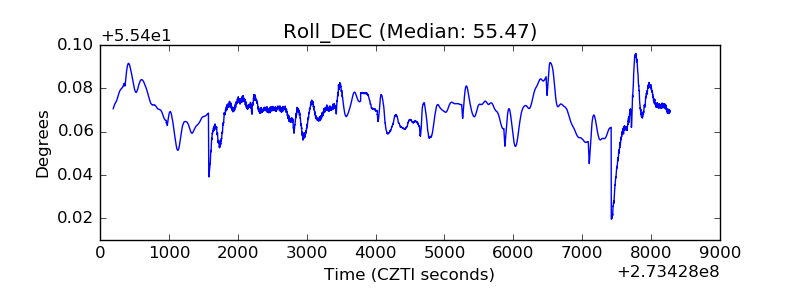 |
| _Roll_RA | 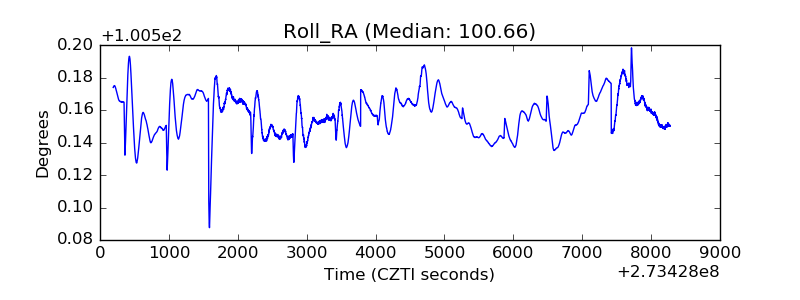 |
| Veto Counter | 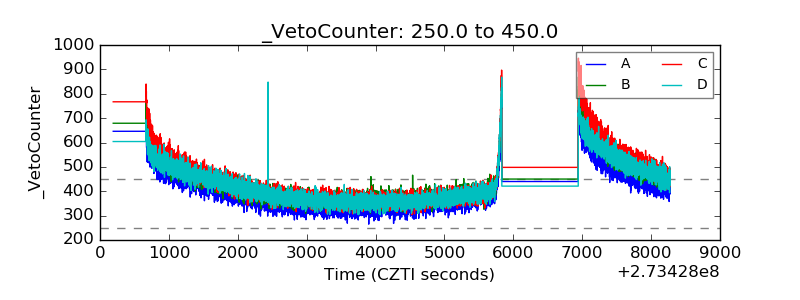 |