| Param | Original file | Final file |
|---|---|---|
| Filename | modeM0/AS1A04_026T01_9000002342_15820cztM0_level2.evt | modeM0/AS1A04_026T01_9000002342_15820cztM0_level2_quad_clean.evt |
| Size (bytes) | 447,788,160 | 92,764,800 |
| Size | 427.0 MB | 88.5 MB |
| Events in quadrant A | 3,120,881 | 584,921 |
| Events in quadrant B | 3,607,269 | 598,522 |
| Events in quadrant C | 3,265,087 | 603,025 |
| Events in quadrant D | 3,147,239 | 590,549 |
| Mode SS | |||
|---|---|---|---|
| Quadrant | BADHDUFLAG | Total packets | Discarded packets |
| A | 0 | 126 | 0 |
| B | 0 | 126 | 0 |
| C | 0 | 126 | 0 |
| D | 0 | 126 | 0 |
| Mode M9 | |||
|---|---|---|---|
| Quadrant | BADHDUFLAG | Total packets | Discarded packets |
| A | 0 | 21 | 0 |
| B | 0 | 21 | 0 |
| C | 0 | 21 | 0 |
| D | 0 | 22 | 0 |
| Mode M0 | |||
|---|---|---|---|
| Quadrant | BADHDUFLAG | Total packets | Discarded packets |
| A | 0 | 13353 | 2 |
| B | 0 | 14842 | 2 |
| C | 0 | 13759 | 2 |
| D | 0 | 13530 | 2 |
| Quadrant | Total seconds | Saturated seconds | Saturation percentage |
|---|---|---|---|
| A | 6192 | 38 | 0.613695% |
| B | 6192 | 129 | 2.083333% |
| C | 6192 | 94 | 1.518088% |
| D | 6192 | 43 | 0.694444% |
Noise dominated data is calculated using 1-second bins in cleaned event files. If a bin has >2000 counts, and if more than 50% of those come from <1% of pixels, then it is considered to be noise-dominated and hence unusable.
| Quadrant | # 1 sec bins | Bins with >0 counts | Bins with >2000 counts | High rate bins dominated by noise | Noise dominated (total time) | Noise dominated (detector-on time) | Marked lightcurve |
|---|---|---|---|---|---|---|---|
| A | 7523 | 6194 | 3 | 3 | 0.04% | 0.05% | 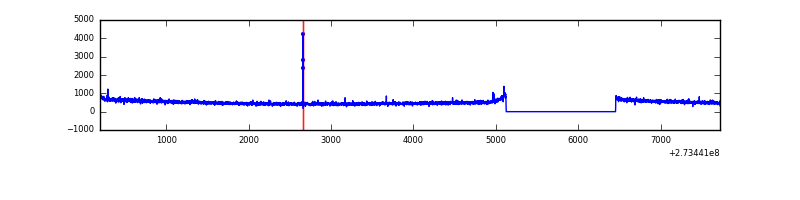 |
| B | 7523 | 6194 | 43 | 43 | 0.57% | 0.69% | 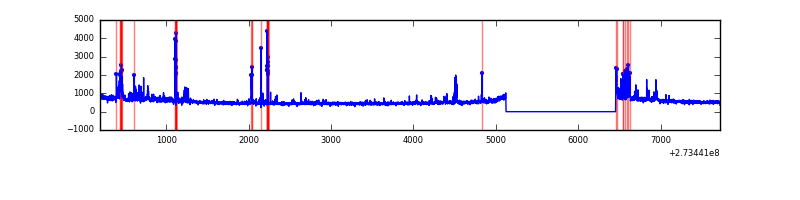 |
| C | 7523 | 6194 | 0 | 0 | 0.00% | 0.00% | 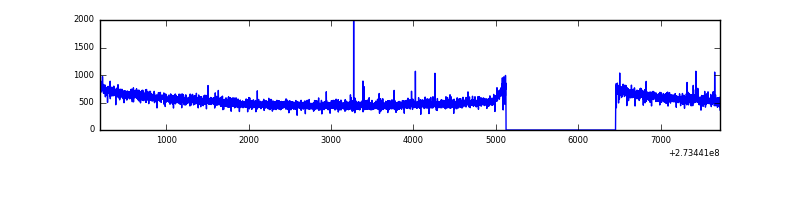 |
| D | 7523 | 6194 | 9 | 9 | 0.12% | 0.15% |  |
Top three noisy pixels from each quadrant. If the there are fewer than three noisy pixels in the level2.evt file, extra rows are filled as -1
| Pixel properties | Quadrant properties | ||||||
|---|---|---|---|---|---|---|---|
| Quadrant | DetID | PixID | Counts | Sigma | Mean | Median | Sigma |
| A | 15 | 174 | 19073 | 113.24 | 802 | 786 | 161.5 |
| A | 15 | 239 | 14195 | 83.03 | 802 | 786 | 161.5 |
| A | 0 | 226 | 7122 | 39.23 | 802 | 786 | 161.5 |
| B | 7 | 220 | 180978 | 1214.72 | 806 | 791 | 148.3 |
| B | 4 | 173 | 101873 | 681.44 | 806 | 791 | 148.3 |
| B | 4 | 142 | 45356 | 300.43 | 806 | 791 | 148.3 |
| C | 14 | 238 | 124936 | 682.46 | 794 | 801 | 181.9 |
| C | 3 | 233 | 20286 | 107.12 | 794 | 801 | 181.9 |
| C | 10 | 22 | 19474 | 102.66 | 794 | 801 | 181.9 |
| D | 2 | 152 | 34300 | 158.8 | 792 | 778 | 211.1 |
| D | 13 | 238 | 32009 | 147.95 | 792 | 778 | 211.1 |
| D | 2 | 234 | 26594 | 122.29 | 792 | 778 | 211.1 |
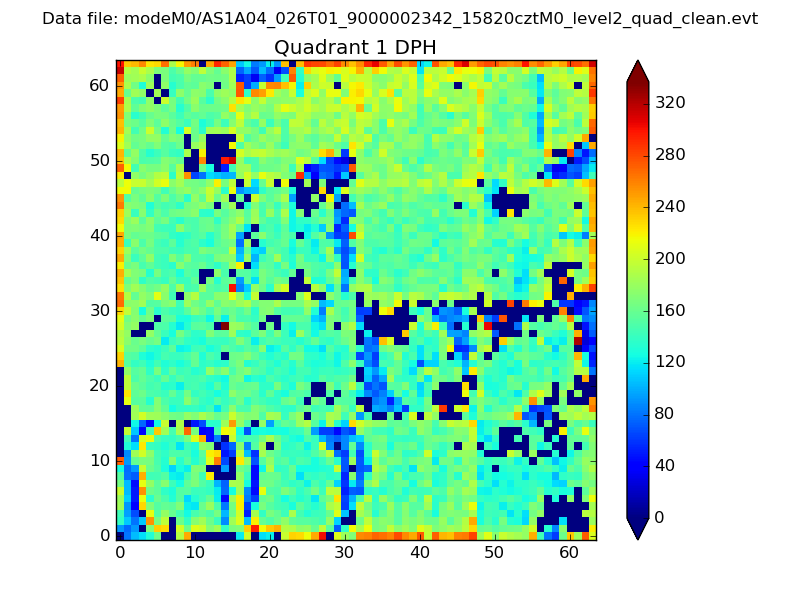
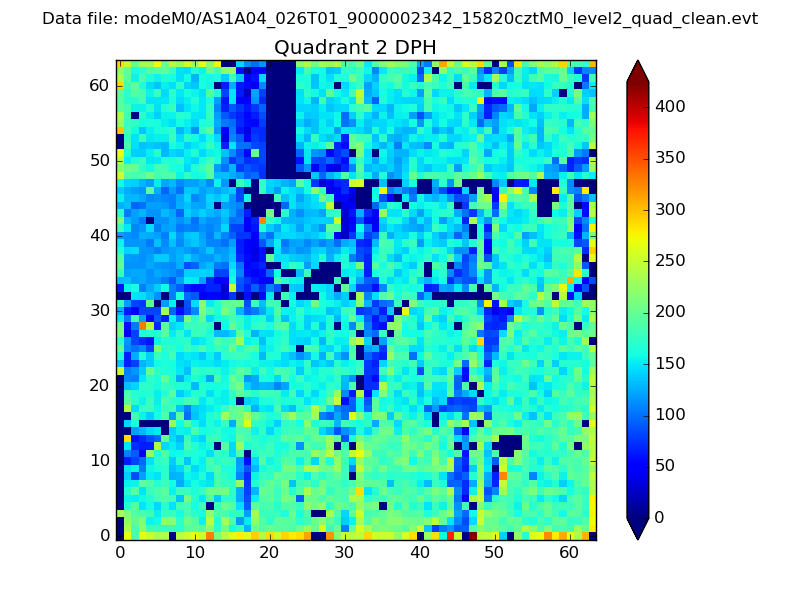
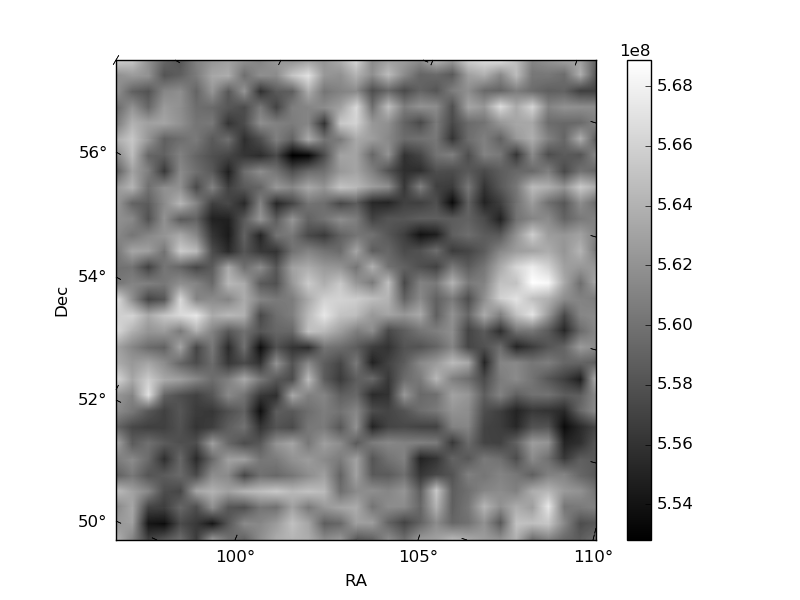
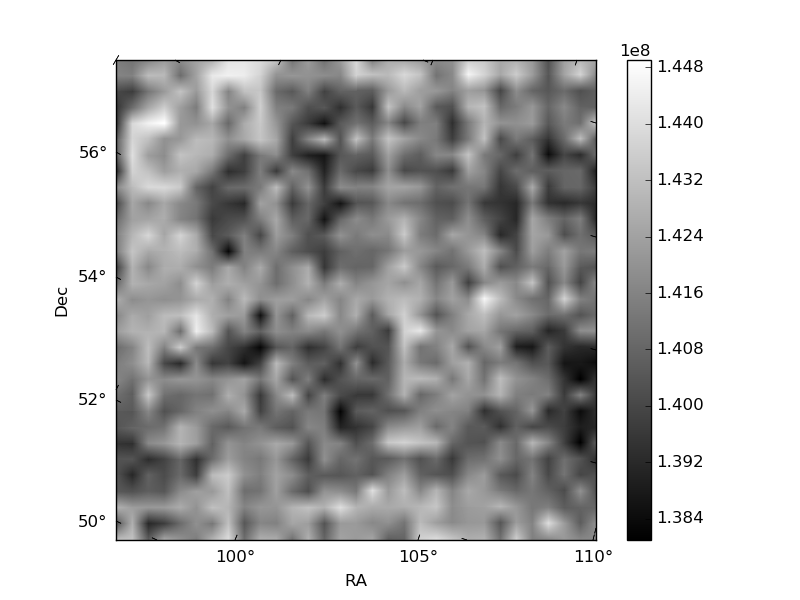
Histogram calculated using DETX and DETY for each event in the final _common_clean file
| Quadrant A | 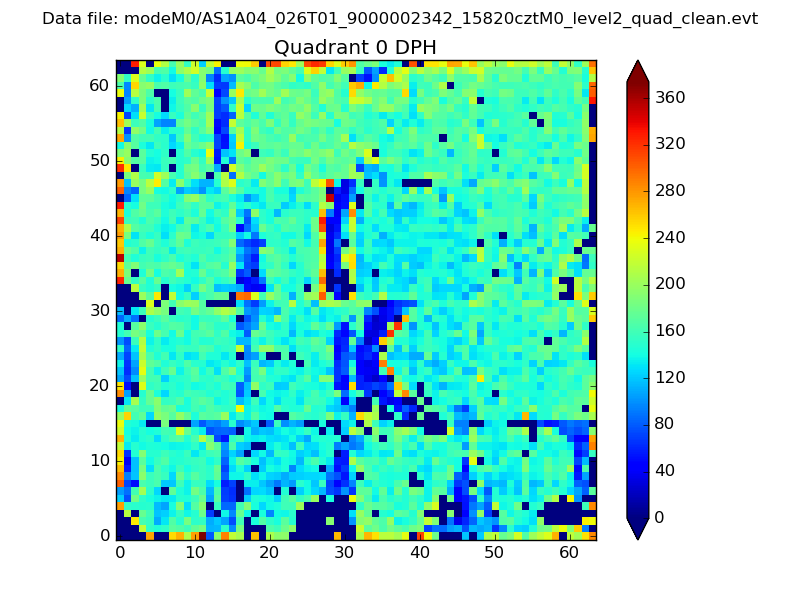 |
 |
Quadrant B |
|---|---|---|---|
| Quadrant D | 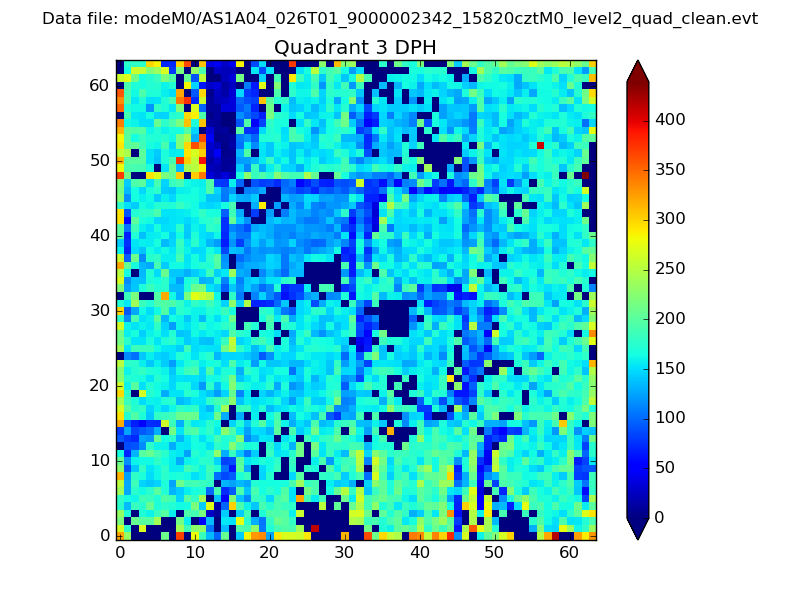 |
 |
Quadrant C |
| Plot type | Count rate plots | Images |
|---|---|---|
| Comparison with Poisson distribution Blue bars denote a histogram of data divided into 1 sec bins. Red curve is a Poisson curve with rate = median count rate of data. |
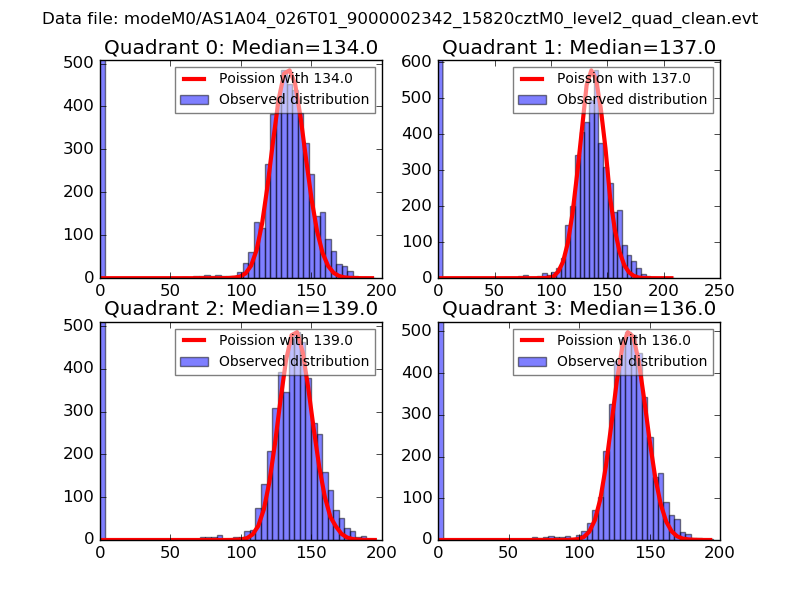 |
 |
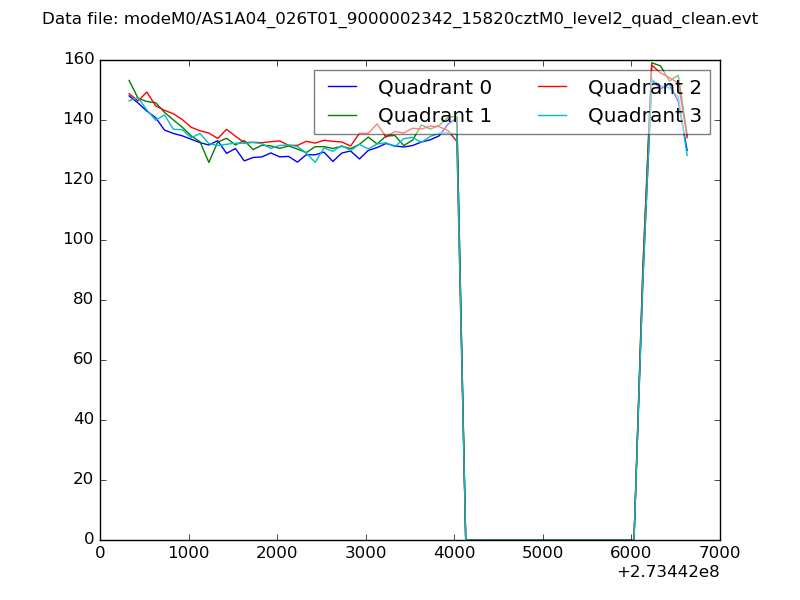
| Quadrant-wise count rates Data is divided into 100 sec bins |
 |
|
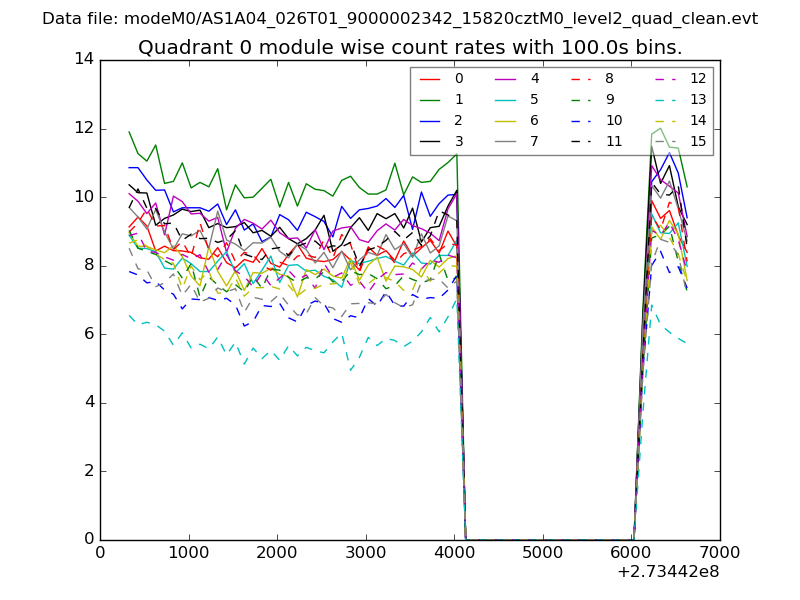
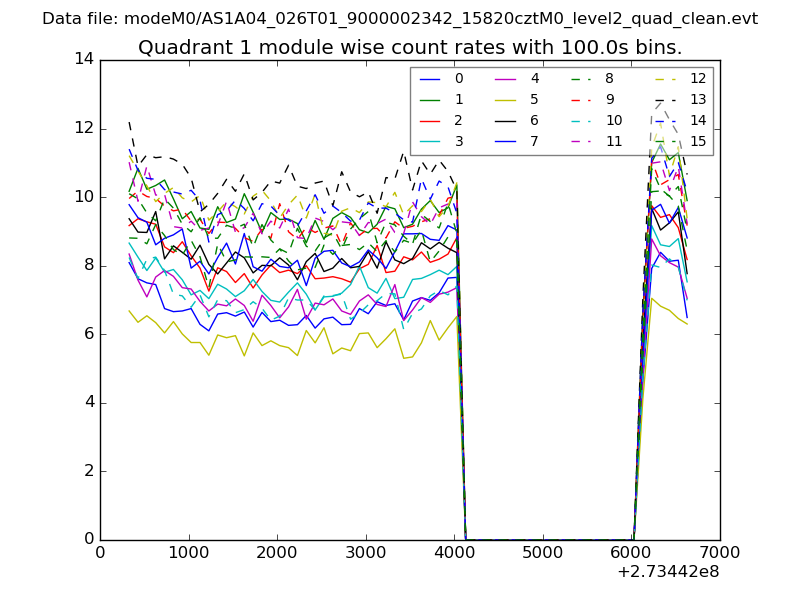
| Module-wise count rates for Quadrant A Data is divided into 100 sec bins |
 |
 |
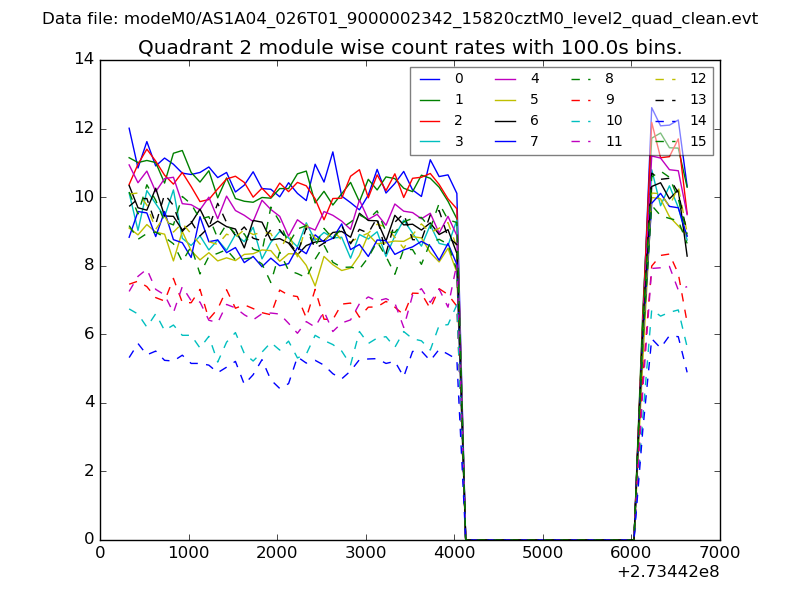
| Module-wise count rates for Quadrant B Data is divided into 100 sec bins |
 |
 |
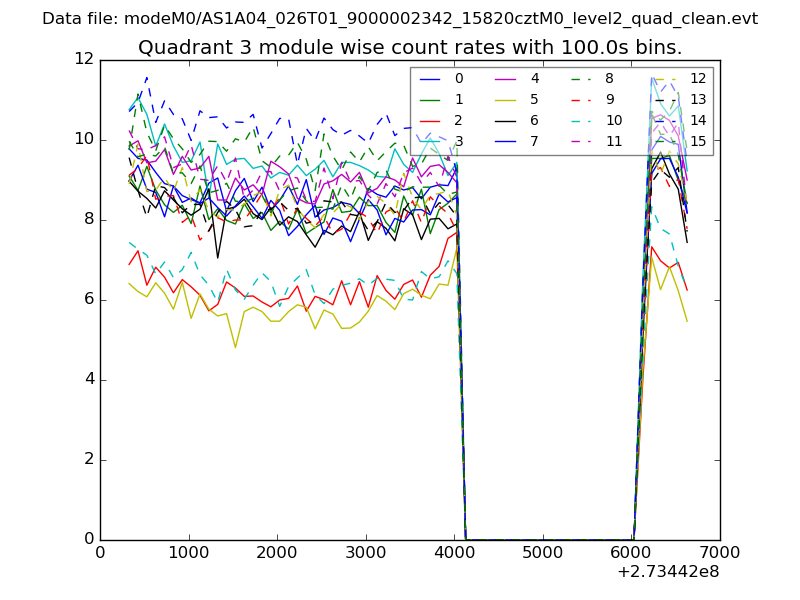
| Module-wise count rates for Quadrant C Data is divided into 100 sec bins |
 |
 |
| Module-wise count rates for Quadrant D Data is divided into 100 sec bins |
 |
 |
| Parameter | Plot |
|---|---|
| CZT HV Monitor | 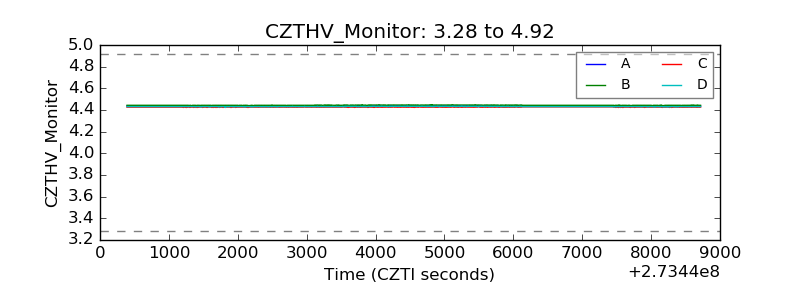 |
| D_VDD | 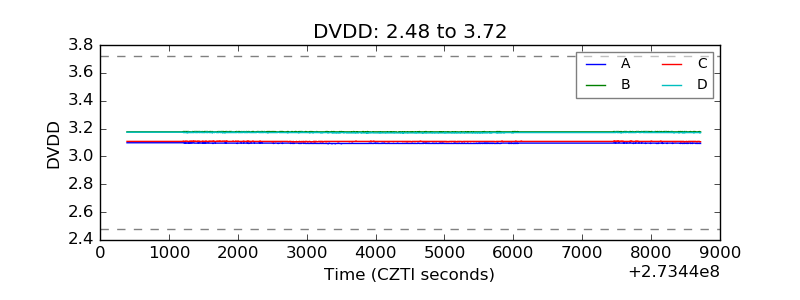 |
| Temperature 1 | 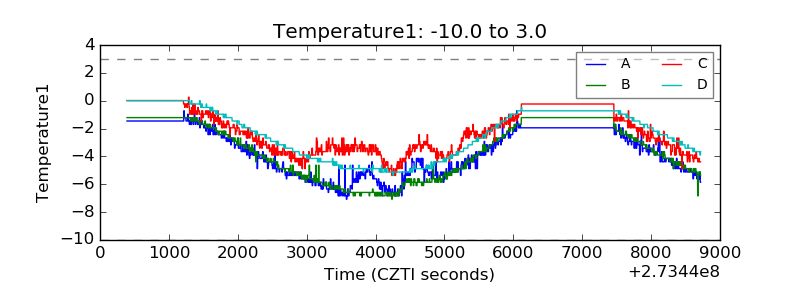 |
| Veto HV Monitor | 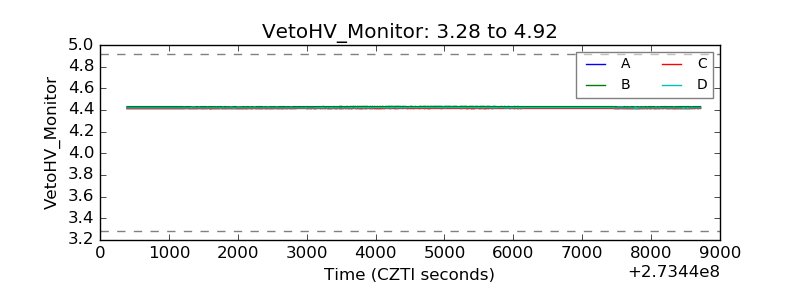 |
| Veto LLD | 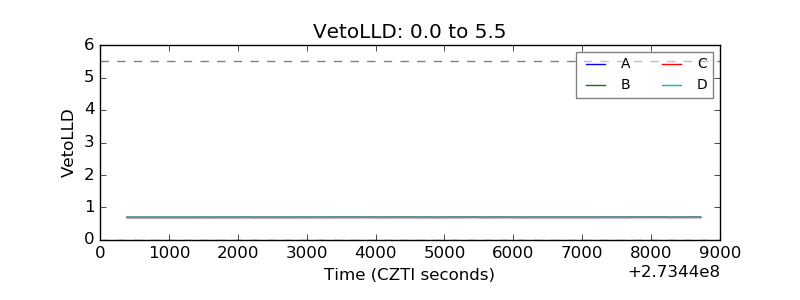 |
| Alpha Counter | 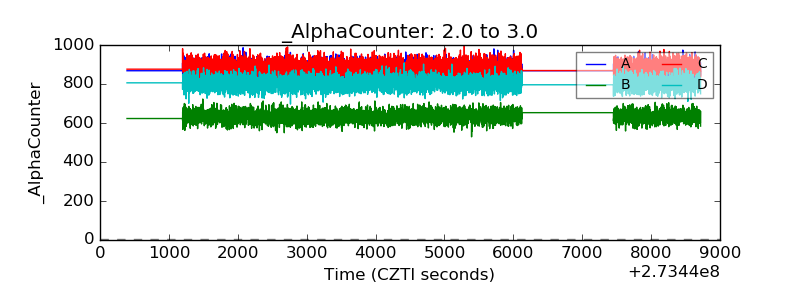 |
| _CPM_Rate | 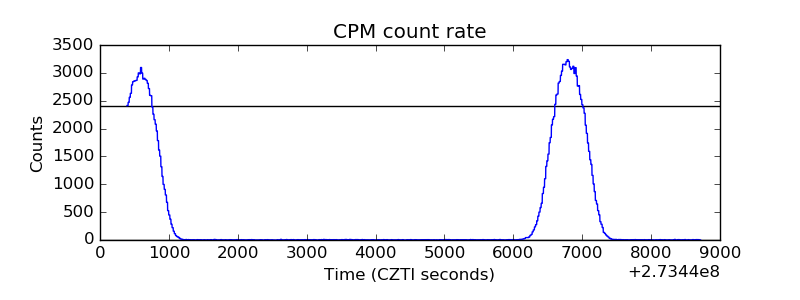 |
| CZT Counter | 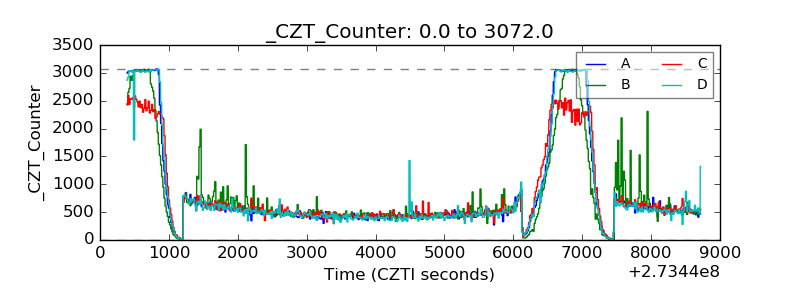 |
| +2.5 Volts monitor | 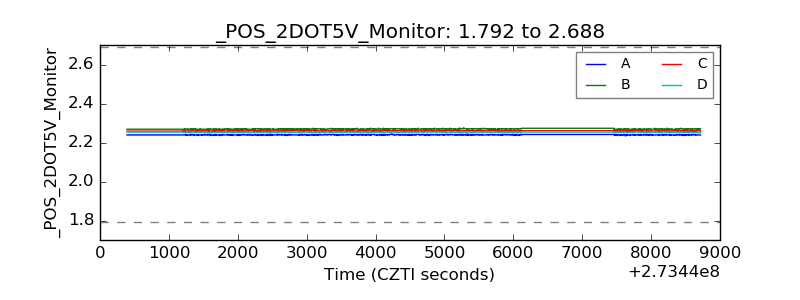 |
| +5 Volts monitor |  |
| _ROLL_ROT | 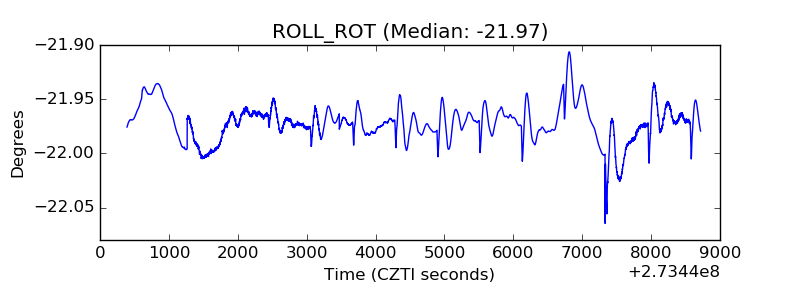 |
| _Roll_DEC | 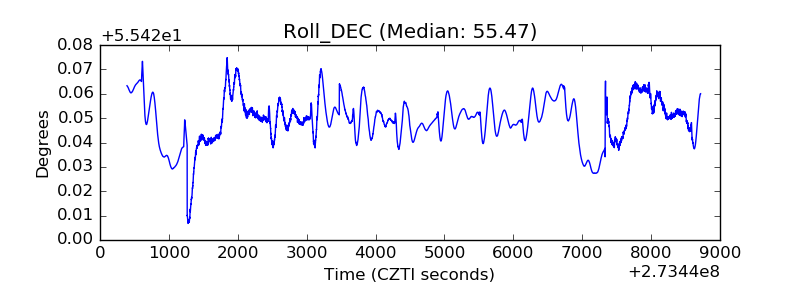 |
| _Roll_RA | 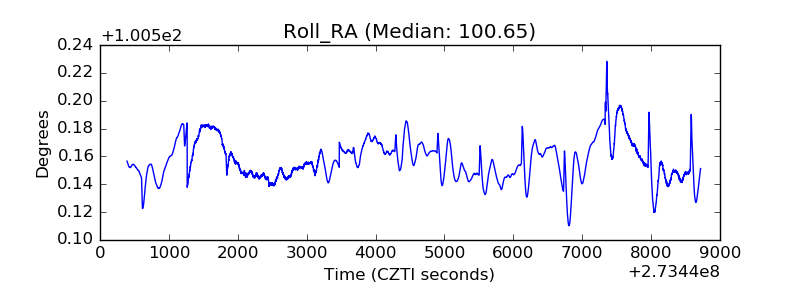 |
| Veto Counter | 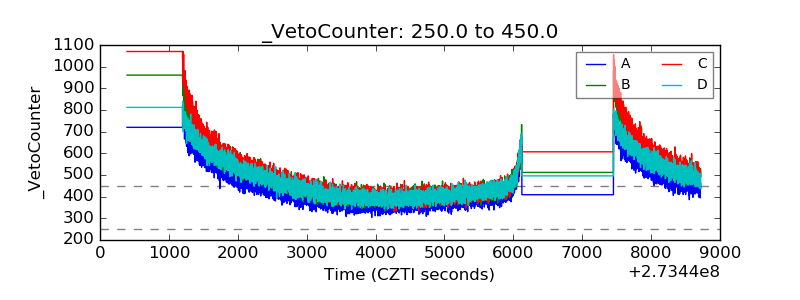 |