| Param | Original file | Final file |
|---|---|---|
| Filename | modeM0/AS1A04_143T01_9000002344_15820cztM0_level2.evt | modeM0/AS1A04_143T01_9000002344_15820cztM0_level2_quad_clean.evt |
| Size (bytes) | 278,447,040 | 57,470,400 |
| Size | 265.5 MB | 54.8 MB |
| Events in quadrant A | 2,022,715 | 366,146 |
| Events in quadrant B | 2,115,566 | 380,026 |
| Events in quadrant C | 2,035,830 | 362,952 |
| Events in quadrant D | 1,991,087 | 354,364 |
| Mode SS | |||
|---|---|---|---|
| Quadrant | BADHDUFLAG | Total packets | Discarded packets |
| A | 0 | 80 | 0 |
| B | 0 | 80 | 0 |
| C | 0 | 80 | 0 |
| D | 0 | 80 | 0 |
| Mode M0 | |||
|---|---|---|---|
| Quadrant | BADHDUFLAG | Total packets | Discarded packets |
| A | 0 | 8400 | 2 |
| B | 0 | 8691 | 1 |
| C | 0 | 8362 | 1 |
| D | 0 | 8376 | 1 |
| Mode M9 | |||
|---|---|---|---|
| Quadrant | BADHDUFLAG | Total packets | Discarded packets |
| A | 0 | 13 | 0 |
| B | 0 | 13 | 0 |
| C | 0 | 13 | 0 |
| D | 0 | 13 | 0 |
| Quadrant | Total seconds | Saturated seconds | Saturation percentage |
|---|---|---|---|
| A | 3919 | 39 | 0.995152% |
| B | 3919 | 57 | 1.454453% |
| C | 3919 | 37 | 0.944118% |
| D | 3919 | 10 | 0.255167% |
Noise dominated data is calculated using 1-second bins in cleaned event files. If a bin has >2000 counts, and if more than 50% of those come from <1% of pixels, then it is considered to be noise-dominated and hence unusable.
| Quadrant | # 1 sec bins | Bins with >0 counts | Bins with >2000 counts | High rate bins dominated by noise | Noise dominated (total time) | Noise dominated (detector-on time) | Marked lightcurve |
|---|---|---|---|---|---|---|---|
| A | 5260 | 3921 | 4 | 4 | 0.08% | 0.10% | 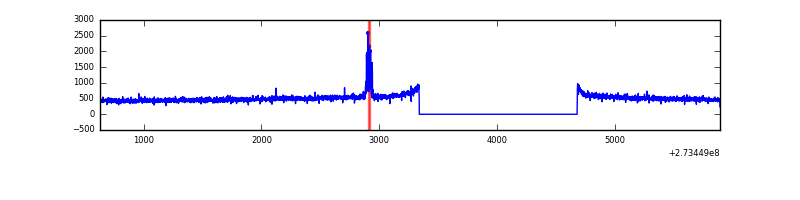 |
| B | 5260 | 3921 | 2 | 2 | 0.04% | 0.05% | 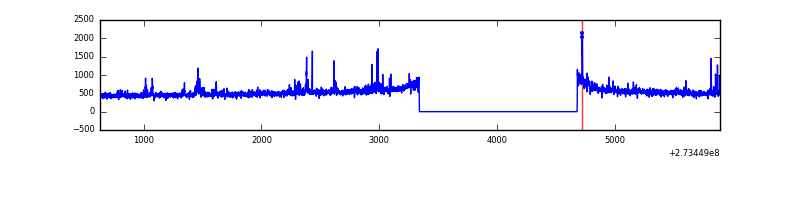 |
| C | 5260 | 3921 | 0 | 0 | 0.00% | 0.00% | 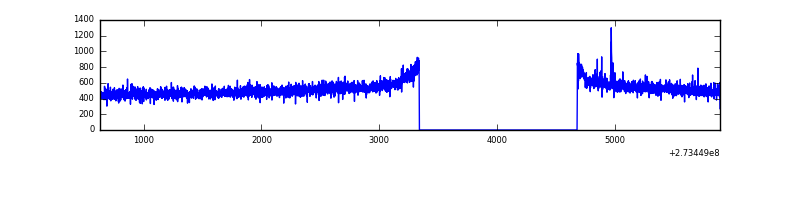 |
| D | 5260 | 3921 | 3 | 3 | 0.06% | 0.08% | 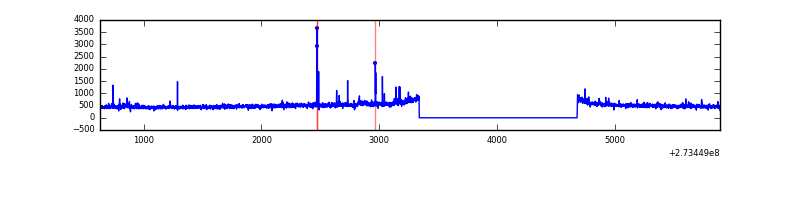 |
Top three noisy pixels from each quadrant. If the there are fewer than three noisy pixels in the level2.evt file, extra rows are filled as -1
| Pixel properties | Quadrant properties | ||||||
|---|---|---|---|---|---|---|---|
| Quadrant | DetID | PixID | Counts | Sigma | Mean | Median | Sigma |
| A | 13 | 248 | 48483 | 456.82 | 512 | 502 | 105.0 |
| A | 15 | 239 | 6601 | 58.07 | 512 | 502 | 105.0 |
| A | 0 | 226 | 4567 | 38.7 | 512 | 502 | 105.0 |
| B | 4 | 173 | 32720 | 323.95 | 515 | 502 | 99.5 |
| B | 0 | 230 | 18435 | 180.32 | 515 | 502 | 99.5 |
| B | 3 | 209 | 11669 | 112.28 | 515 | 502 | 99.5 |
| C | 14 | 238 | 75308 | 643.32 | 497 | 502 | 116.3 |
| C | 9 | 54 | 7279 | 58.28 | 497 | 502 | 116.3 |
| C | 3 | 233 | 5823 | 45.76 | 497 | 502 | 116.3 |
| D | 1 | 52 | 27907 | 203.76 | 499 | 489 | 134.6 |
| D | 2 | 152 | 18529 | 134.06 | 499 | 489 | 134.6 |
| D | 2 | 234 | 16200 | 116.76 | 499 | 489 | 134.6 |
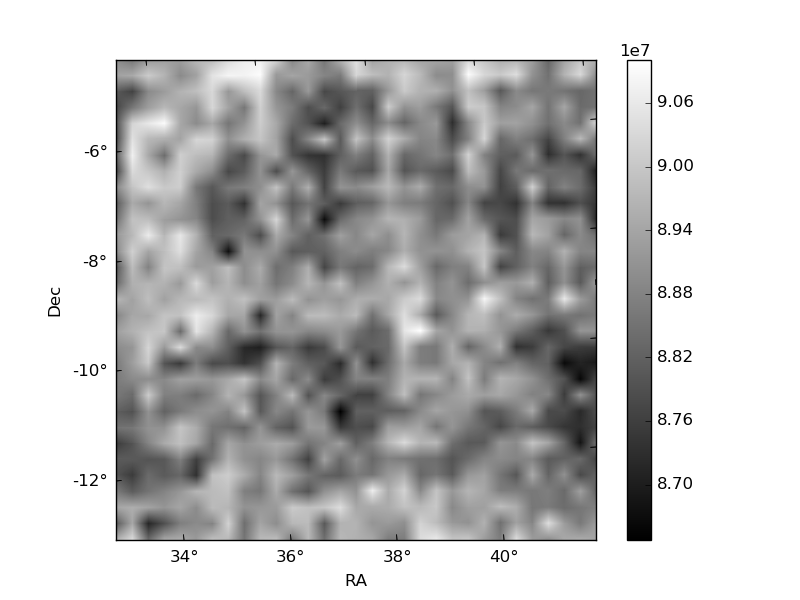
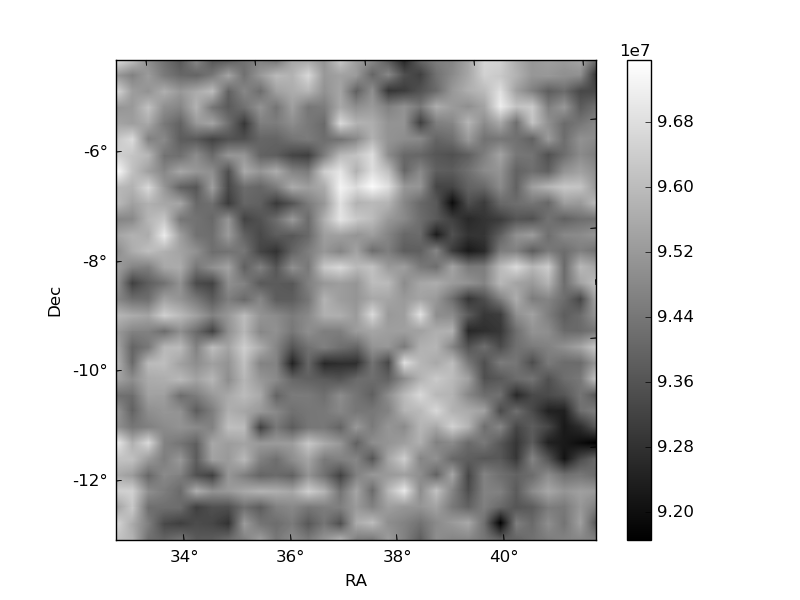
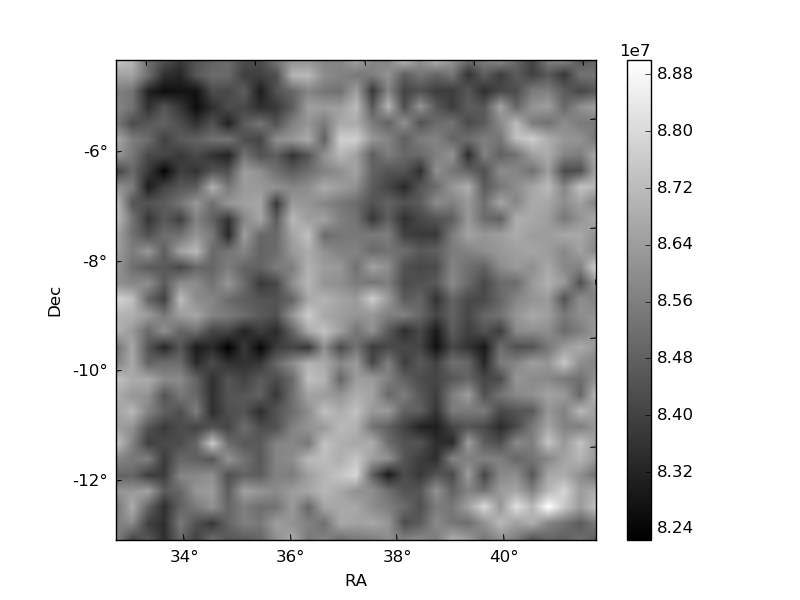
Histogram calculated using DETX and DETY for each event in the final _common_clean file
| Quadrant A | 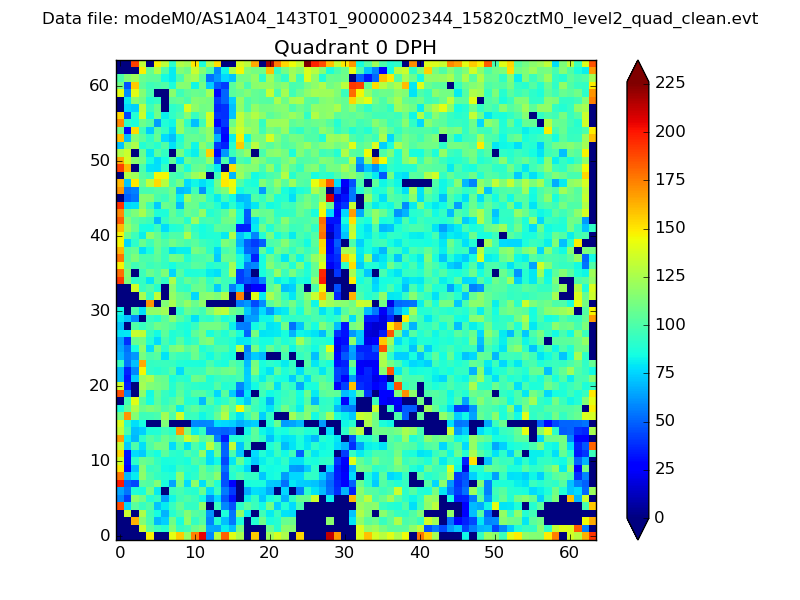 |
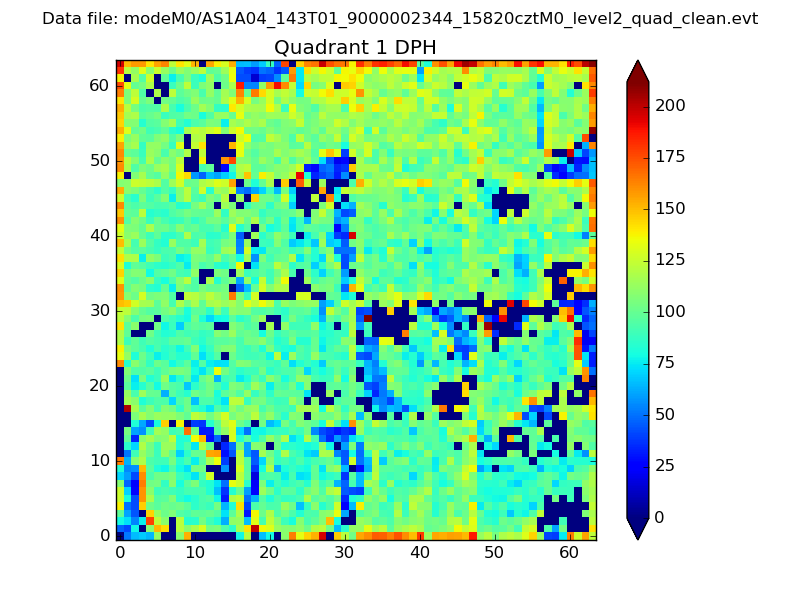 |
Quadrant B |
|---|---|---|---|
| Quadrant D | 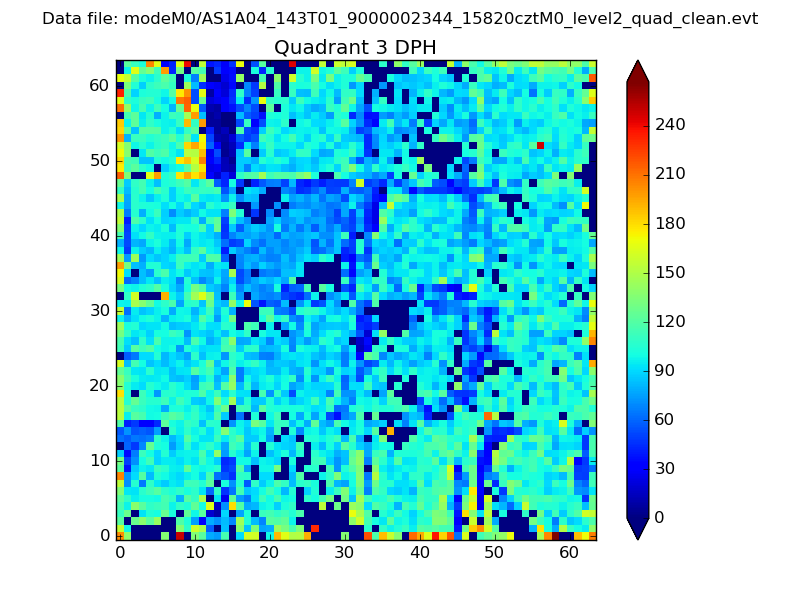 |
 |
Quadrant C |
| Plot type | Count rate plots | Images |
|---|---|---|
| Comparison with Poisson distribution Blue bars denote a histogram of data divided into 1 sec bins. Red curve is a Poisson curve with rate = median count rate of data. |
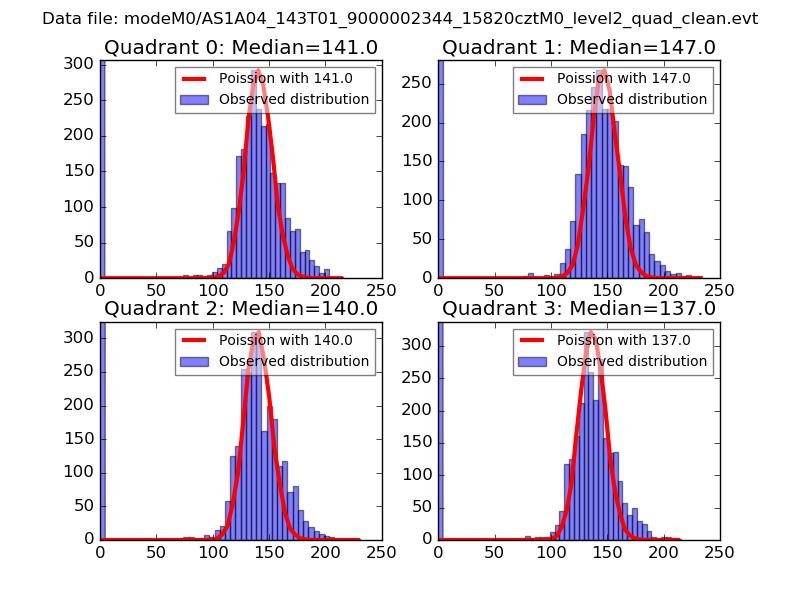 |
 |
| Quadrant-wise count rates Data is divided into 100 sec bins |
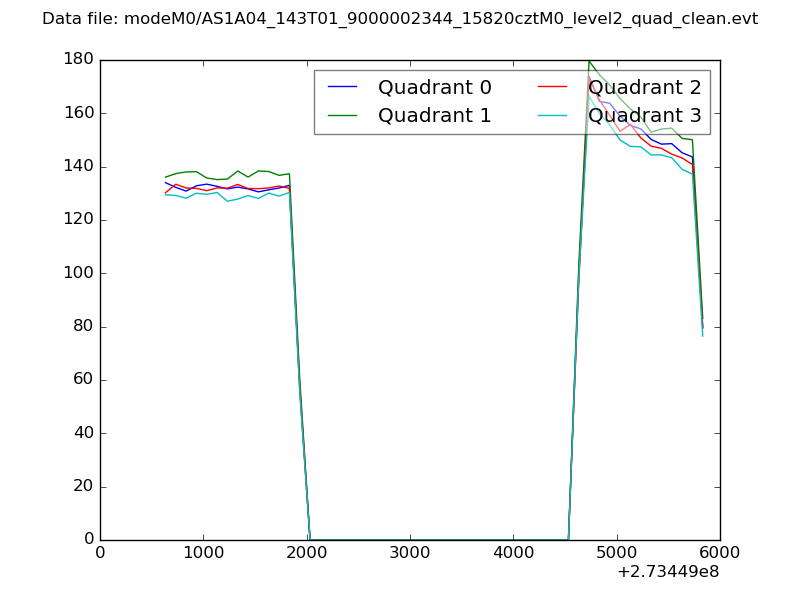 |
|
| Module-wise count rates for Quadrant A Data is divided into 100 sec bins |
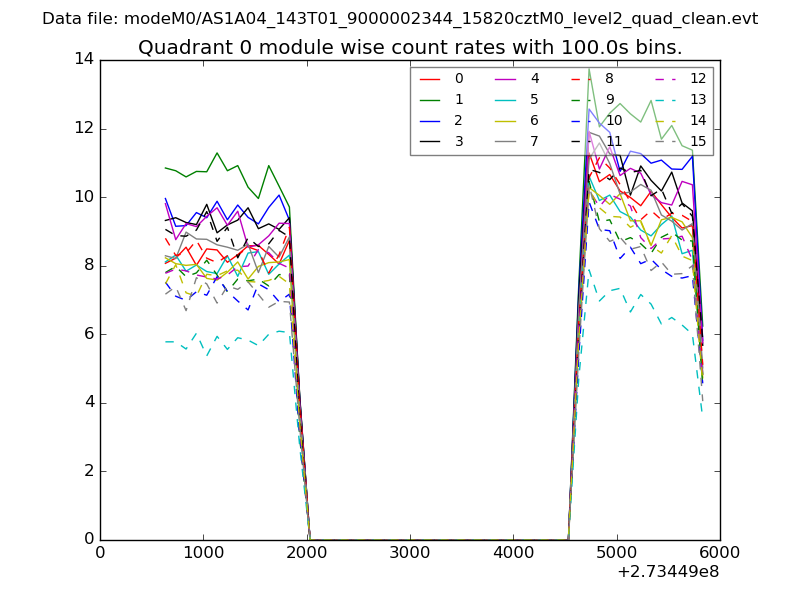 |
 |
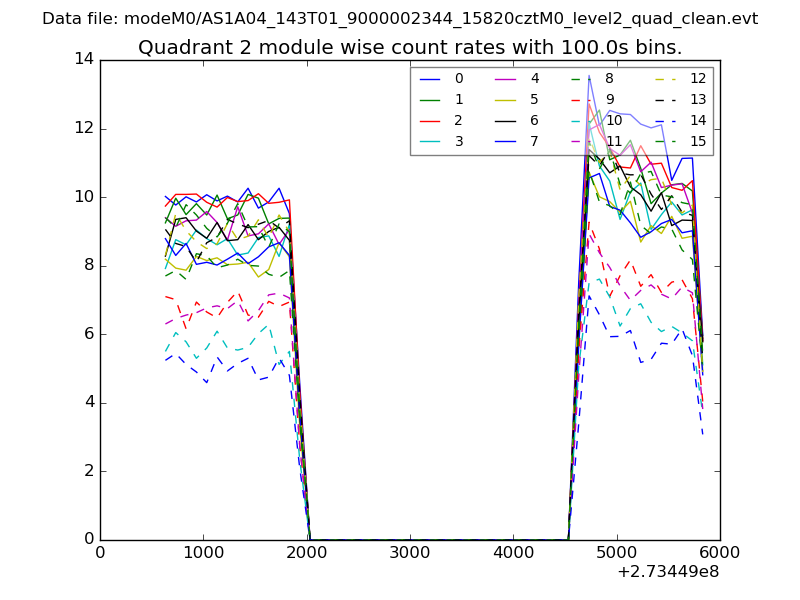
| Module-wise count rates for Quadrant B Data is divided into 100 sec bins |
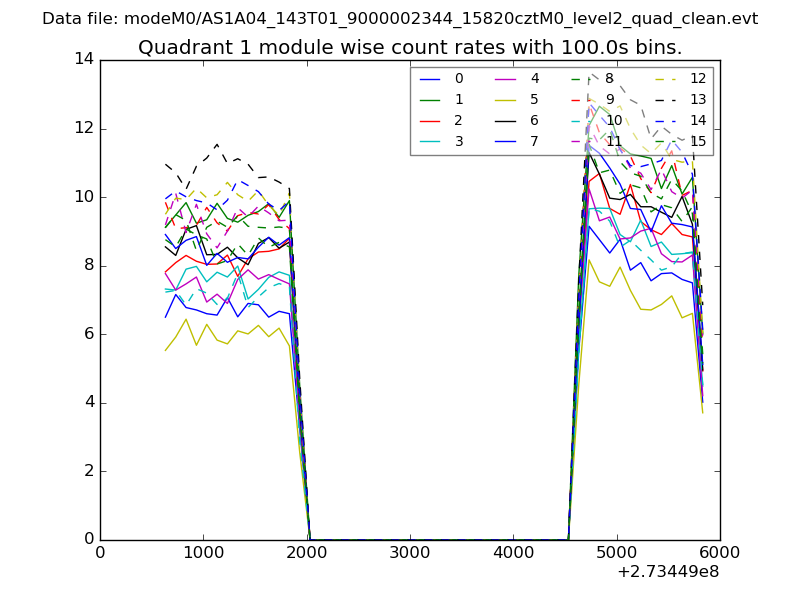 |
 |
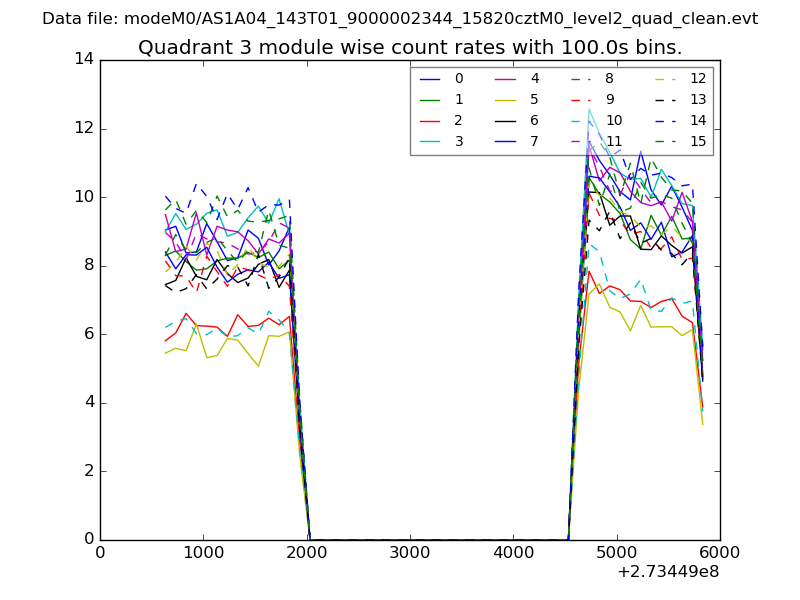
| Module-wise count rates for Quadrant C Data is divided into 100 sec bins |
 |
 |
| Module-wise count rates for Quadrant D Data is divided into 100 sec bins |
 |
 |
| Parameter | Plot |
|---|---|
| CZT HV Monitor | 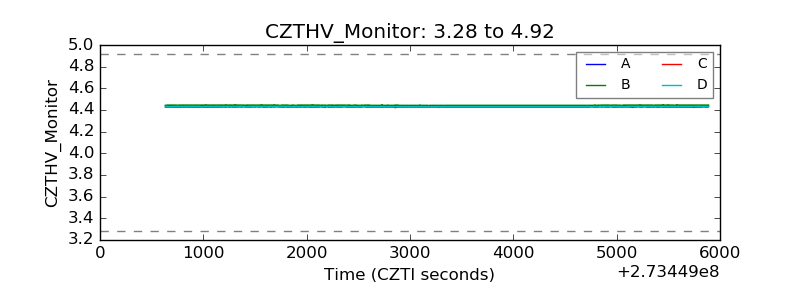 |
| D_VDD |  |
| Temperature 1 | 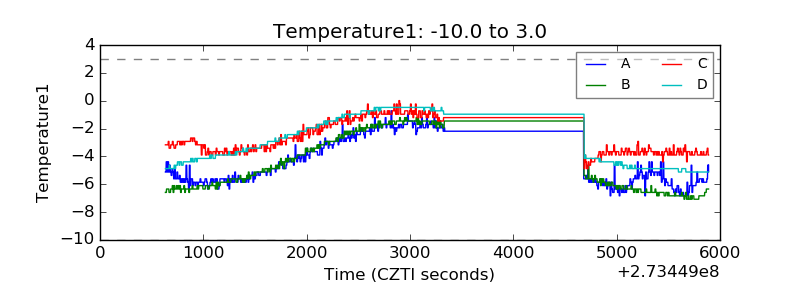 |
| Veto HV Monitor | 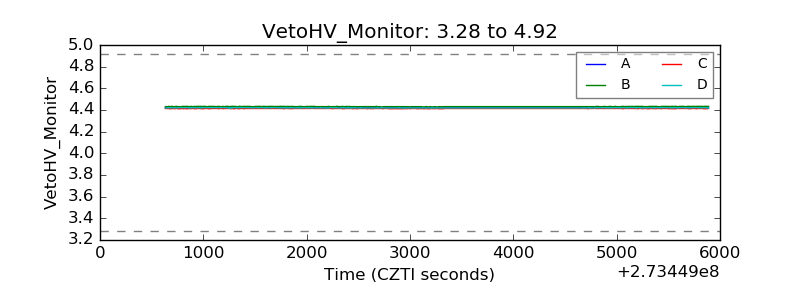 |
| Veto LLD | 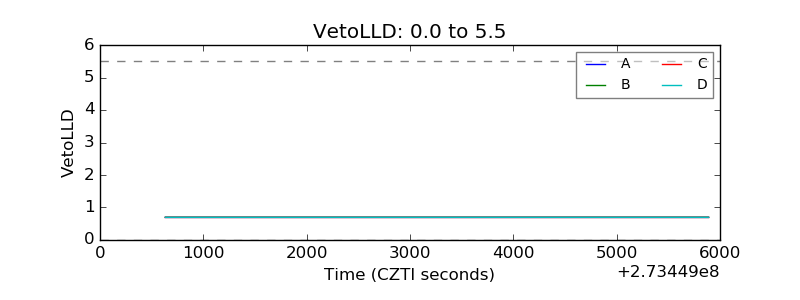 |
| Alpha Counter | 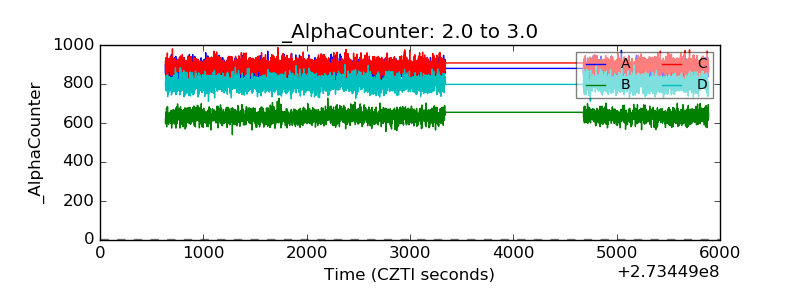 |
| _CPM_Rate | 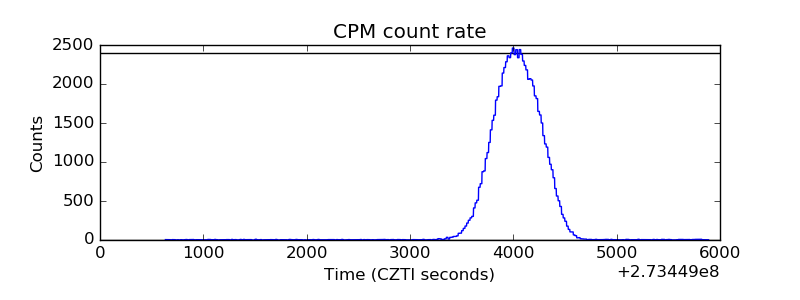 |
| CZT Counter |  |
| +2.5 Volts monitor |  |
| +5 Volts monitor |  |
| _ROLL_ROT | 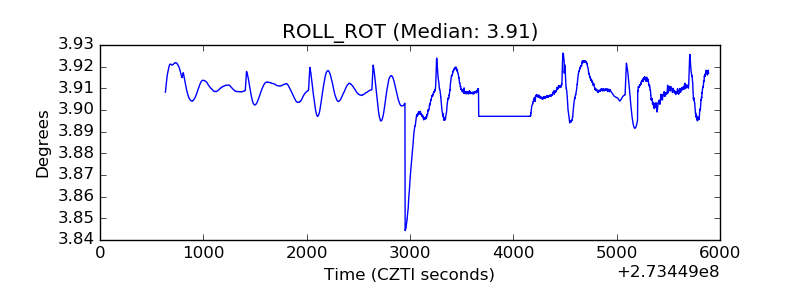 |
| _Roll_DEC | 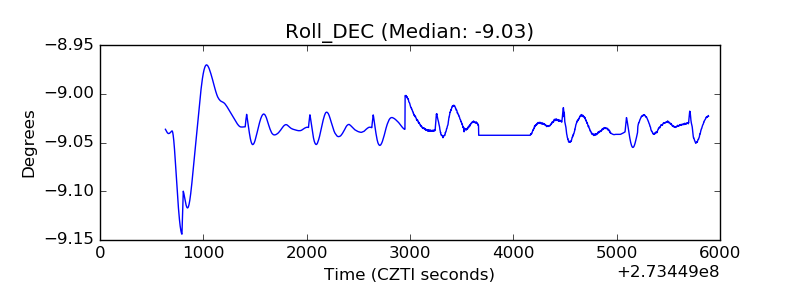 |
| _Roll_RA | 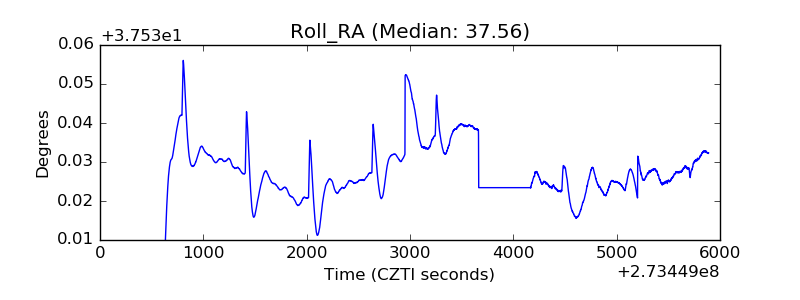 |
| Veto Counter | 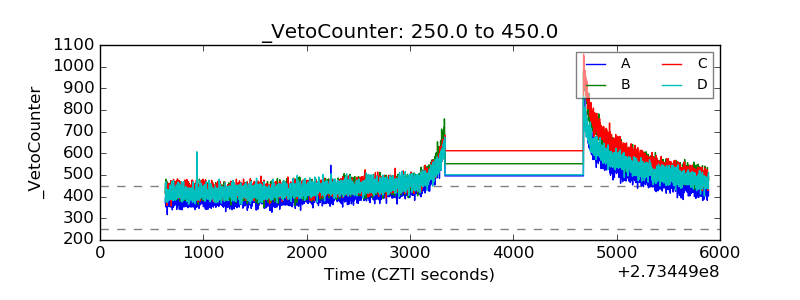 |