| Param | Original file | Final file |
|---|---|---|
| Filename | modeM0/AS1A04_143T01_9000002344_15821cztM0_level2.evt | modeM0/AS1A04_143T01_9000002344_15821cztM0_level2_quad_clean.evt |
| Size (bytes) | 480,864,960 | 105,134,400 |
| Size | 458.6 MB | 100.3 MB |
| Events in quadrant A | 3,413,375 | 678,748 |
| Events in quadrant B | 3,735,957 | 703,064 |
| Events in quadrant C | 3,555,659 | 668,626 |
| Events in quadrant D | 3,391,616 | 655,099 |
| Mode SS | |||
|---|---|---|---|
| Quadrant | BADHDUFLAG | Total packets | Discarded packets |
| A | 0 | 140 | 0 |
| B | 0 | 140 | 0 |
| C | 0 | 140 | 0 |
| D | 0 | 140 | 0 |
| Mode M0 | |||
|---|---|---|---|
| Quadrant | BADHDUFLAG | Total packets | Discarded packets |
| A | 0 | 14528 | 3 |
| B | 0 | 15457 | 2 |
| C | 0 | 14779 | 2 |
| D | 0 | 14643 | 2 |
| Mode M9 | |||
|---|---|---|---|
| Quadrant | BADHDUFLAG | Total packets | Discarded packets |
| A | 0 | 27 | 0 |
| B | 0 | 27 | 0 |
| C | 0 | 27 | 0 |
| D | 0 | 27 | 0 |
| Quadrant | Total seconds | Saturated seconds | Saturation percentage |
|---|---|---|---|
| A | 6872 | 52 | 0.756694% |
| B | 6872 | 121 | 1.760768% |
| C | 6872 | 73 | 1.062282% |
| D | 6872 | 20 | 0.291036% |
Noise dominated data is calculated using 1-second bins in cleaned event files. If a bin has >2000 counts, and if more than 50% of those come from <1% of pixels, then it is considered to be noise-dominated and hence unusable.
| Quadrant | # 1 sec bins | Bins with >0 counts | Bins with >2000 counts | High rate bins dominated by noise | Noise dominated (total time) | Noise dominated (detector-on time) | Marked lightcurve |
|---|---|---|---|---|---|---|---|
| A | 9528 | 6875 | 0 | 0 | 0.00% | 0.00% | 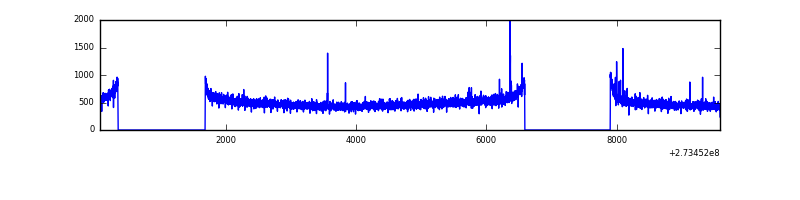 |
| B | 9528 | 6875 | 10 | 10 | 0.10% | 0.15% | 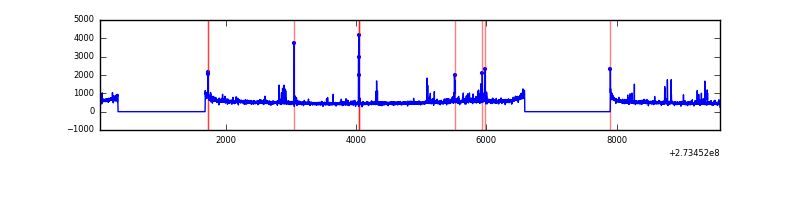 |
| C | 9528 | 6875 | 5 | 5 | 0.05% | 0.07% | 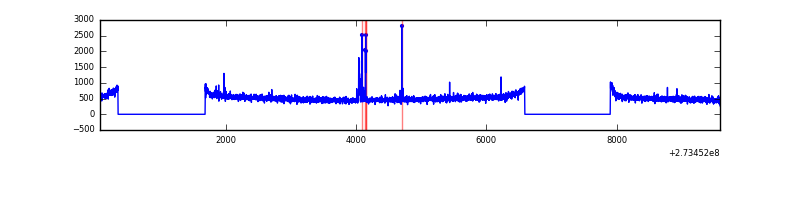 |
| D | 9528 | 6875 | 4 | 4 | 0.04% | 0.06% | 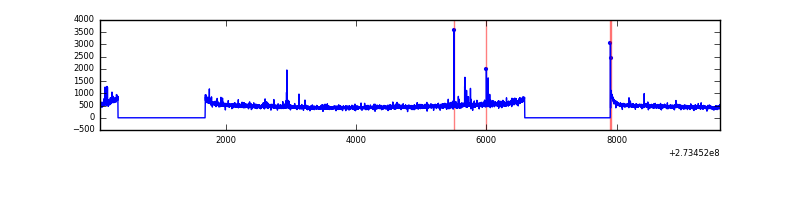 |
Top three noisy pixels from each quadrant. If the there are fewer than three noisy pixels in the level2.evt file, extra rows are filled as -1
| Pixel properties | Quadrant properties | ||||||
|---|---|---|---|---|---|---|---|
| Quadrant | DetID | PixID | Counts | Sigma | Mean | Median | Sigma |
| A | 9 | 143 | 15591 | 82.55 | 882 | 863 | 178.4 |
| A | 15 | 239 | 10118 | 51.88 | 882 | 863 | 178.4 |
| A | 0 | 226 | 7794 | 38.85 | 882 | 863 | 178.4 |
| B | 4 | 173 | 87606 | 514.41 | 891 | 869 | 168.6 |
| B | 0 | 189 | 65845 | 385.35 | 891 | 869 | 168.6 |
| B | 4 | 48 | 24056 | 137.52 | 891 | 869 | 168.6 |
| C | 14 | 238 | 131880 | 654.03 | 858 | 868 | 200.3 |
| C | 10 | 22 | 48218 | 236.38 | 858 | 868 | 200.3 |
| C | 3 | 233 | 9483 | 43.01 | 858 | 868 | 200.3 |
| D | 1 | 52 | 42853 | 195.15 | 857 | 837 | 215.3 |
| D | 7 | 223 | 25940 | 116.59 | 857 | 837 | 215.3 |
| D | 2 | 234 | 25726 | 115.6 | 857 | 837 | 215.3 |
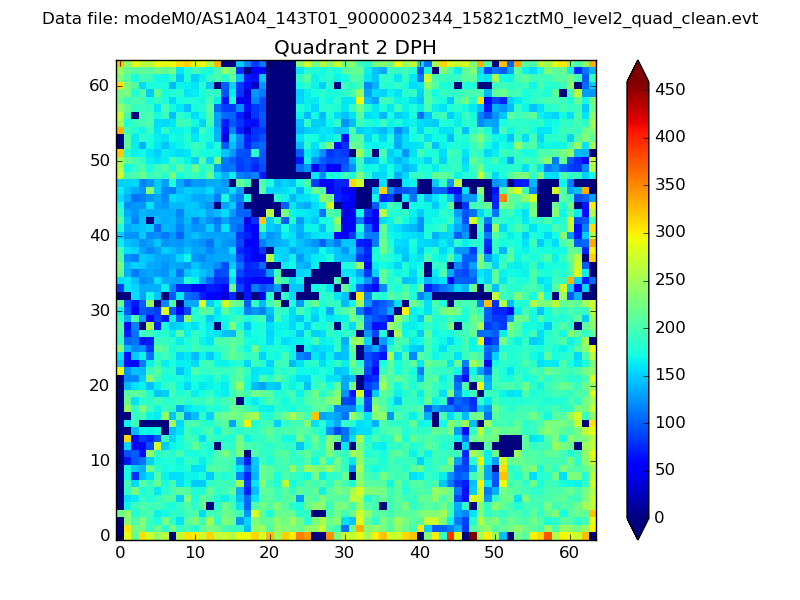
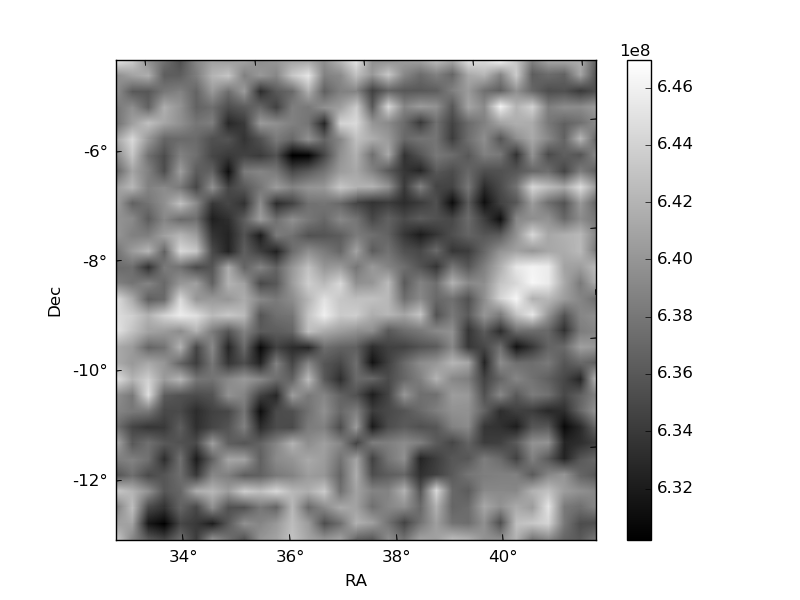
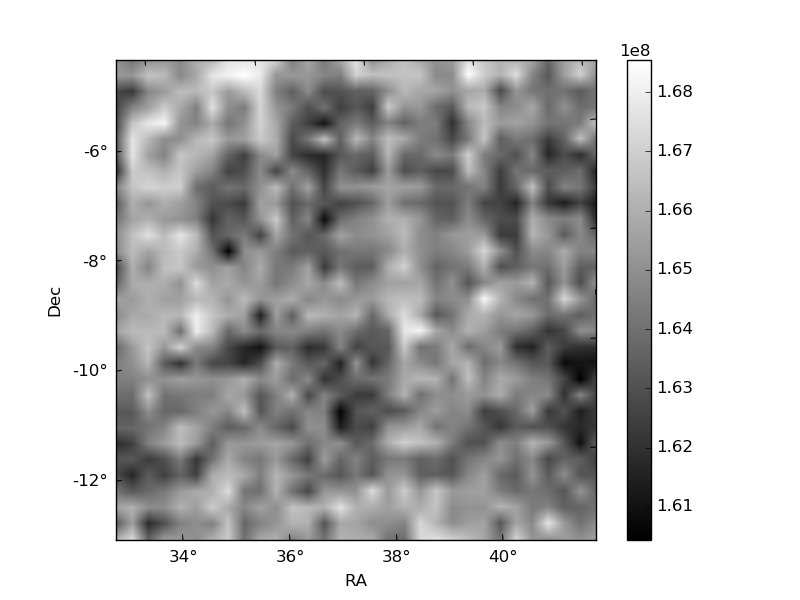
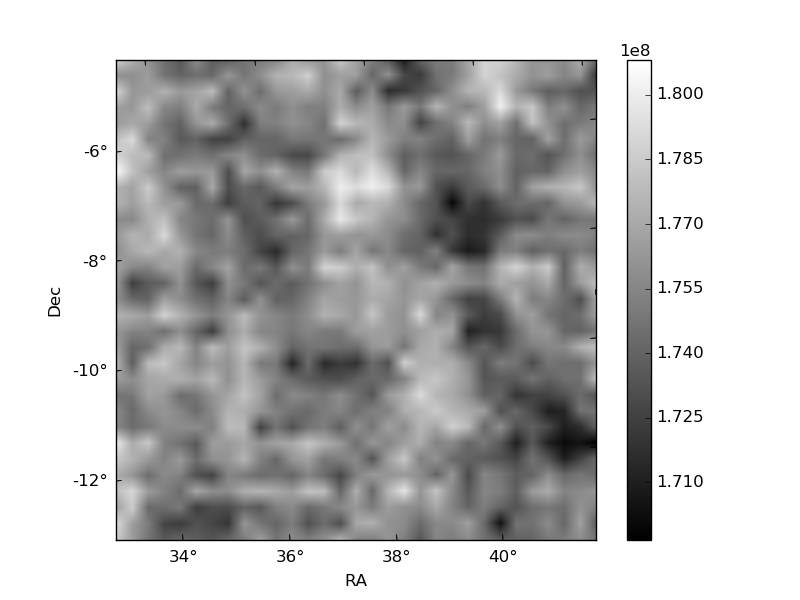
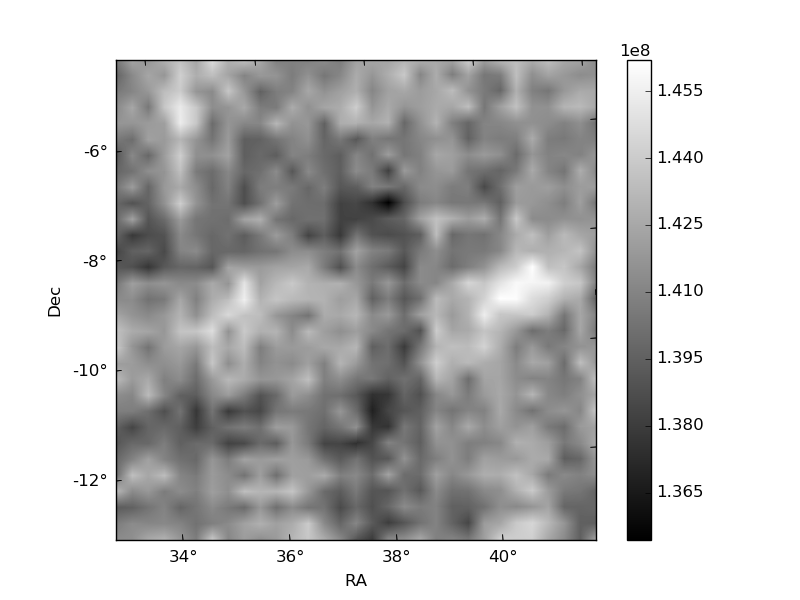
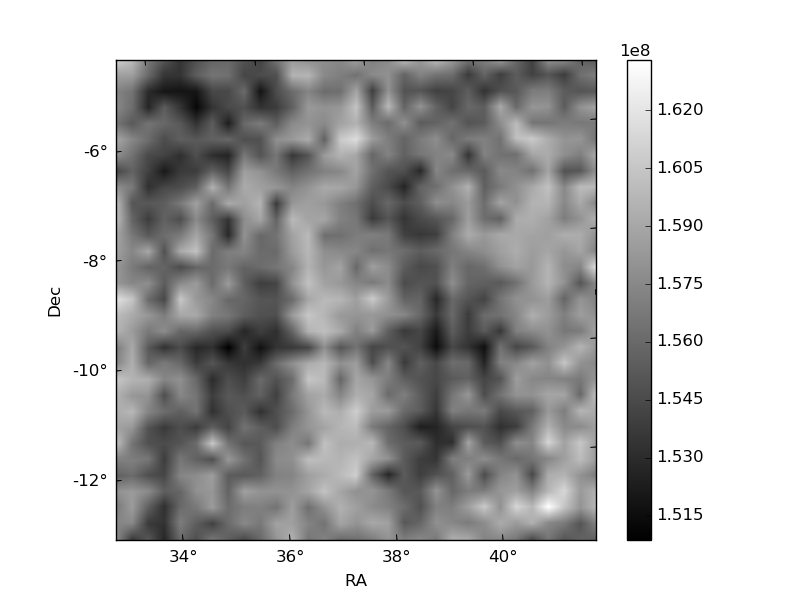
Histogram calculated using DETX and DETY for each event in the final _common_clean file
| Quadrant A | 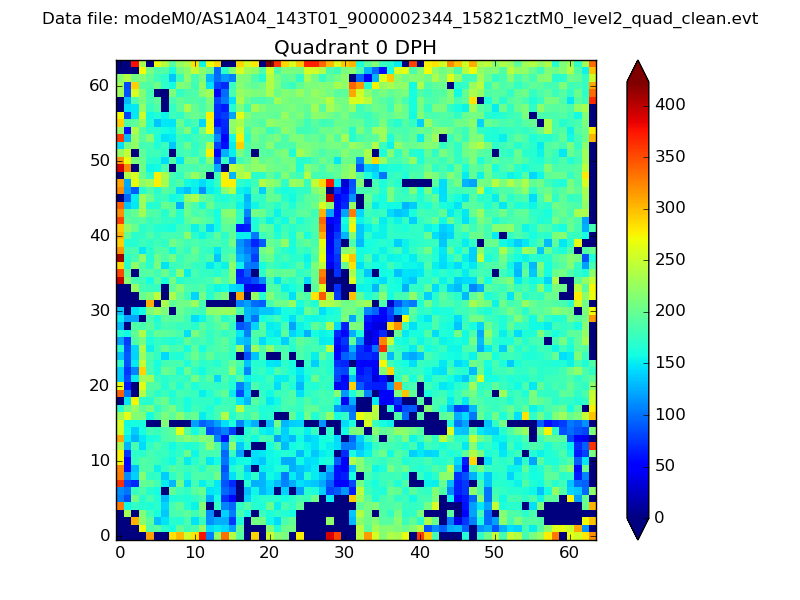 |
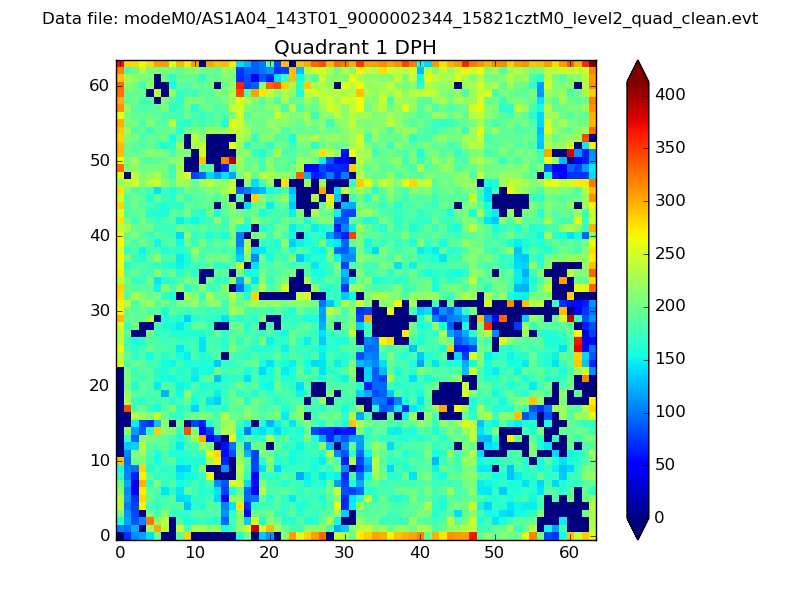 |
Quadrant B |
|---|---|---|---|
| Quadrant D | 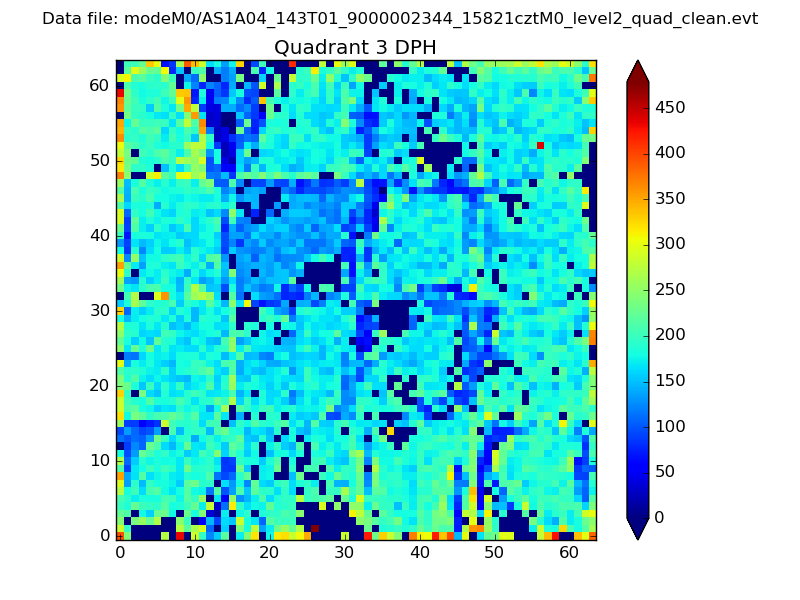 |
 |
Quadrant C |
| Plot type | Count rate plots | Images |
|---|---|---|
| Comparison with Poisson distribution Blue bars denote a histogram of data divided into 1 sec bins. Red curve is a Poisson curve with rate = median count rate of data. |
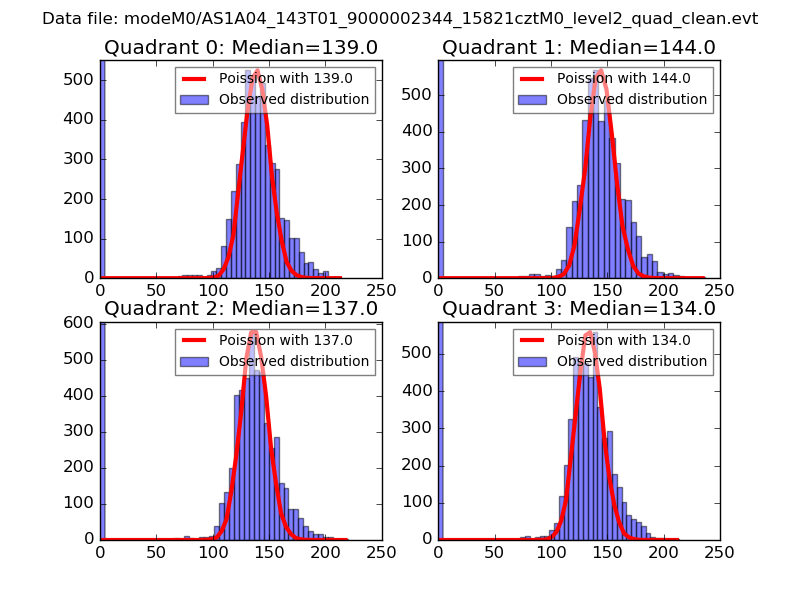 |
 |
| Quadrant-wise count rates Data is divided into 100 sec bins |
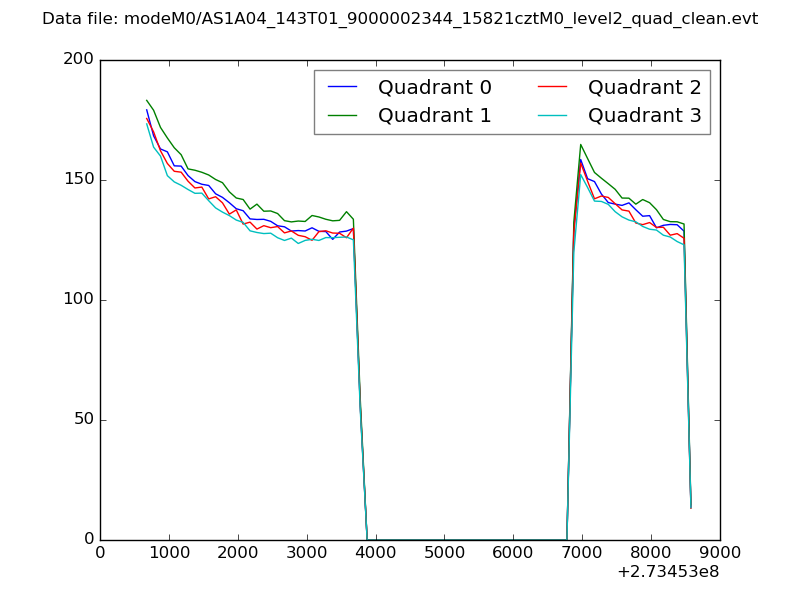 |
|
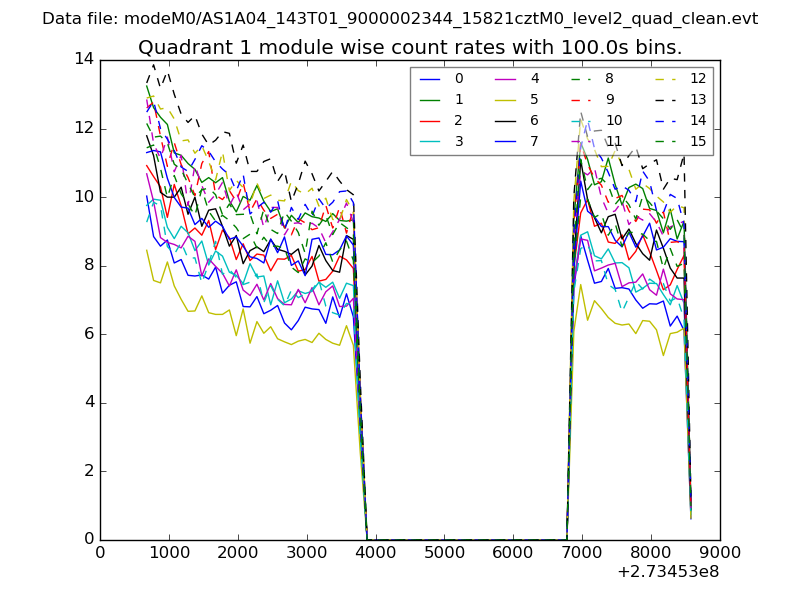
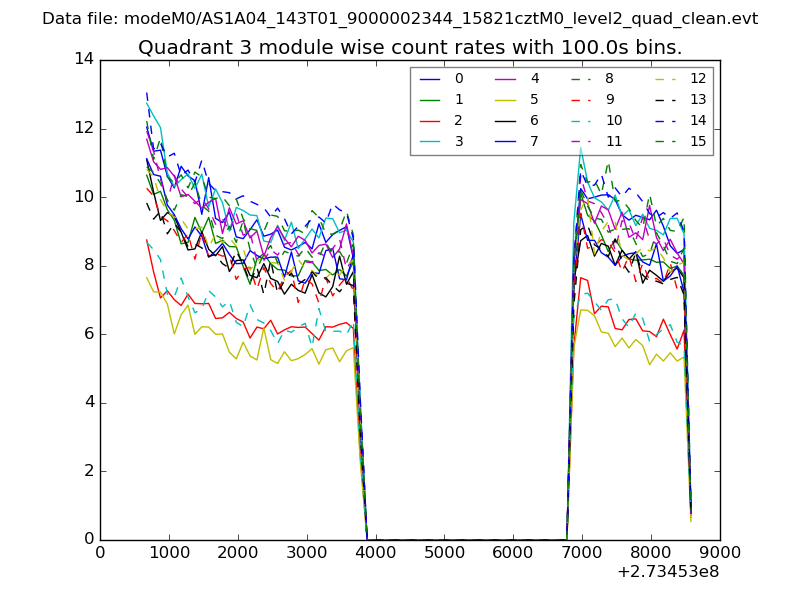
| Module-wise count rates for Quadrant A Data is divided into 100 sec bins |
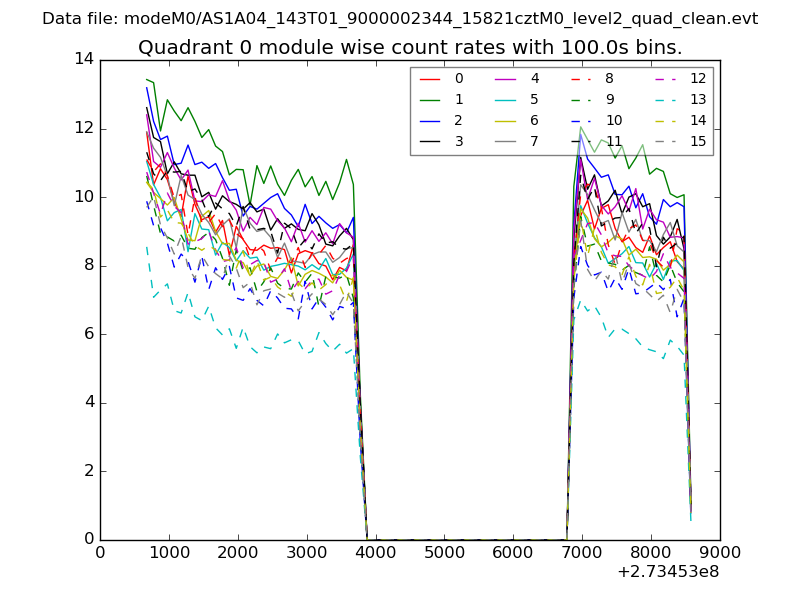 |
 |
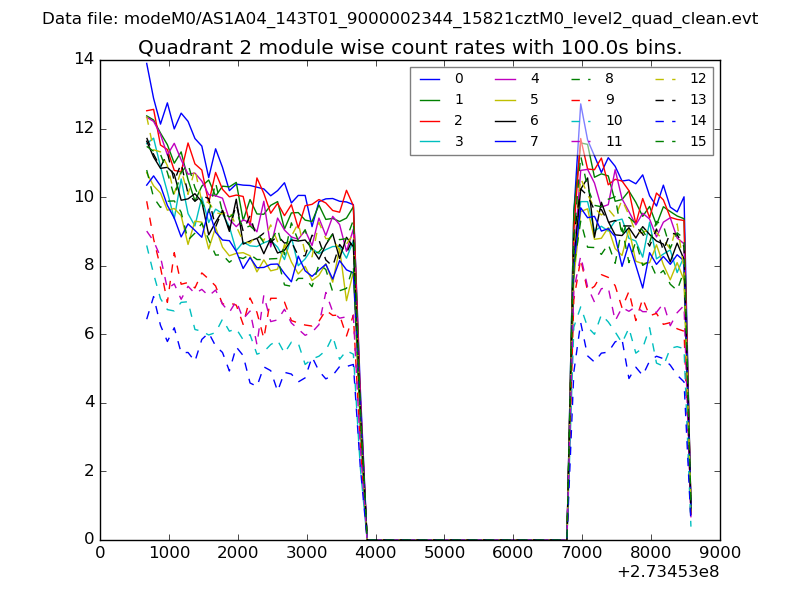
| Module-wise count rates for Quadrant B Data is divided into 100 sec bins |
 |
 |
| Module-wise count rates for Quadrant C Data is divided into 100 sec bins |
 |
 |
| Module-wise count rates for Quadrant D Data is divided into 100 sec bins |
 |
 |
| Parameter | Plot |
|---|---|
| CZT HV Monitor | 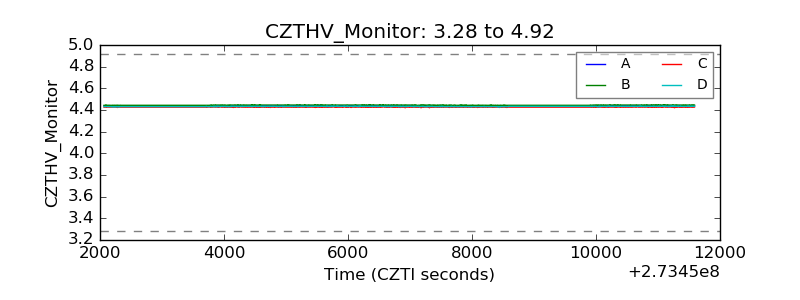 |
| D_VDD | 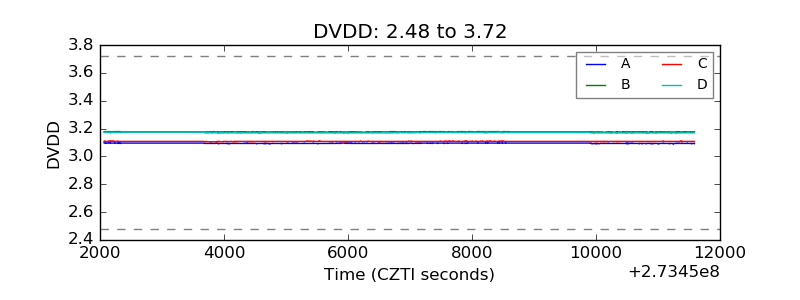 |
| Temperature 1 | 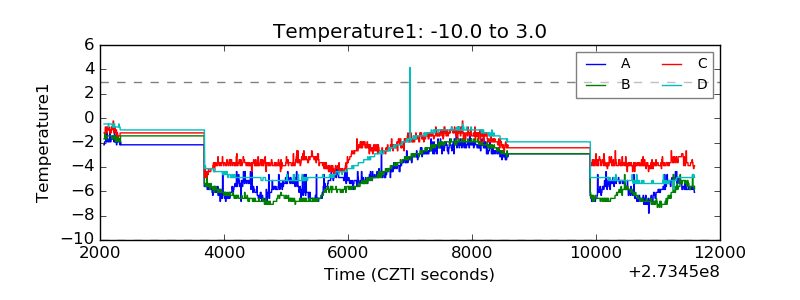 |
| Veto HV Monitor | 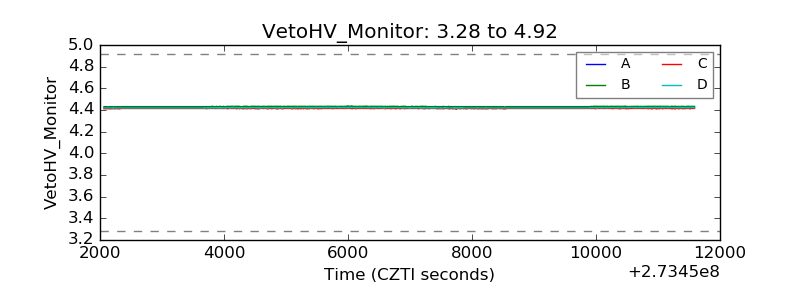 |
| Veto LLD | 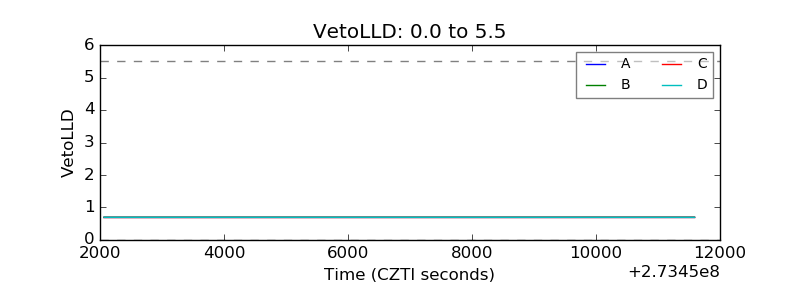 |
| Alpha Counter | 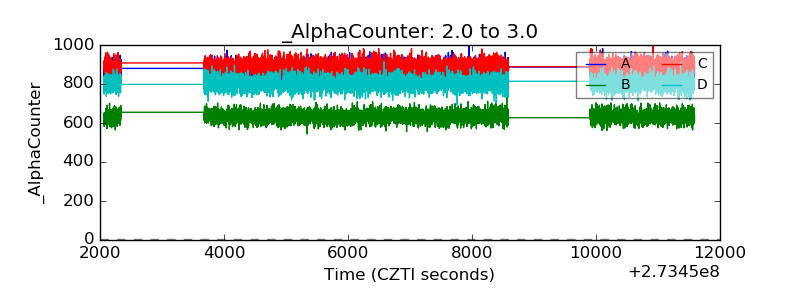 |
| _CPM_Rate | 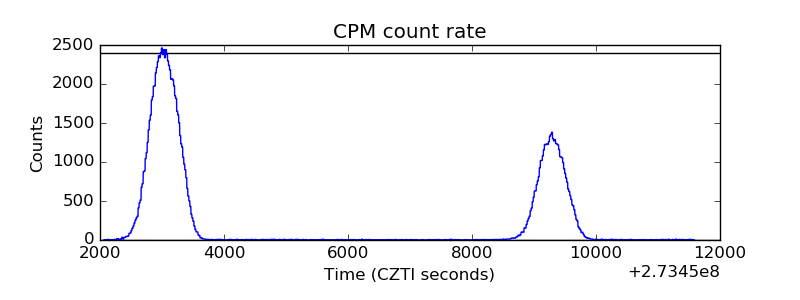 |
| CZT Counter | 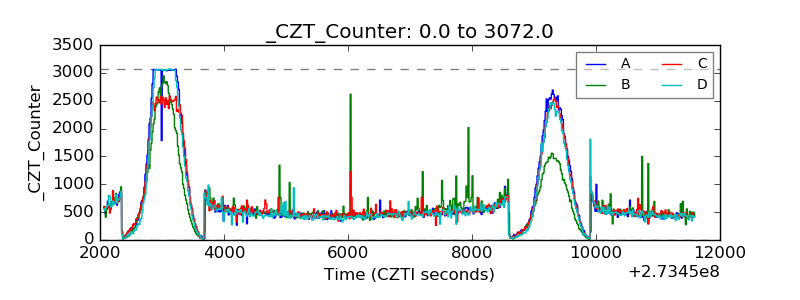 |
| +2.5 Volts monitor |  |
| +5 Volts monitor |  |
| _ROLL_ROT | 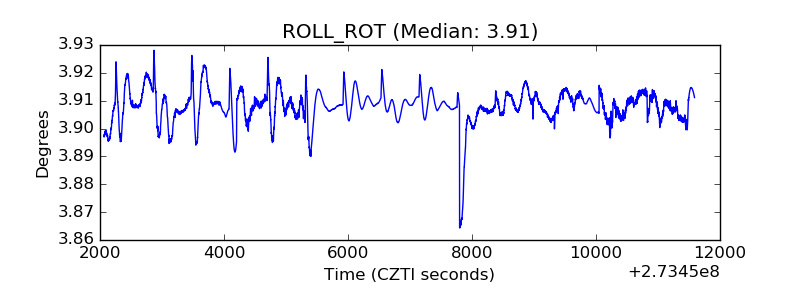 |
| _Roll_DEC | 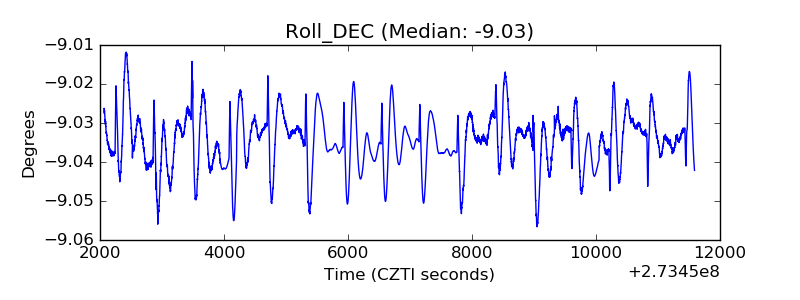 |
| _Roll_RA | 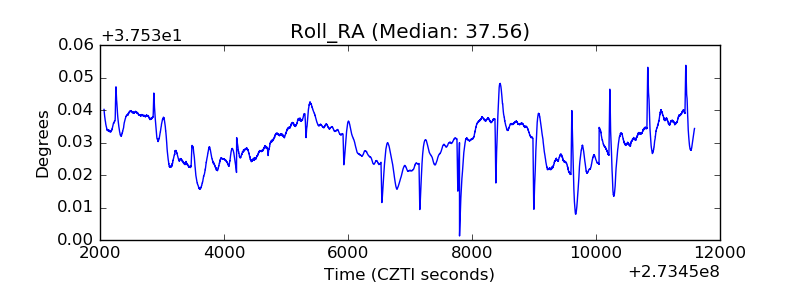 |
| Veto Counter | 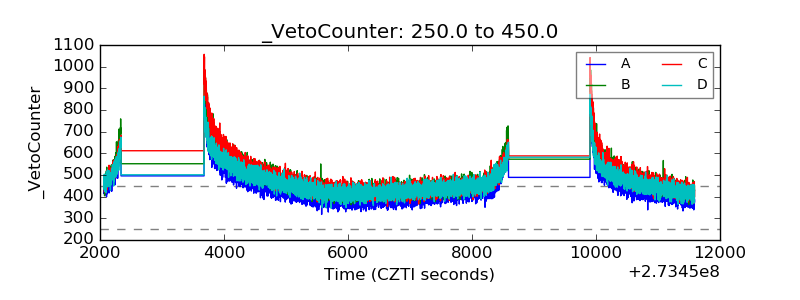 |