| Param | Original file | Final file |
|---|---|---|
| Filename | modeM0/AS1A04_143T01_9000002344_15822cztM0_level2.evt | modeM0/AS1A04_143T01_9000002344_15822cztM0_level2_quad_clean.evt |
| Size (bytes) | 459,086,400 | 95,754,240 |
| Size | 437.8 MB | 91.3 MB |
| Events in quadrant A | 3,303,075 | 608,828 |
| Events in quadrant B | 3,544,940 | 627,277 |
| Events in quadrant C | 3,348,081 | 597,586 |
| Events in quadrant D | 3,240,520 | 587,482 |
| Mode SS | |||
|---|---|---|---|
| Quadrant | BADHDUFLAG | Total packets | Discarded packets |
| A | 0 | 142 | 0 |
| B | 0 | 142 | 0 |
| C | 0 | 142 | 0 |
| D | 0 | 142 | 0 |
| Mode M0 | |||
|---|---|---|---|
| Quadrant | BADHDUFLAG | Total packets | Discarded packets |
| A | 0 | 14287 | 3 |
| B | 0 | 14931 | 2 |
| C | 0 | 14272 | 2 |
| D | 0 | 14248 | 2 |
| Mode M9 | |||
|---|---|---|---|
| Quadrant | BADHDUFLAG | Total packets | Discarded packets |
| A | 0 | 25 | 0 |
| B | 0 | 25 | 0 |
| C | 0 | 25 | 0 |
| D | 0 | 25 | 0 |
| Quadrant | Total seconds | Saturated seconds | Saturation percentage |
|---|---|---|---|
| A | 6867 | 26 | 0.378622% |
| B | 6867 | 101 | 1.470802% |
| C | 6867 | 54 | 0.786370% |
| D | 6867 | 13 | 0.189311% |
Noise dominated data is calculated using 1-second bins in cleaned event files. If a bin has >2000 counts, and if more than 50% of those come from <1% of pixels, then it is considered to be noise-dominated and hence unusable.
| Quadrant | # 1 sec bins | Bins with >0 counts | Bins with >2000 counts | High rate bins dominated by noise | Noise dominated (total time) | Noise dominated (detector-on time) | Marked lightcurve |
|---|---|---|---|---|---|---|---|
| A | 9333 | 6870 | 2 | 2 | 0.02% | 0.03% | 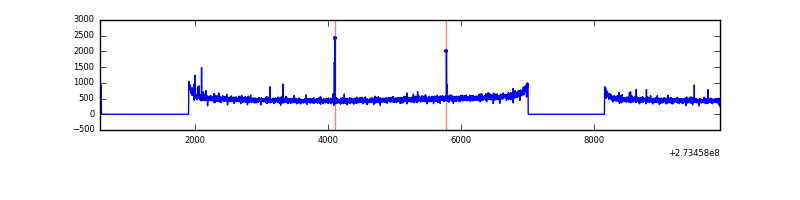 |
| B | 9333 | 6870 | 22 | 22 | 0.24% | 0.32% | 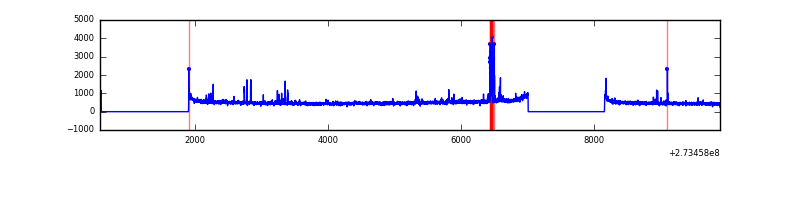 |
| C | 9333 | 6870 | 0 | 0 | 0.00% | 0.00% | 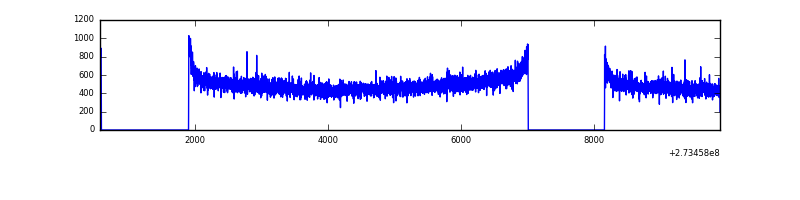 |
| D | 9333 | 6870 | 3 | 3 | 0.03% | 0.04% | 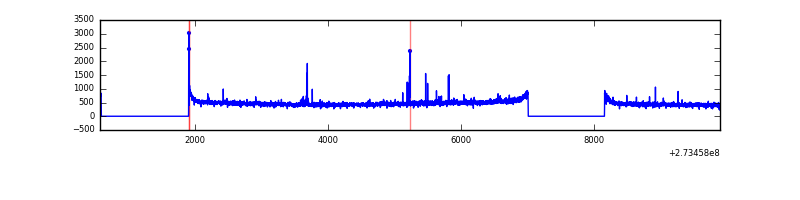 |
Top three noisy pixels from each quadrant. If the there are fewer than three noisy pixels in the level2.evt file, extra rows are filled as -1
| Pixel properties | Quadrant properties | ||||||
|---|---|---|---|---|---|---|---|
| Quadrant | DetID | PixID | Counts | Sigma | Mean | Median | Sigma |
| A | 9 | 143 | 18918 | 104.49 | 851 | 832 | 173.1 |
| A | 15 | 239 | 11723 | 62.92 | 851 | 832 | 173.1 |
| A | 0 | 226 | 7517 | 38.62 | 851 | 832 | 173.1 |
| B | 0 | 182 | 94386 | 571.74 | 854 | 834 | 163.6 |
| B | 4 | 173 | 55455 | 333.81 | 854 | 834 | 163.6 |
| B | 0 | 229 | 22284 | 131.09 | 854 | 834 | 163.6 |
| C | 14 | 238 | 125623 | 641.83 | 823 | 830 | 194.4 |
| C | 7 | 247 | 6356 | 28.42 | 823 | 830 | 194.4 |
| C | 13 | 61 | 5928 | 26.22 | 823 | 830 | 194.4 |
| D | 7 | 223 | 33218 | 145.6 | 823 | 810 | 222.6 |
| D | 2 | 234 | 24811 | 107.83 | 823 | 810 | 222.6 |
| D | 2 | 152 | 19510 | 84.01 | 823 | 810 | 222.6 |
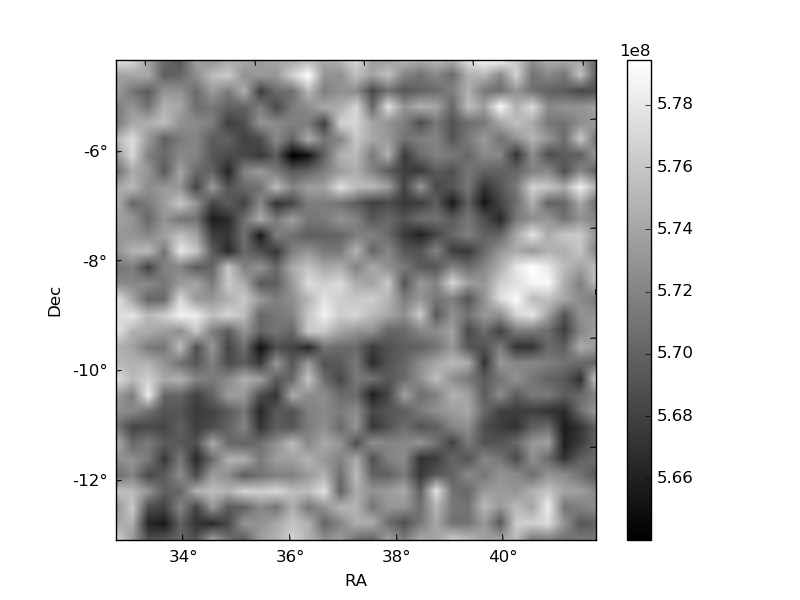
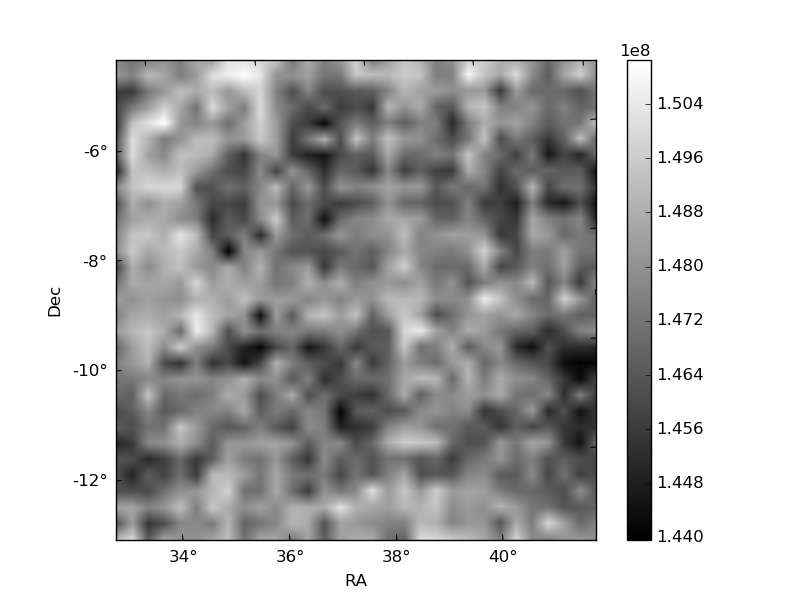
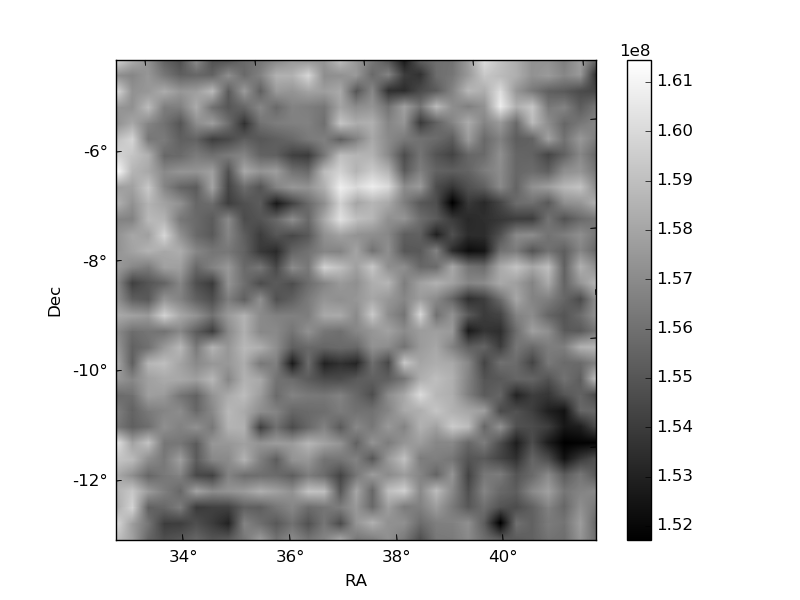
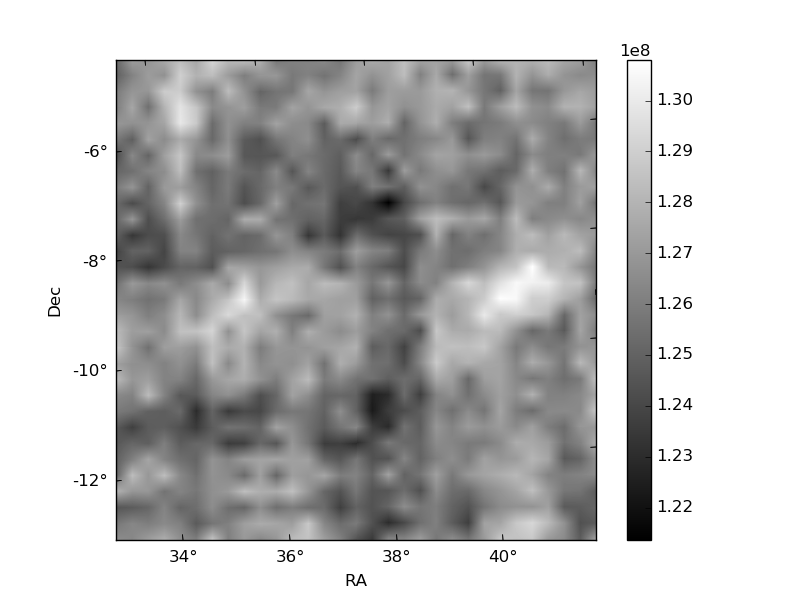
Histogram calculated using DETX and DETY for each event in the final _common_clean file
| Quadrant A | 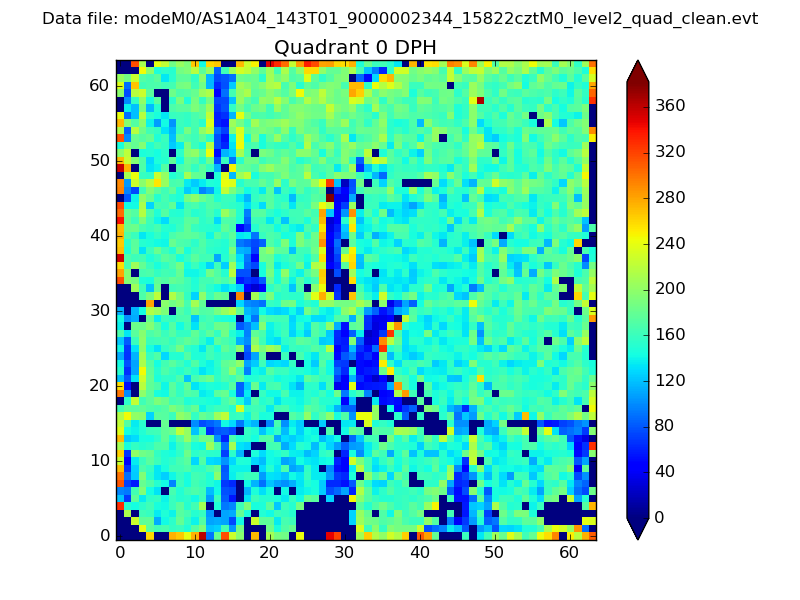 |
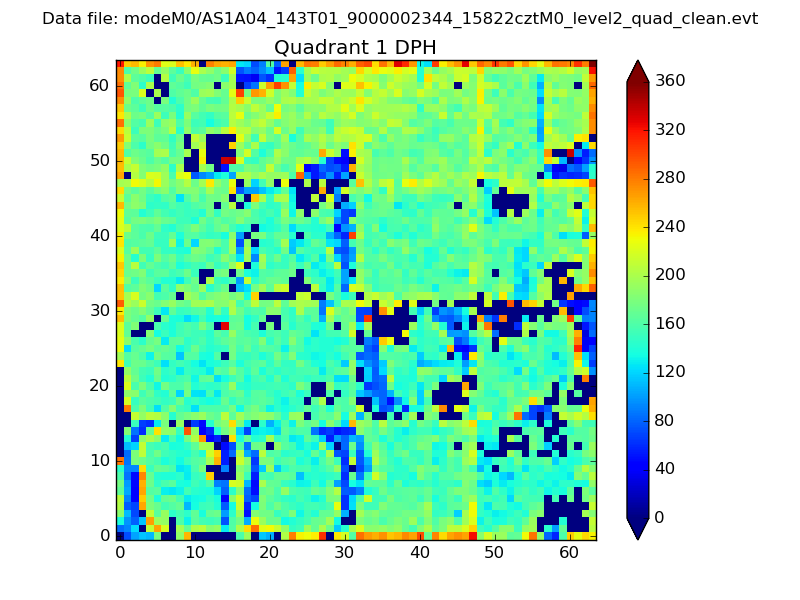 |
Quadrant B |
|---|---|---|---|
| Quadrant D |  |
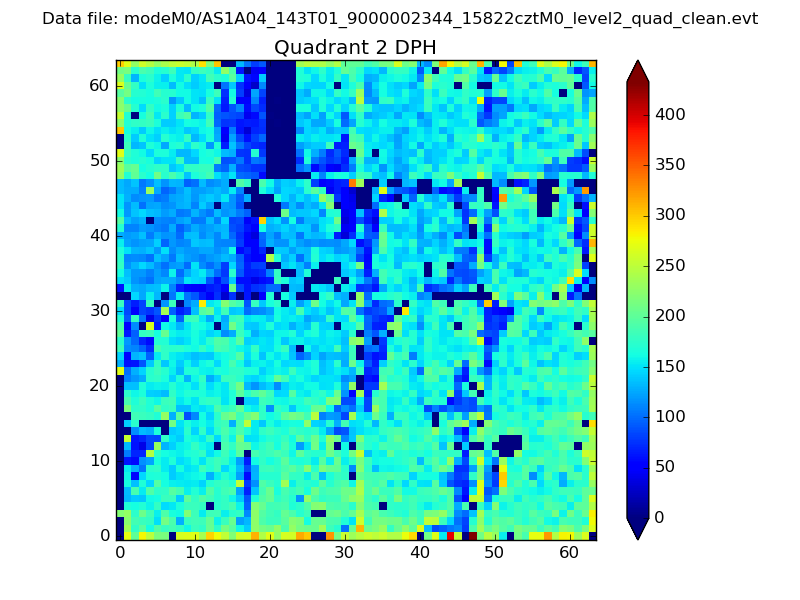 |
Quadrant C |
| Plot type | Count rate plots | Images |
|---|---|---|
| Comparison with Poisson distribution Blue bars denote a histogram of data divided into 1 sec bins. Red curve is a Poisson curve with rate = median count rate of data. |
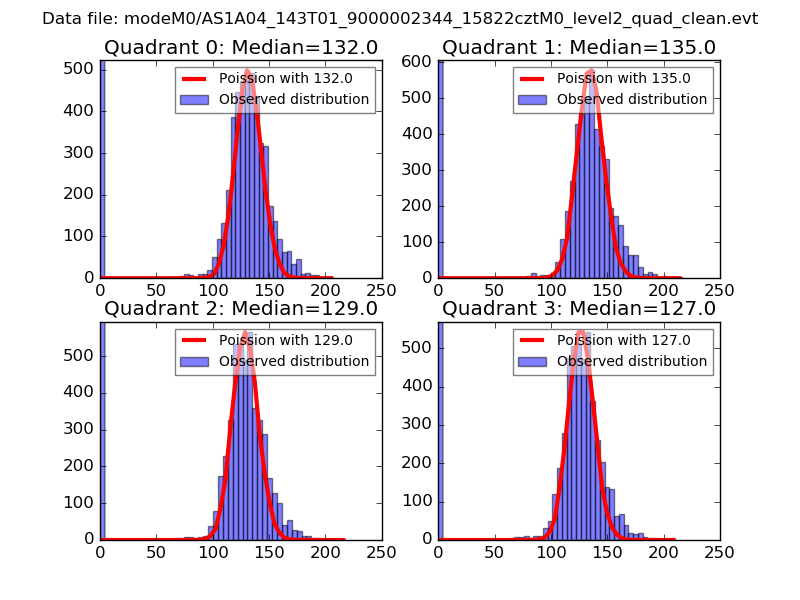 |
 |
| Quadrant-wise count rates Data is divided into 100 sec bins |
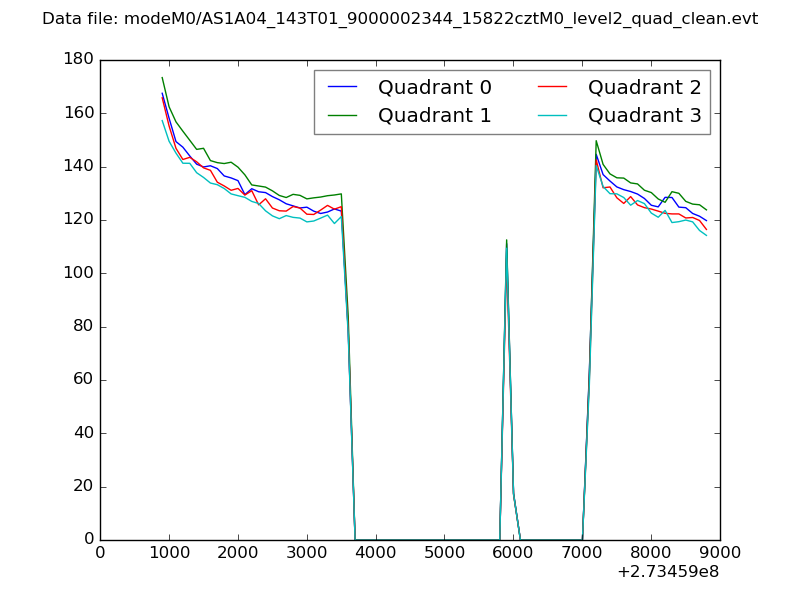 |
|
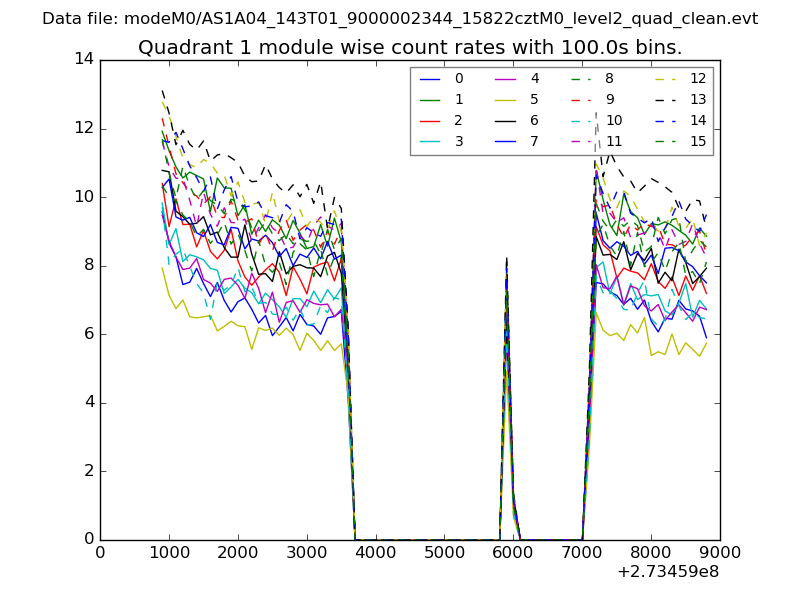
| Module-wise count rates for Quadrant A Data is divided into 100 sec bins |
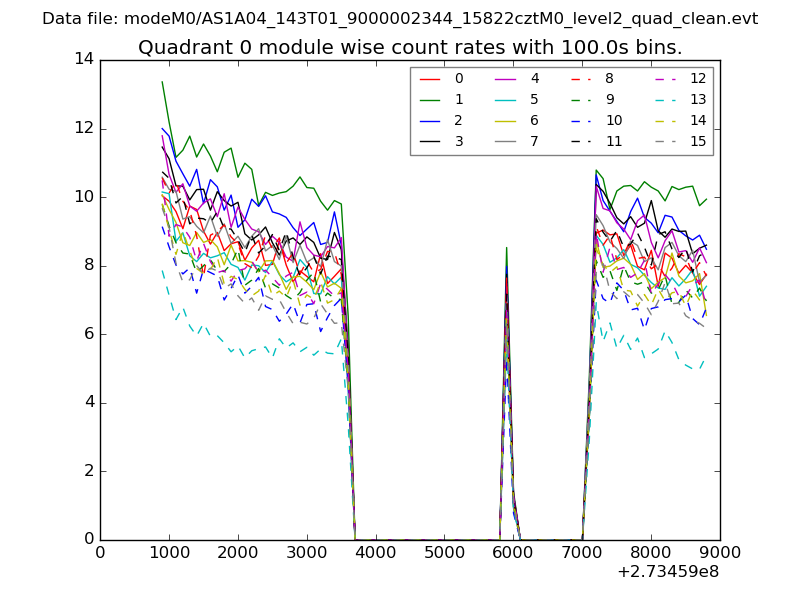 |
 |
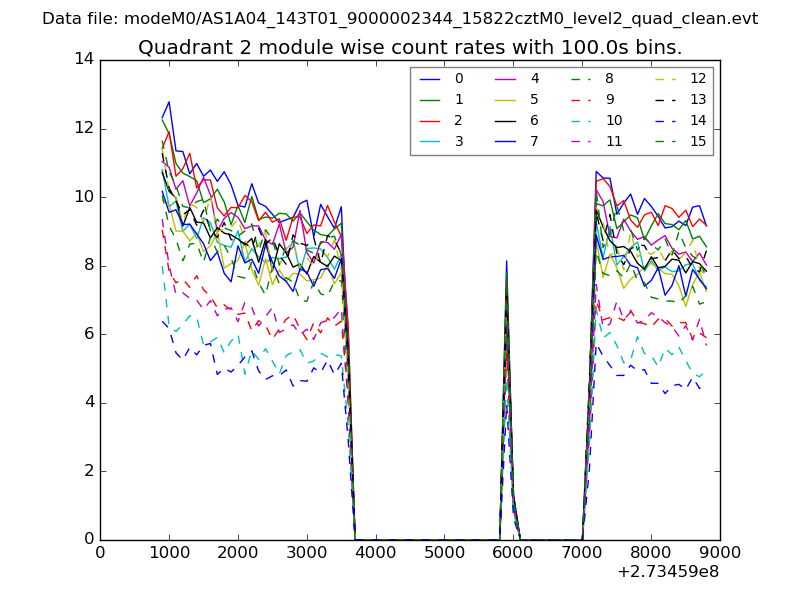
| Module-wise count rates for Quadrant B Data is divided into 100 sec bins |
 |
 |
| Module-wise count rates for Quadrant C Data is divided into 100 sec bins |
 |
 |
| Module-wise count rates for Quadrant D Data is divided into 100 sec bins |
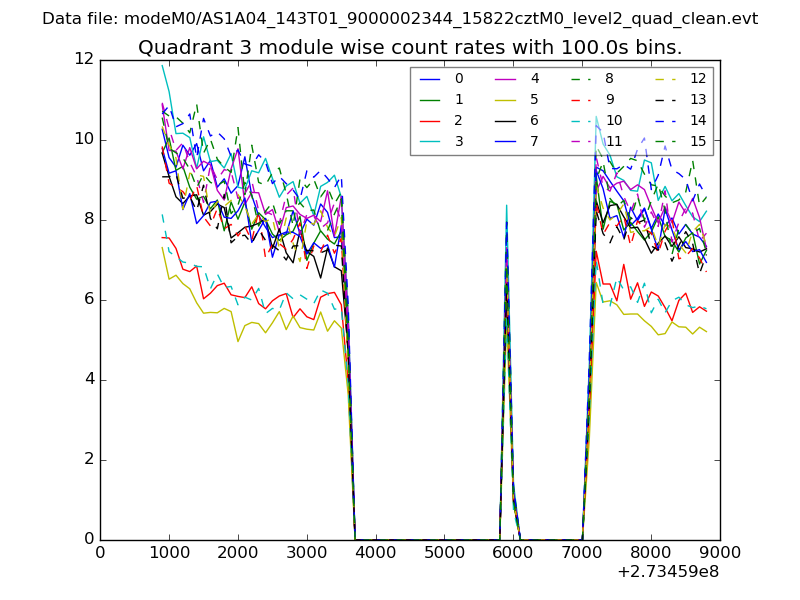 |
 |
| Parameter | Plot |
|---|---|
| CZT HV Monitor | 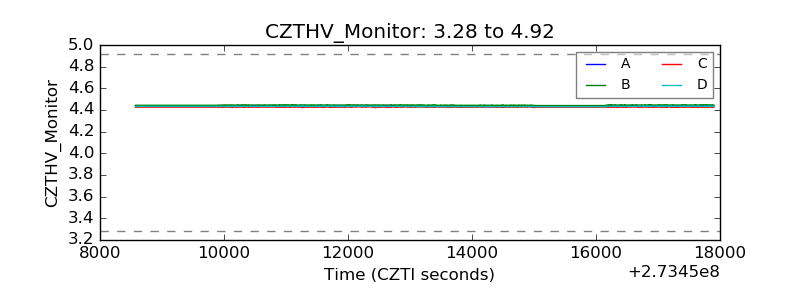 |
| D_VDD | 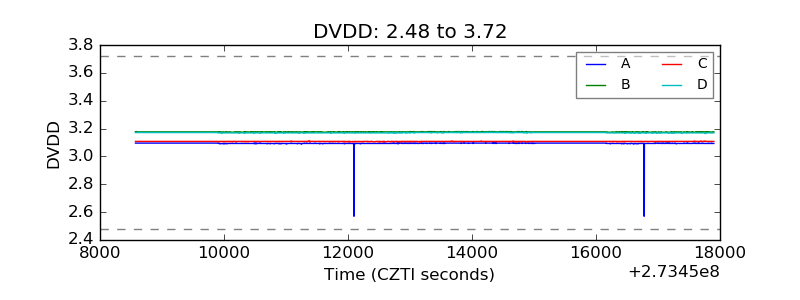 |
| Temperature 1 | 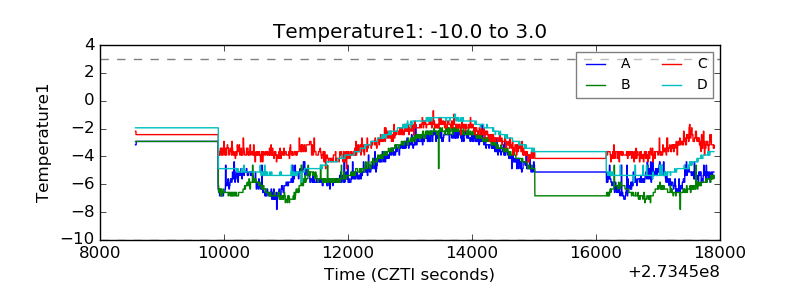 |
| Veto HV Monitor | 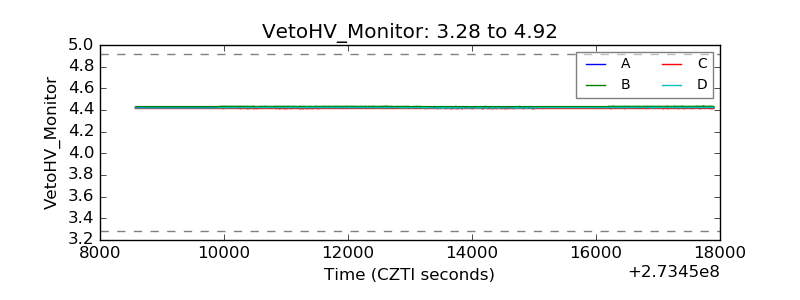 |
| Veto LLD | 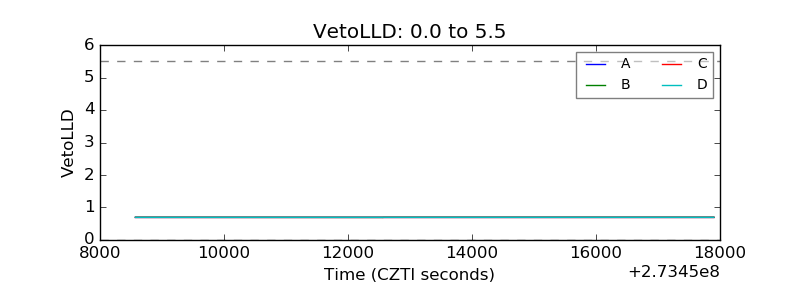 |
| Alpha Counter | 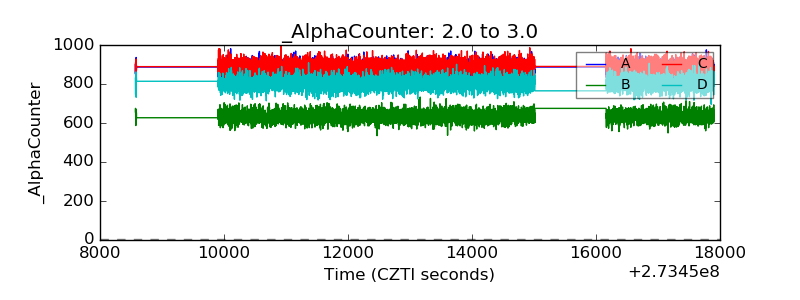 |
| _CPM_Rate | 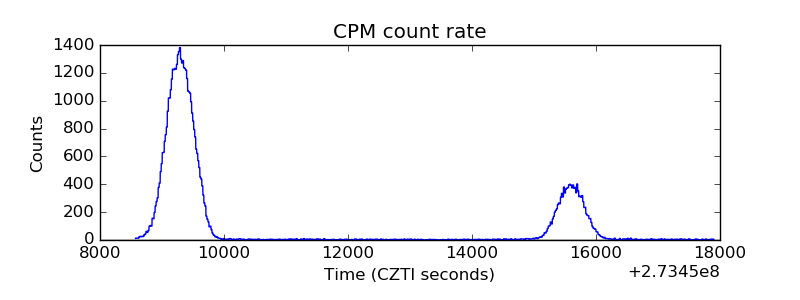 |
| CZT Counter | 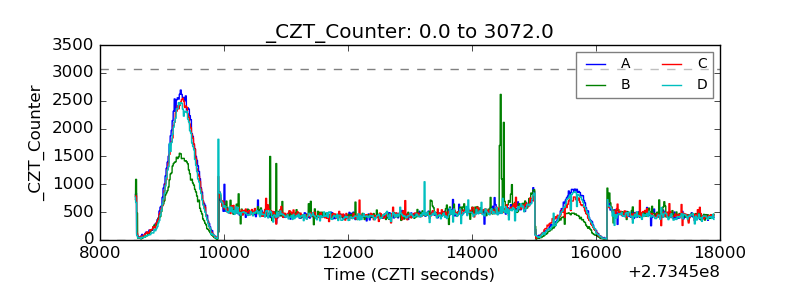 |
| +2.5 Volts monitor | 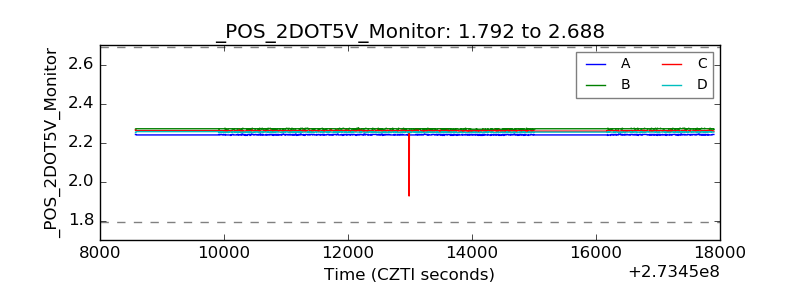 |
| +5 Volts monitor |  |
| _ROLL_ROT | 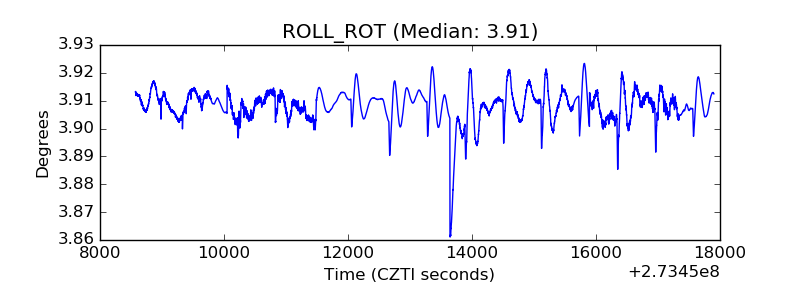 |
| _Roll_DEC | 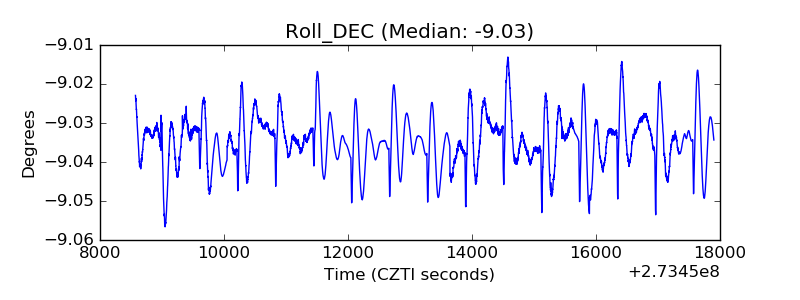 |
| _Roll_RA | 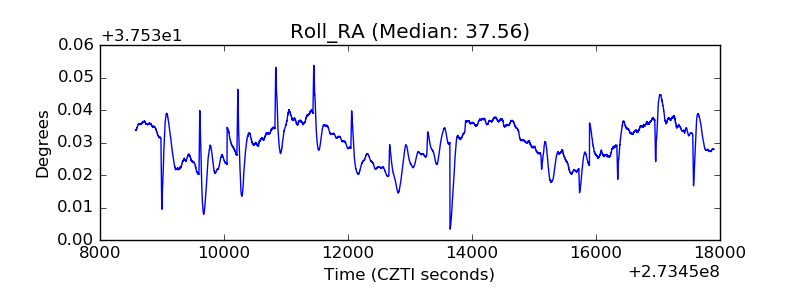 |
| Veto Counter | 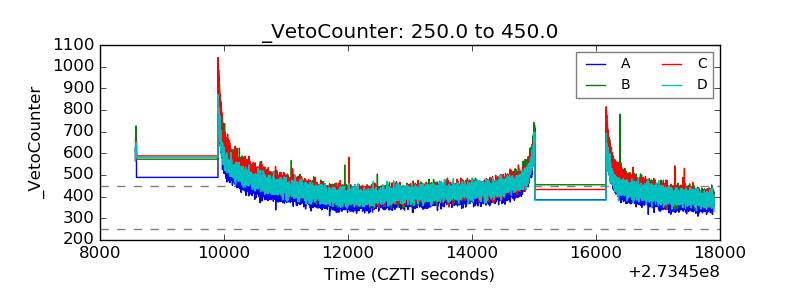 |