| Param | Original file | Final file |
|---|---|---|
| Filename | modeM0/AS1A04_143T01_9000002344_15823cztM0_level2.evt | modeM0/AS1A04_143T01_9000002344_15823cztM0_level2_quad_clean.evt |
| Size (bytes) | 491,094,720 | 101,252,160 |
| Size | 468.3 MB | 96.6 MB |
| Events in quadrant A | 3,605,824 | 645,986 |
| Events in quadrant B | 3,773,718 | 657,608 |
| Events in quadrant C | 3,523,583 | 630,865 |
| Events in quadrant D | 3,471,075 | 621,156 |
| Mode SS | |||
|---|---|---|---|
| Quadrant | BADHDUFLAG | Total packets | Discarded packets |
| A | 0 | 150 | 0 |
| B | 0 | 150 | 0 |
| C | 0 | 150 | 0 |
| D | 0 | 150 | 0 |
| Mode M0 | |||
|---|---|---|---|
| Quadrant | BADHDUFLAG | Total packets | Discarded packets |
| A | 0 | 15564 | 3 |
| B | 0 | 15945 | 2 |
| C | 0 | 15149 | 2 |
| D | 0 | 15404 | 2 |
| Mode M9 | |||
|---|---|---|---|
| Quadrant | BADHDUFLAG | Total packets | Discarded packets |
| A | 0 | 14 | 0 |
| B | 0 | 14 | 0 |
| C | 0 | 14 | 0 |
| D | 0 | 15 | 0 |
| Quadrant | Total seconds | Saturated seconds | Saturation percentage |
|---|---|---|---|
| A | 7334 | 118 | 1.608945% |
| B | 7334 | 139 | 1.895282% |
| C | 7334 | 102 | 1.390783% |
| D | 7334 | 63 | 0.859013% |
Noise dominated data is calculated using 1-second bins in cleaned event files. If a bin has >2000 counts, and if more than 50% of those come from <1% of pixels, then it is considered to be noise-dominated and hence unusable.
| Quadrant | # 1 sec bins | Bins with >0 counts | Bins with >2000 counts | High rate bins dominated by noise | Noise dominated (total time) | Noise dominated (detector-on time) | Marked lightcurve |
|---|---|---|---|---|---|---|---|
| A | 8075 | 7336 | 37 | 37 | 0.46% | 0.50% | 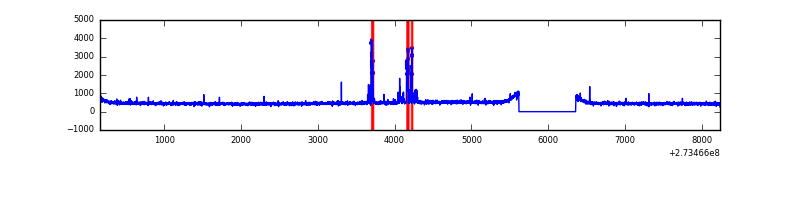 |
| B | 8075 | 7336 | 40 | 40 | 0.50% | 0.55% | 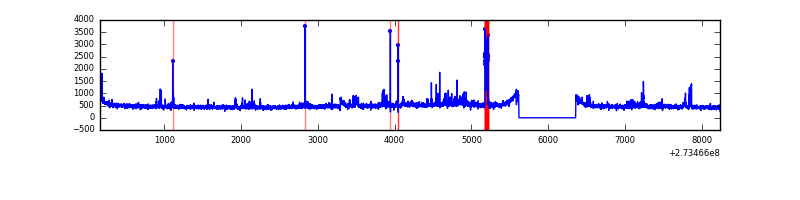 |
| C | 8075 | 7336 | 0 | 0 | 0.00% | 0.00% | 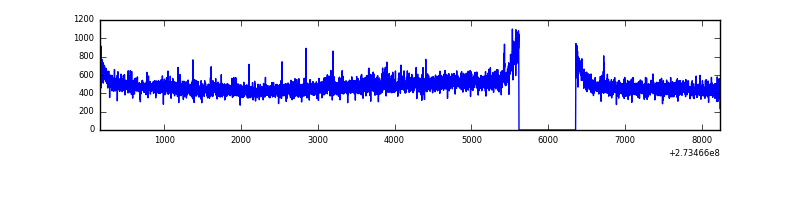 |
| D | 8075 | 7336 | 6 | 6 | 0.07% | 0.08% | 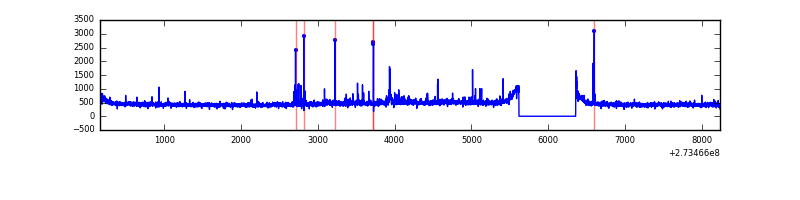 |
Top three noisy pixels from each quadrant. If the there are fewer than three noisy pixels in the level2.evt file, extra rows are filled as -1
| Pixel properties | Quadrant properties | ||||||
|---|---|---|---|---|---|---|---|
| Quadrant | DetID | PixID | Counts | Sigma | Mean | Median | Sigma |
| A | 9 | 143 | 171520 | 943.63 | 888 | 871 | 180.8 |
| A | 15 | 239 | 21522 | 114.19 | 888 | 871 | 180.8 |
| A | 0 | 226 | 7793 | 38.28 | 888 | 871 | 180.8 |
| B | 4 | 173 | 159725 | 939.5 | 886 | 864 | 169.1 |
| B | 3 | 209 | 34753 | 200.42 | 886 | 864 | 169.1 |
| B | 10 | 245 | 34302 | 197.75 | 886 | 864 | 169.1 |
| C | 14 | 238 | 131858 | 644.13 | 859 | 865 | 203.4 |
| C | 7 | 247 | 40806 | 196.4 | 859 | 865 | 203.4 |
| C | 13 | 61 | 6068 | 25.58 | 859 | 865 | 203.4 |
| D | 1 | 52 | 48312 | 220.99 | 873 | 849 | 214.8 |
| D | 2 | 152 | 36527 | 166.12 | 873 | 849 | 214.8 |
| D | 10 | 40 | 35425 | 160.99 | 873 | 849 | 214.8 |
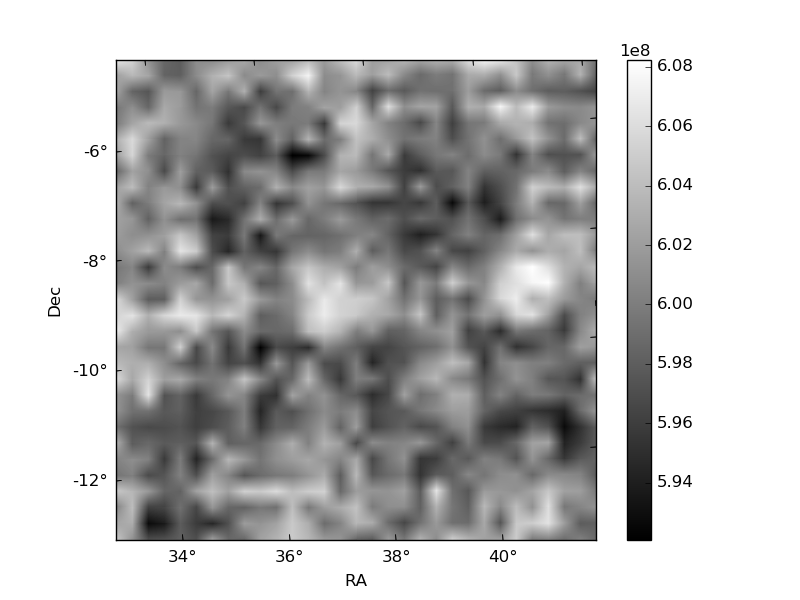
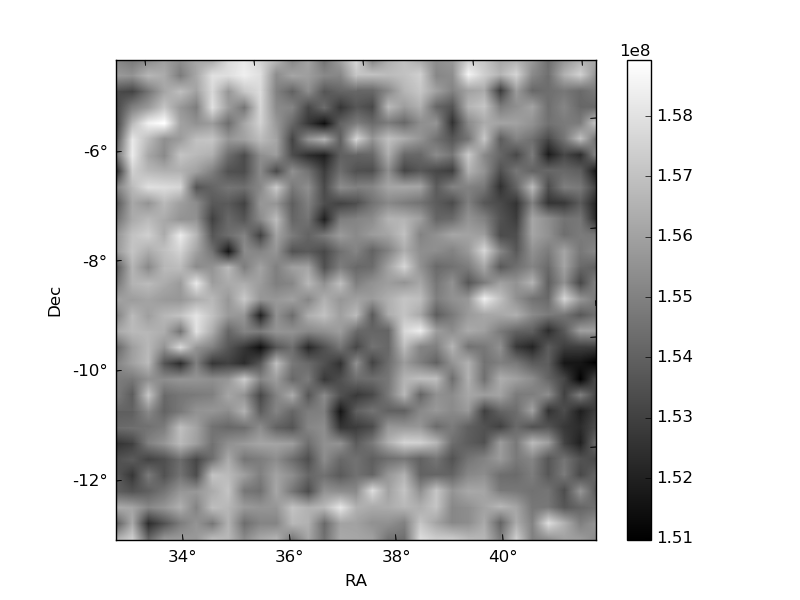
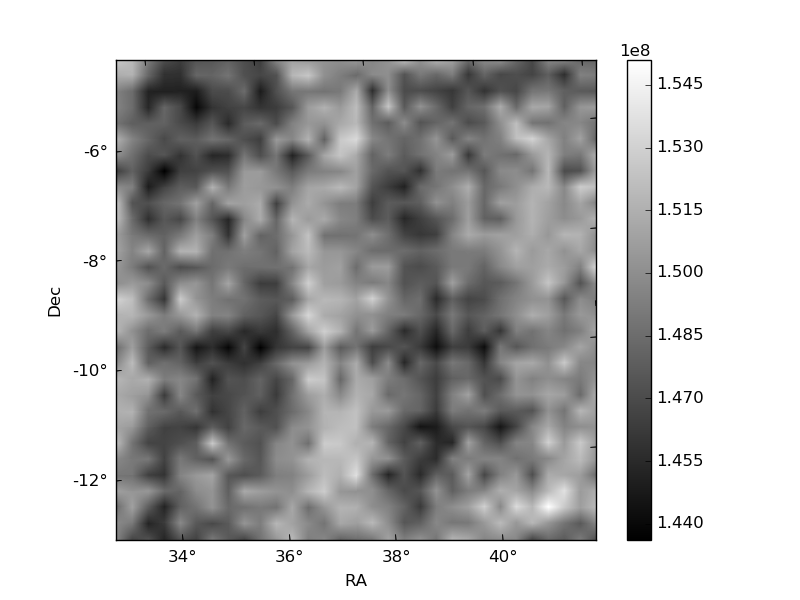
Histogram calculated using DETX and DETY for each event in the final _common_clean file
| Quadrant A | 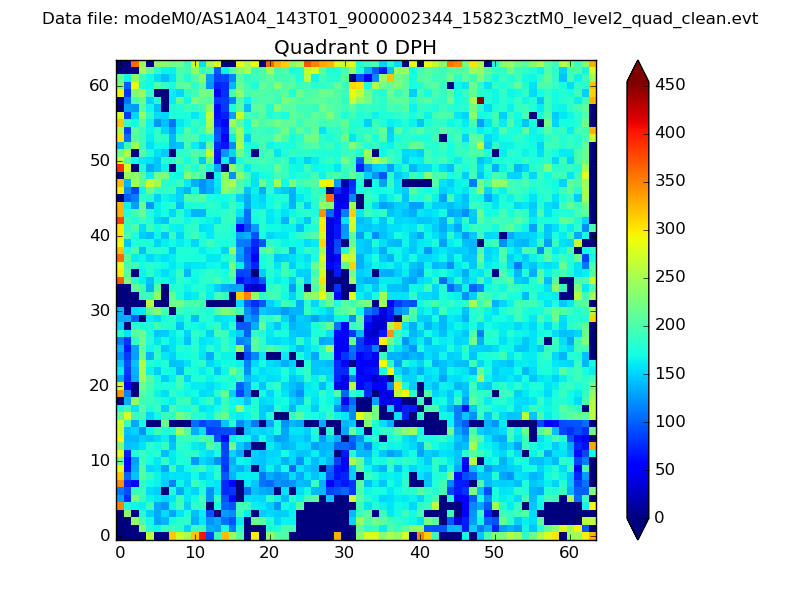 |
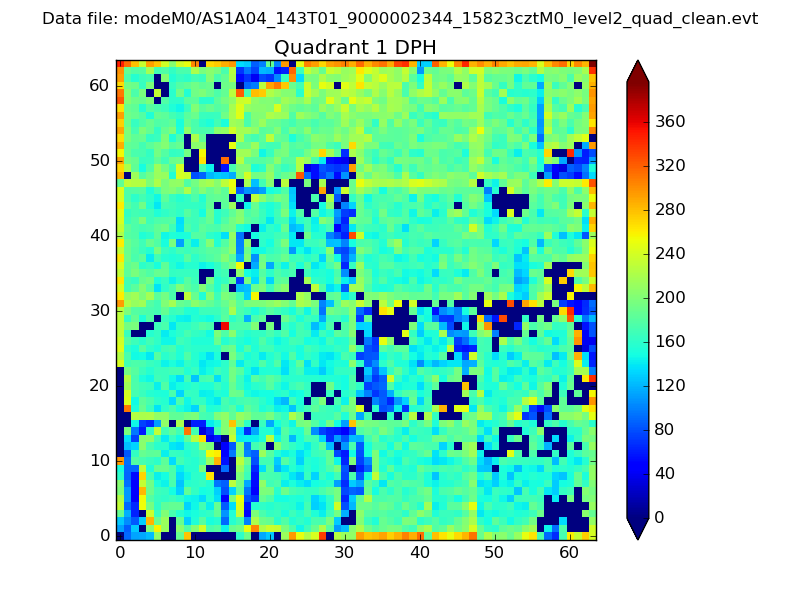 |
Quadrant B |
|---|---|---|---|
| Quadrant D | 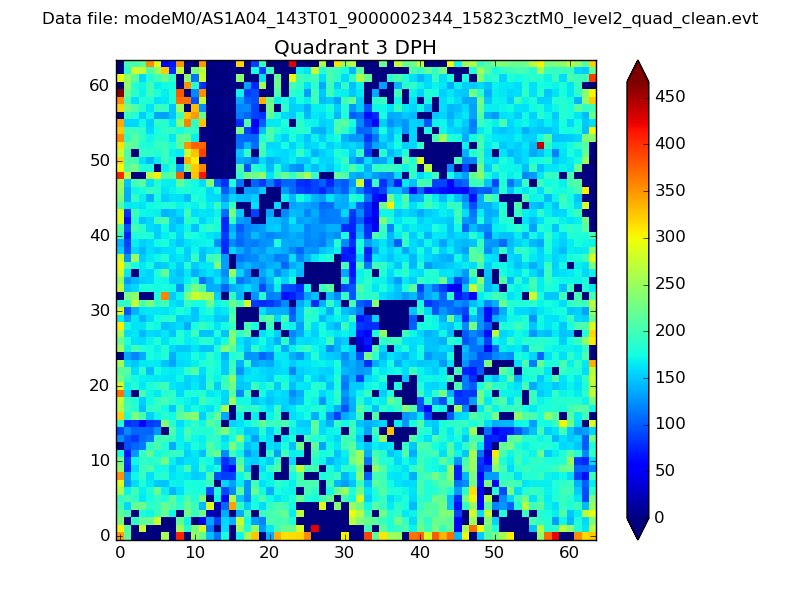 |
 |
Quadrant C |
| Plot type | Count rate plots | Images |
|---|---|---|
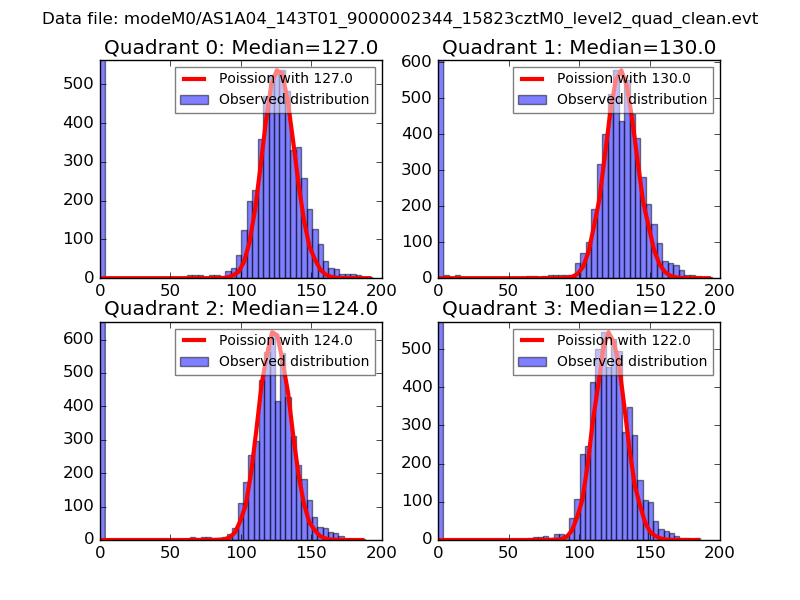
| Comparison with Poisson distribution Blue bars denote a histogram of data divided into 1 sec bins. Red curve is a Poisson curve with rate = median count rate of data. |
 |
 |
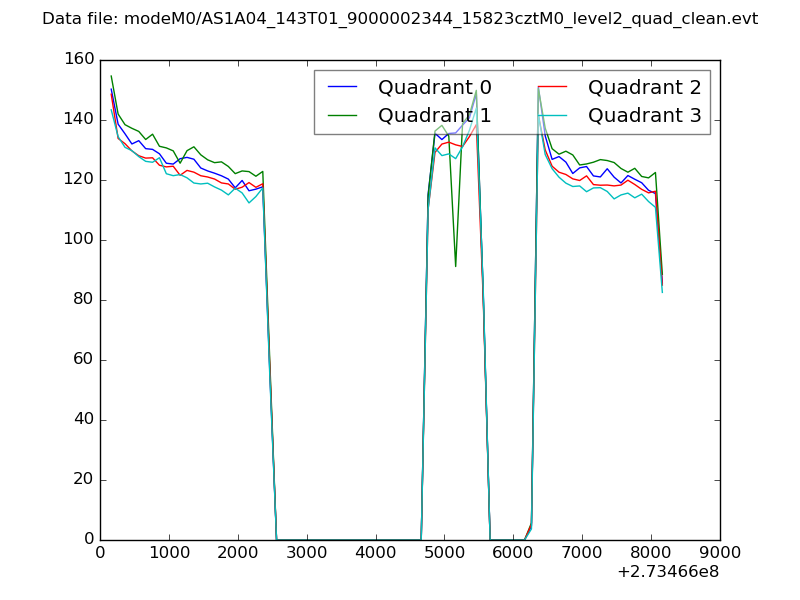
| Quadrant-wise count rates Data is divided into 100 sec bins |
 |
|
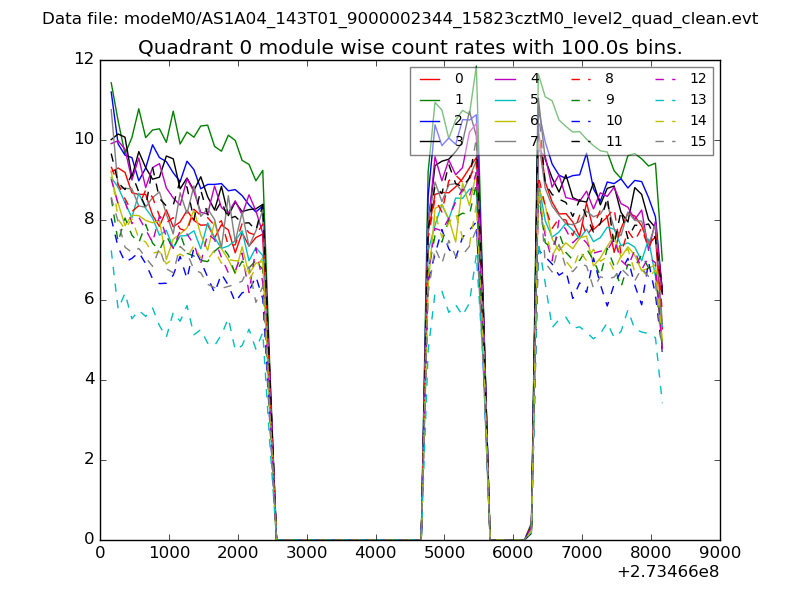
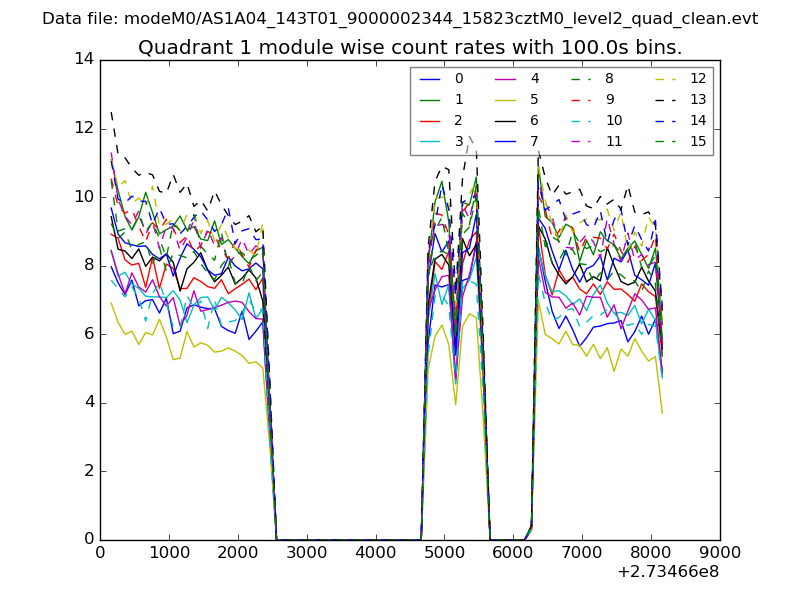
| Module-wise count rates for Quadrant A Data is divided into 100 sec bins |
 |
 |
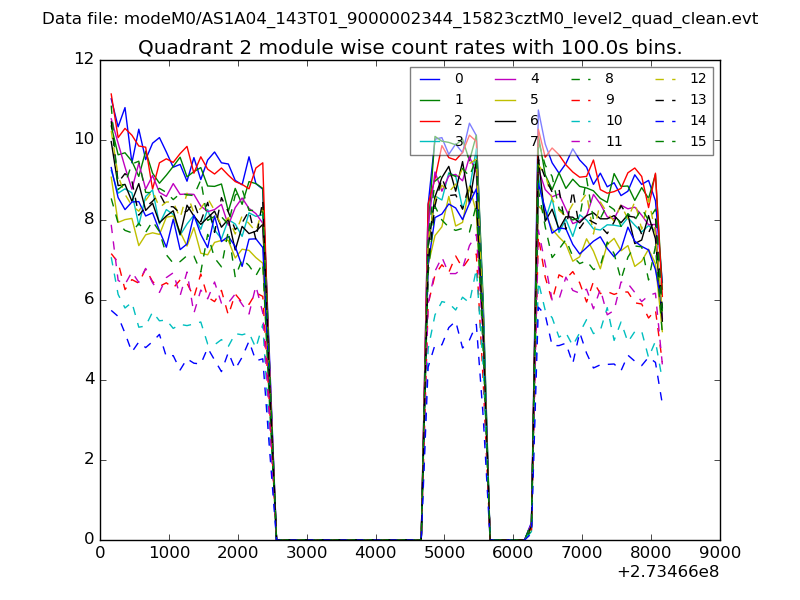
| Module-wise count rates for Quadrant B Data is divided into 100 sec bins |
 |
 |
| Module-wise count rates for Quadrant C Data is divided into 100 sec bins |
 |
 |
| Module-wise count rates for Quadrant D Data is divided into 100 sec bins |
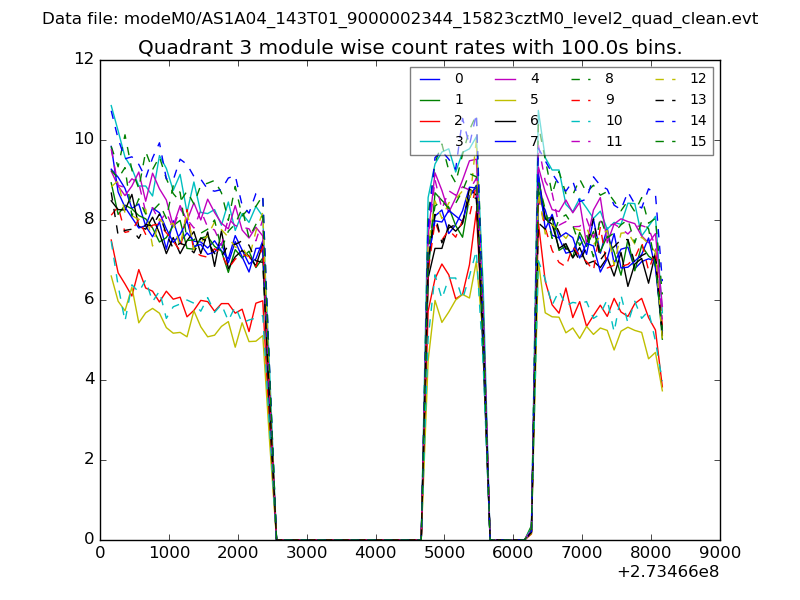 |
 |
| Parameter | Plot |
|---|---|
| CZT HV Monitor | 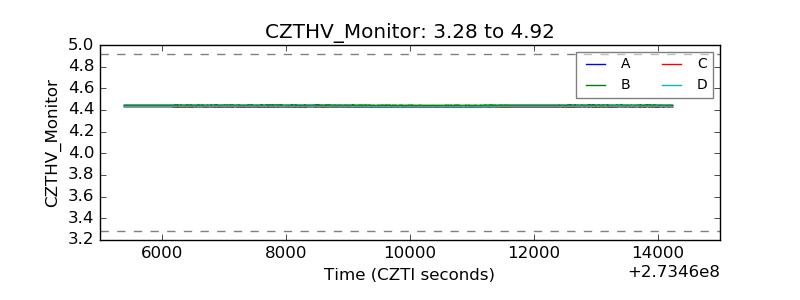 |
| D_VDD | 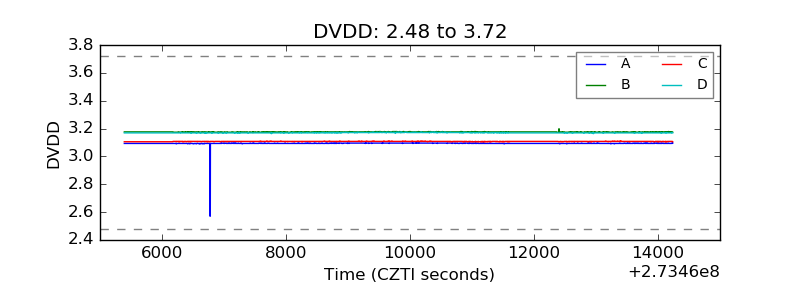 |
| Temperature 1 | 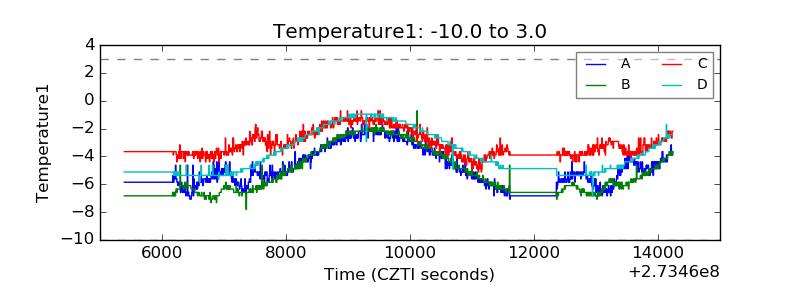 |
| Veto HV Monitor | 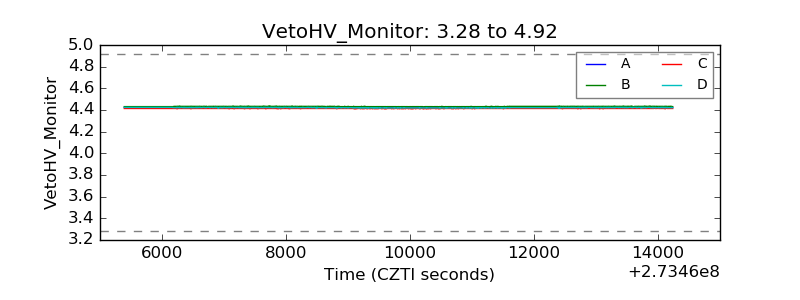 |
| Veto LLD | 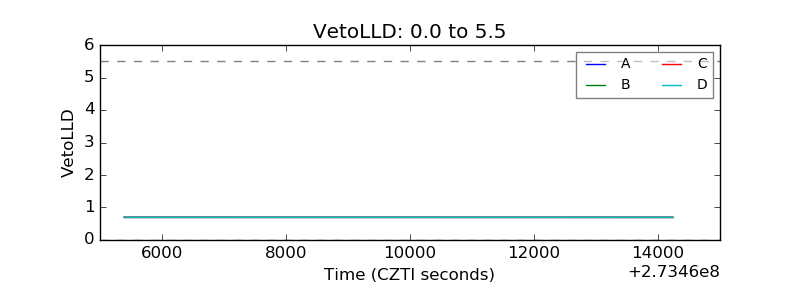 |
| Alpha Counter | 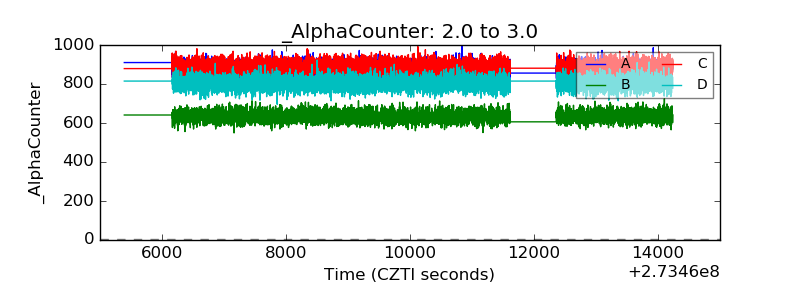 |
| _CPM_Rate | 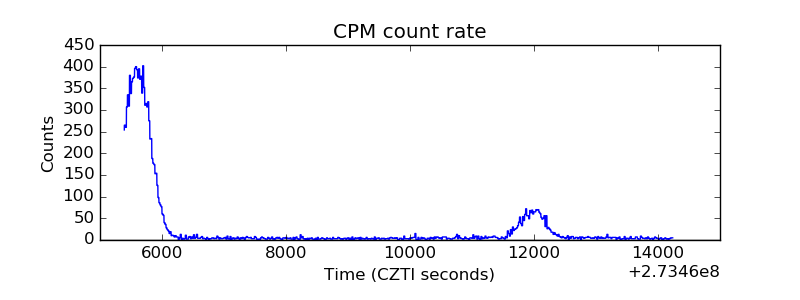 |
| CZT Counter |  |
| +2.5 Volts monitor |  |
| +5 Volts monitor |  |
| _ROLL_ROT | 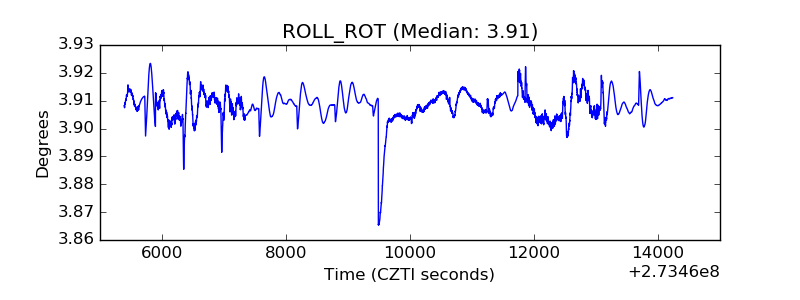 |
| _Roll_DEC | 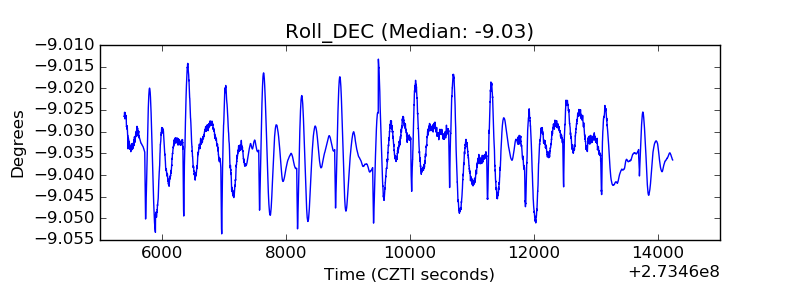 |
| _Roll_RA | 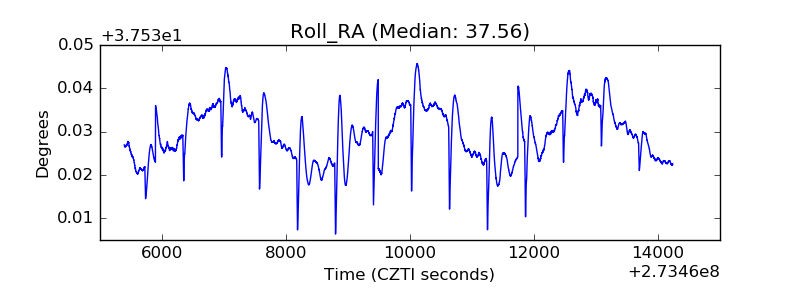 |
| Veto Counter | 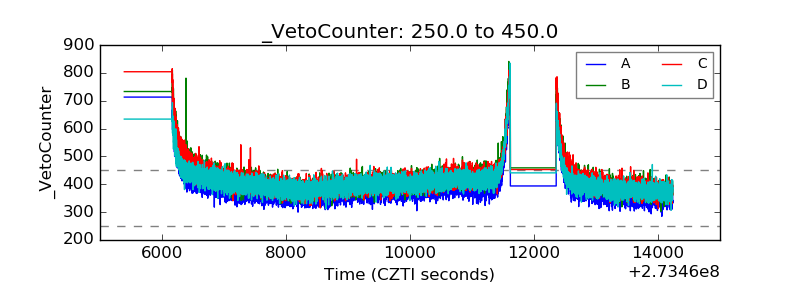 |