| Param | Original file | Final file |
|---|---|---|
| Filename | modeM0/AS1A04_143T01_9000002344_15824cztM0_level2.evt | modeM0/AS1A04_143T01_9000002344_15824cztM0_level2_quad_clean.evt |
| Size (bytes) | 406,261,440 | 76,518,720 |
| Size | 387.4 MB | 73.0 MB |
| Events in quadrant A | 2,855,361 | 480,163 |
| Events in quadrant B | 3,154,580 | 487,454 |
| Events in quadrant C | 3,056,339 | 464,719 |
| Events in quadrant D | 2,823,344 | 460,003 |
| Mode SS | |||
|---|---|---|---|
| Quadrant | BADHDUFLAG | Total packets | Discarded packets |
| A | 0 | 128 | 4 |
| B | 0 | 128 | 6 |
| C | 0 | 128 | 2 |
| D | 0 | 128 | 4 |
| Mode M0 | |||
|---|---|---|---|
| Quadrant | BADHDUFLAG | Total packets | Discarded packets |
| A | 0 | 12917 | 391 |
| B | 0 | 13710 | 423 |
| C | 0 | 13471 | 469 |
| D | 0 | 12952 | 404 |
| Mode M9 | |||
|---|---|---|---|
| Quadrant | BADHDUFLAG | Total packets | Discarded packets |
| A | 0 | 2 | 0 |
| B | 0 | 2 | 0 |
| C | 0 | 2 | 0 |
| D | 0 | 2 | 0 |
| Quadrant | Total seconds | Saturated seconds | Saturation percentage |
|---|---|---|---|
| A | 6086 | 161 | 2.645416% |
| B | 6081 | 224 | 3.683605% |
| C | 6060 | 195 | 3.217822% |
| D | 6079 | 146 | 2.401711% |
Noise dominated data is calculated using 1-second bins in cleaned event files. If a bin has >2000 counts, and if more than 50% of those come from <1% of pixels, then it is considered to be noise-dominated and hence unusable.
| Quadrant | # 1 sec bins | Bins with >0 counts | Bins with >2000 counts | High rate bins dominated by noise | Noise dominated (total time) | Noise dominated (detector-on time) | Marked lightcurve |
|---|---|---|---|---|---|---|---|
| A | 6492 | 6189 | 1 | 1 | 0.02% | 0.02% | 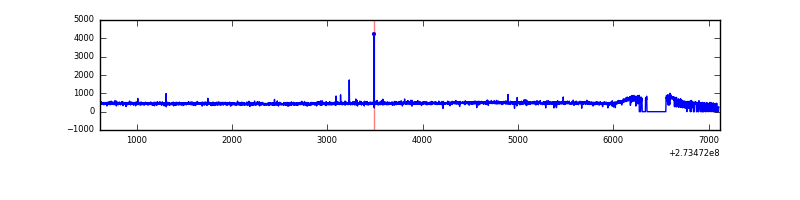 |
| B | 6501 | 6193 | 31 | 31 | 0.48% | 0.50% | 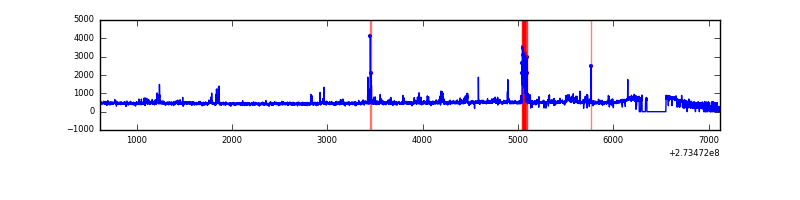 |
| C | 6505 | 6179 | 0 | 0 | 0.00% | 0.00% | 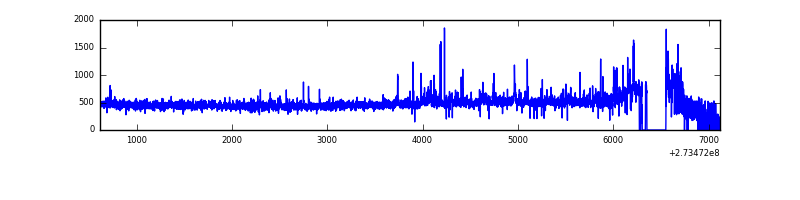 |
| D | 6497 | 6185 | 1 | 1 | 0.02% | 0.02% | 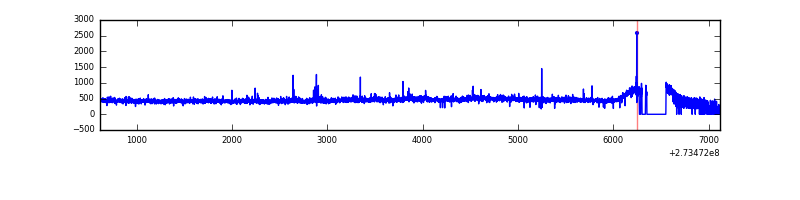 |
Top three noisy pixels from each quadrant. If the there are fewer than three noisy pixels in the level2.evt file, extra rows are filled as -1
| Pixel properties | Quadrant properties | ||||||
|---|---|---|---|---|---|---|---|
| Quadrant | DetID | PixID | Counts | Sigma | Mean | Median | Sigma |
| A | 15 | 239 | 12676 | 79.6 | 736 | 718 | 150.2 |
| A | 9 | 143 | 12661 | 79.5 | 736 | 718 | 150.2 |
| A | 0 | 226 | 6510 | 38.56 | 736 | 718 | 150.2 |
| B | 4 | 173 | 134310 | 937.97 | 733 | 713 | 142.4 |
| B | 10 | 245 | 61327 | 425.57 | 733 | 713 | 142.4 |
| B | 4 | 216 | 24560 | 167.43 | 733 | 713 | 142.4 |
| C | 7 | 247 | 190245 | 1147.17 | 705 | 709 | 165.2 |
| C | 14 | 238 | 106587 | 640.83 | 705 | 709 | 165.2 |
| C | 13 | 61 | 5058 | 26.32 | 705 | 709 | 165.2 |
| D | 1 | 52 | 45804 | 253.28 | 723 | 700 | 178.1 |
| D | 2 | 152 | 25515 | 139.35 | 723 | 700 | 178.1 |
| D | 2 | 234 | 24936 | 136.09 | 723 | 700 | 178.1 |
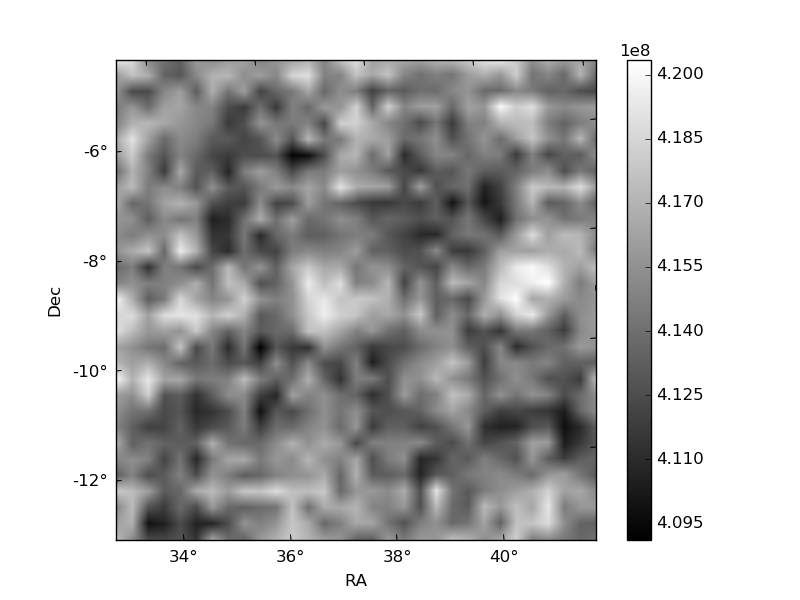
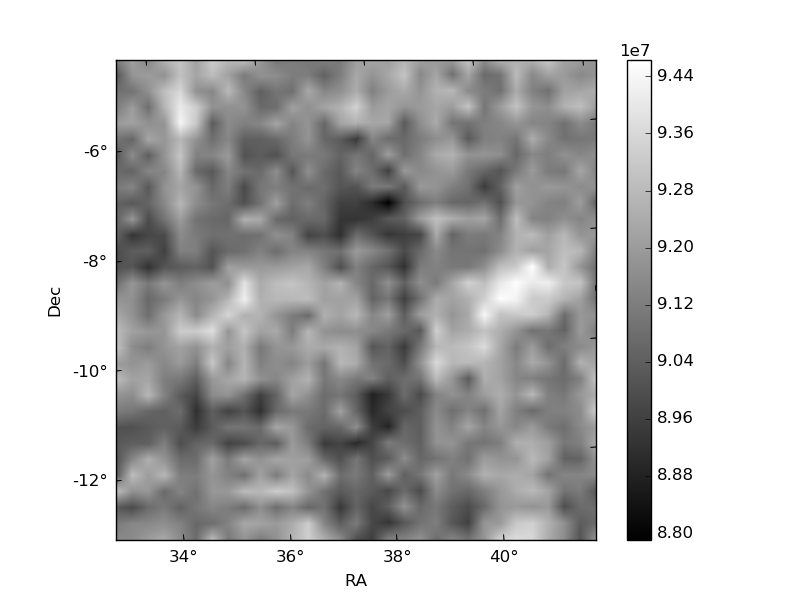
Histogram calculated using DETX and DETY for each event in the final _common_clean file
| Quadrant A | 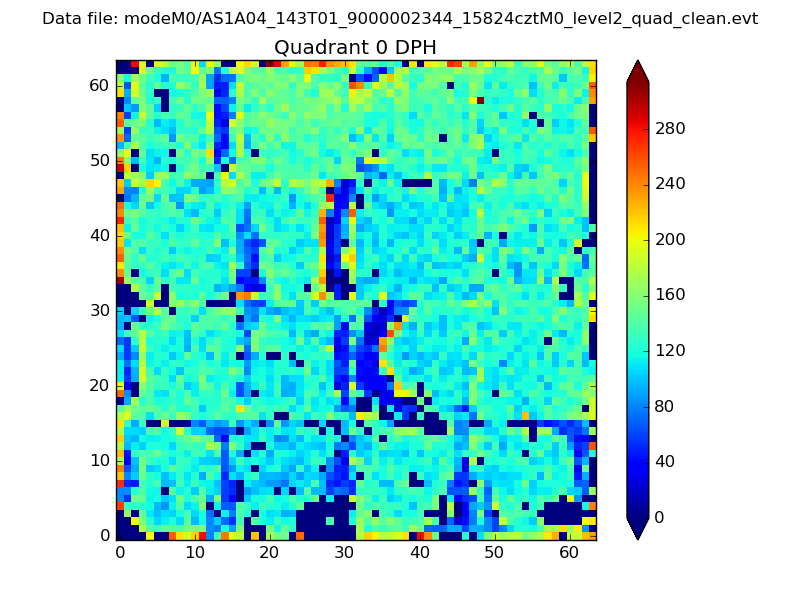 |
 |
Quadrant B |
|---|---|---|---|
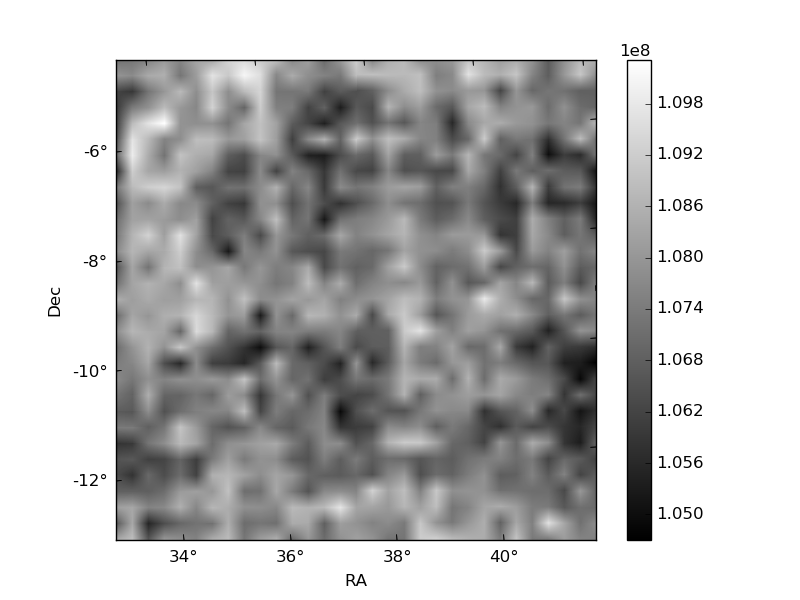
| Quadrant D | 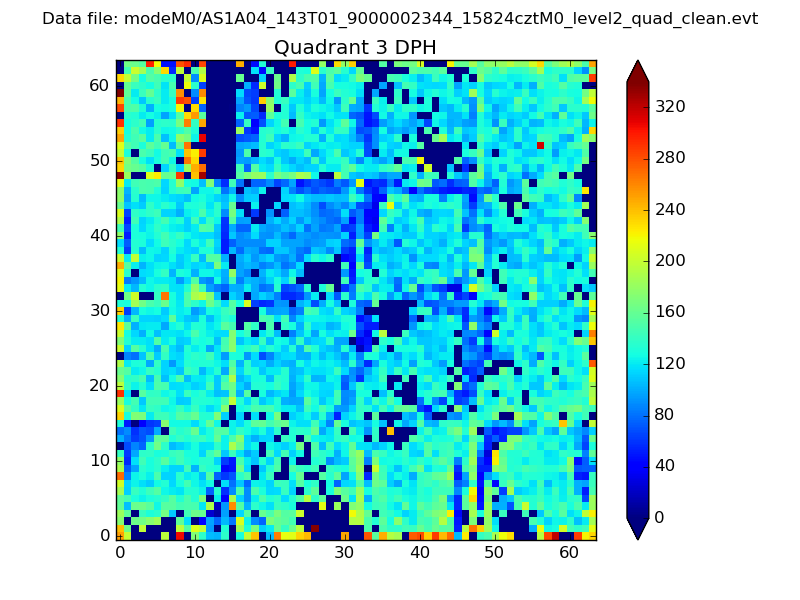 |
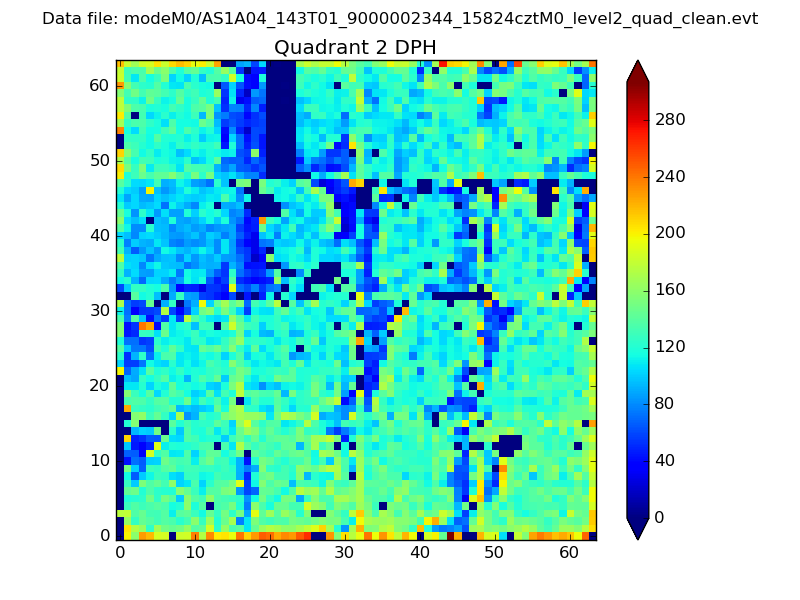 |
Quadrant C |
| Plot type | Count rate plots | Images |
|---|---|---|
| Comparison with Poisson distribution Blue bars denote a histogram of data divided into 1 sec bins. Red curve is a Poisson curve with rate = median count rate of data. |
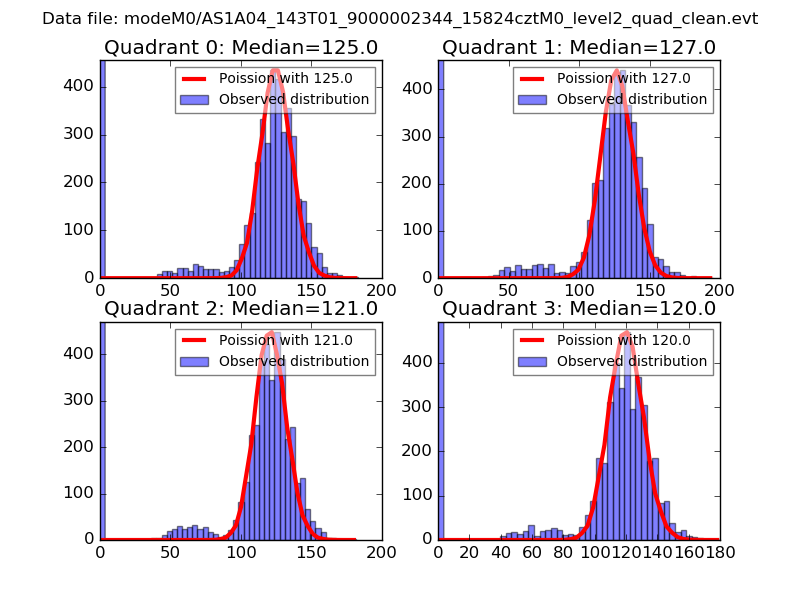 |
 |
| Quadrant-wise count rates Data is divided into 100 sec bins |
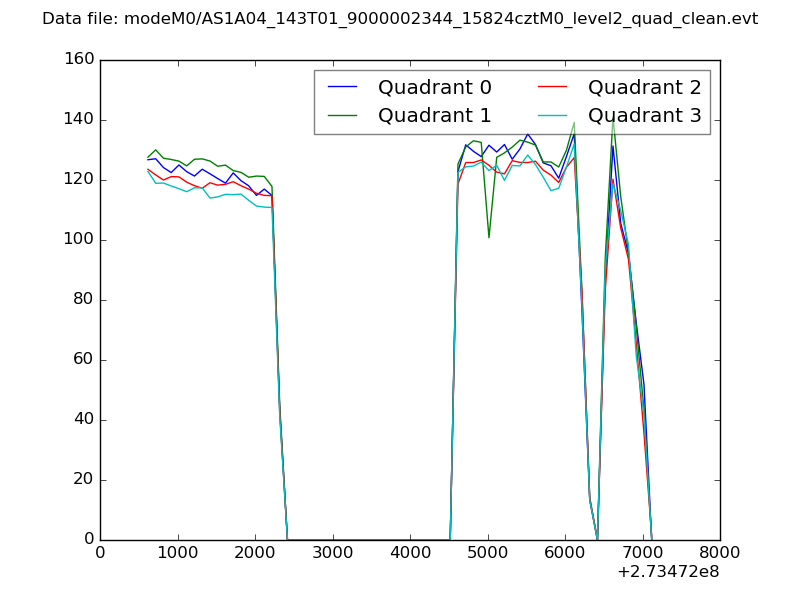 |
|
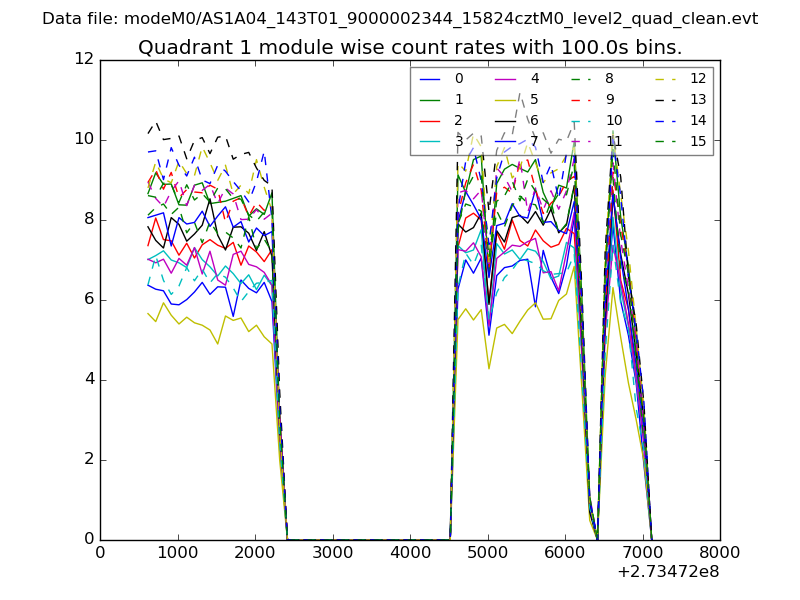
| Module-wise count rates for Quadrant A Data is divided into 100 sec bins |
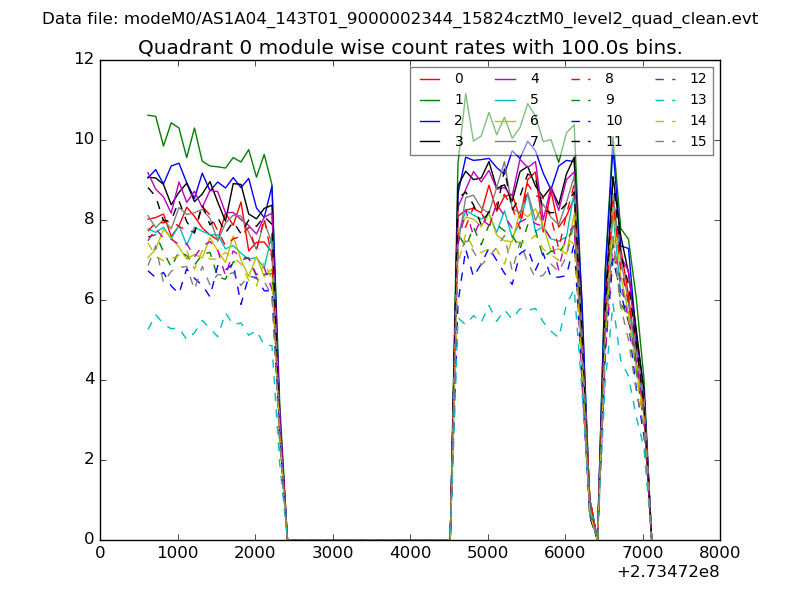 |
 |
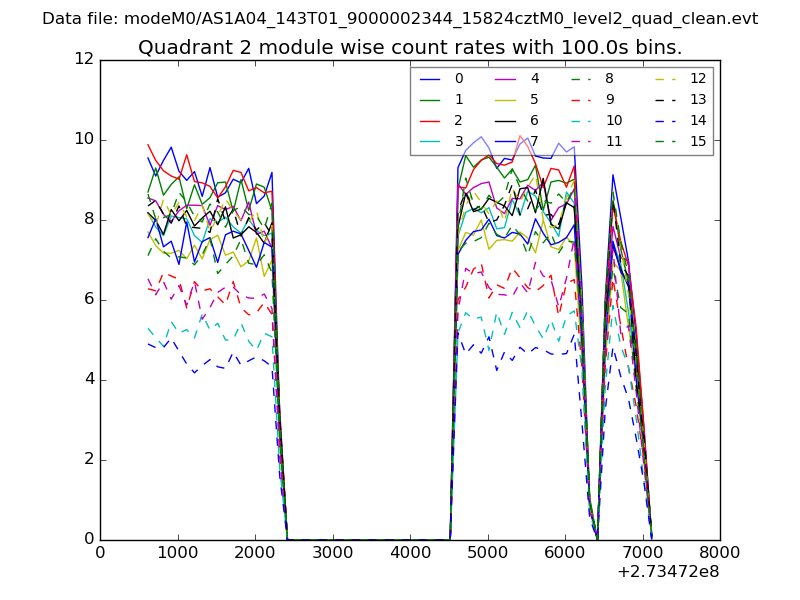
| Module-wise count rates for Quadrant B Data is divided into 100 sec bins |
 |
 |
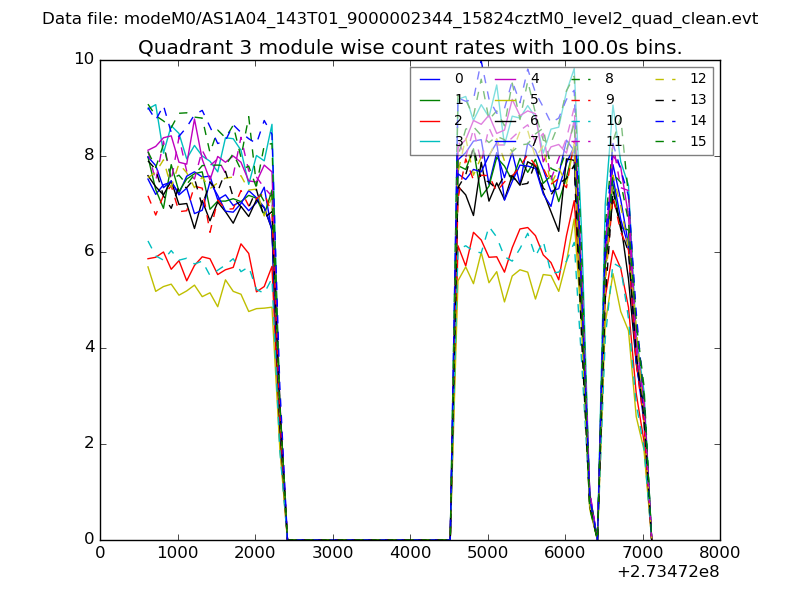
| Module-wise count rates for Quadrant C Data is divided into 100 sec bins |
 |
 |
| Module-wise count rates for Quadrant D Data is divided into 100 sec bins |
 |
 |
| Parameter | Plot |
|---|---|
| CZT HV Monitor | 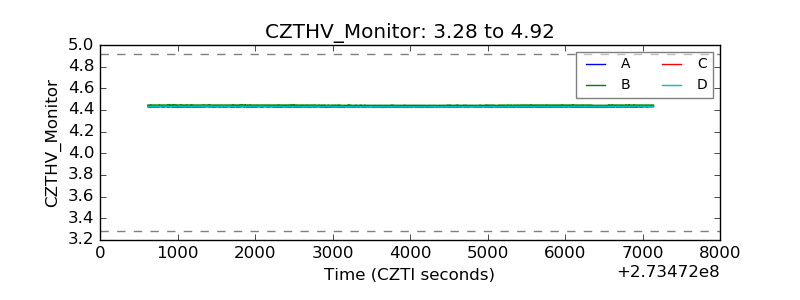 |
| D_VDD | 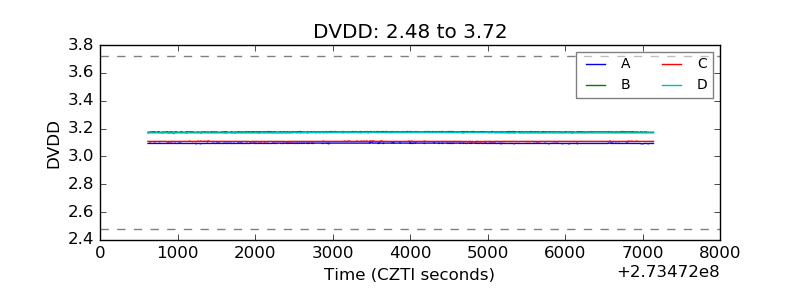 |
| Temperature 1 | 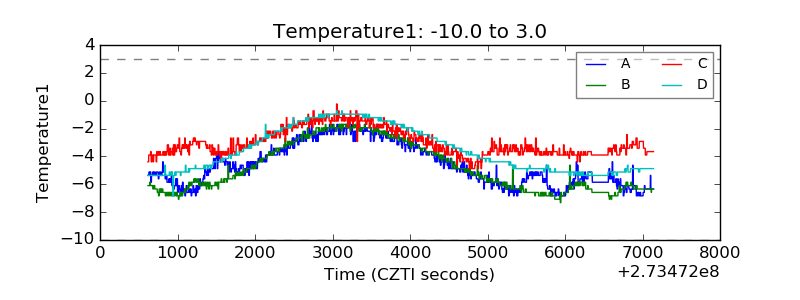 |
| Veto HV Monitor | 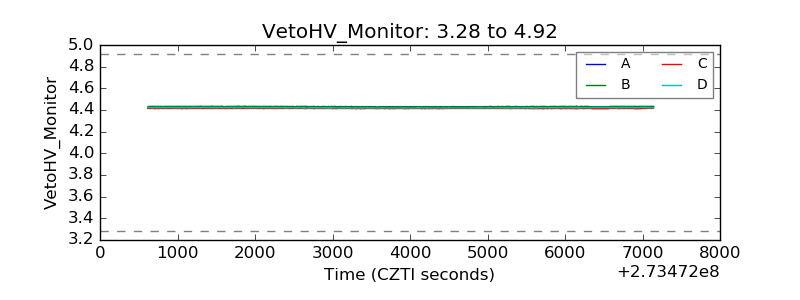 |
| Veto LLD | 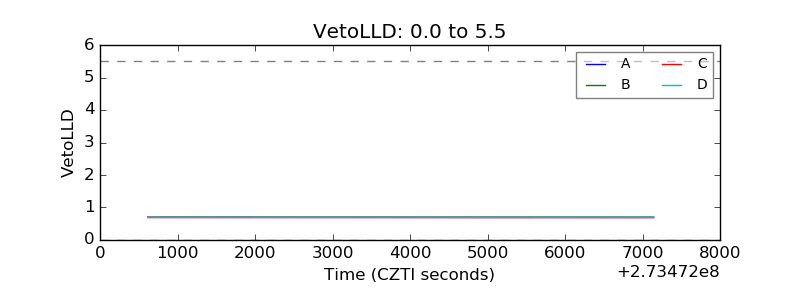 |
| Alpha Counter | 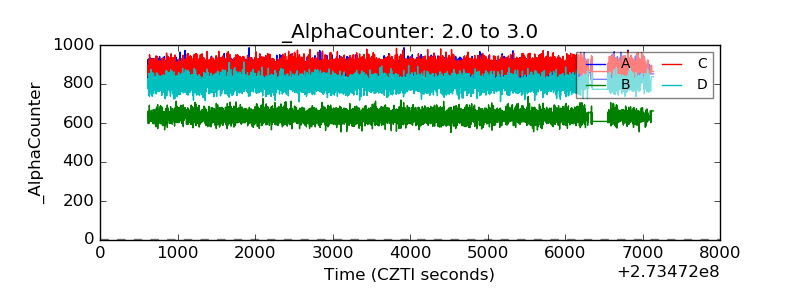 |
| _CPM_Rate | 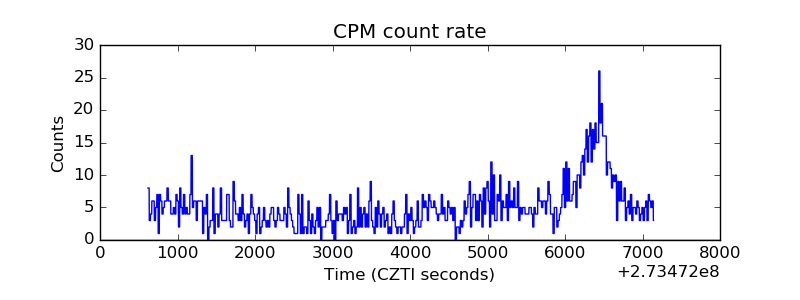 |
| CZT Counter | 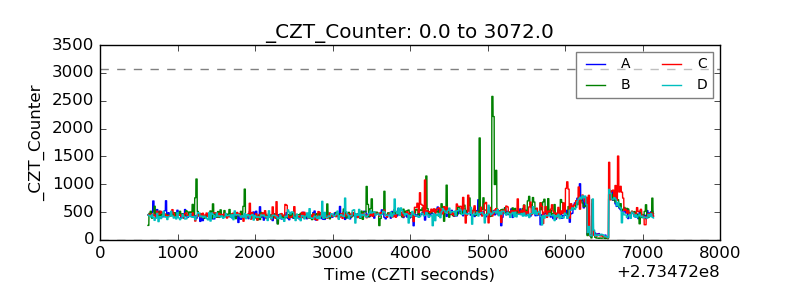 |
| +2.5 Volts monitor | 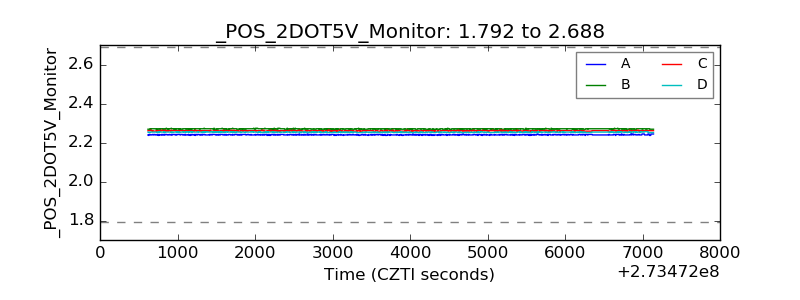 |
| +5 Volts monitor |  |
| _ROLL_ROT | 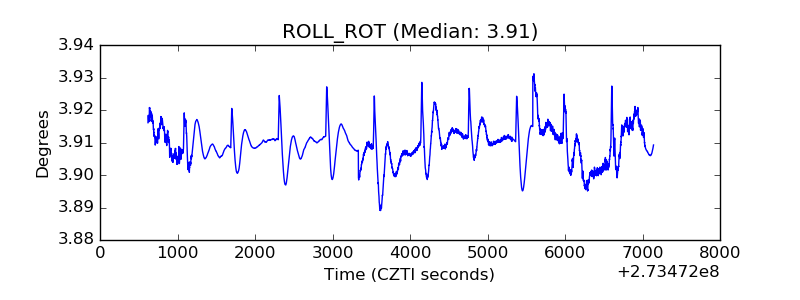 |
| _Roll_DEC | 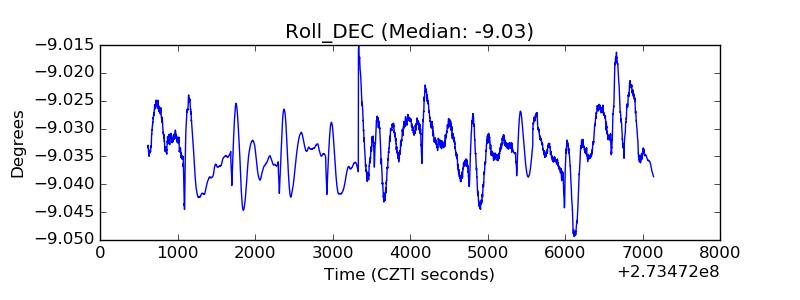 |
| _Roll_RA |  |
| Veto Counter | 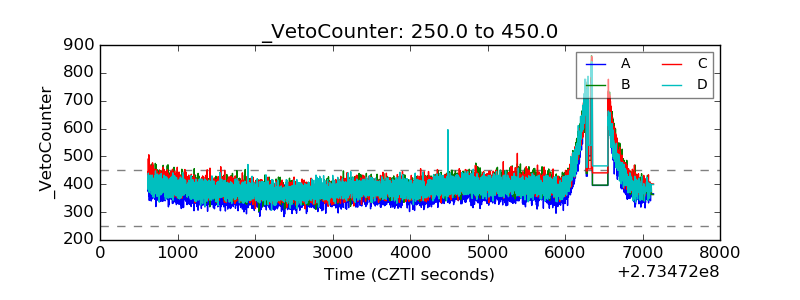 |