| Param | Original file | Final file |
|---|---|---|
| Filename | modeM0/AS1A04_143T01_9000002344_15825cztM0_level2.evt | modeM0/AS1A04_143T01_9000002344_15825cztM0_level2_quad_clean.evt |
| Size (bytes) | 454,838,400 | 81,276,480 |
| Size | 433.8 MB | 77.5 MB |
| Events in quadrant A | 3,052,734 | 509,117 |
| Events in quadrant B | 4,026,698 | 511,030 |
| Events in quadrant C | 3,145,455 | 501,661 |
| Events in quadrant D | 3,111,993 | 490,059 |
| Mode SS | |||
|---|---|---|---|
| Quadrant | BADHDUFLAG | Total packets | Discarded packets |
| A | 0 | 144 | 16 |
| B | 0 | 144 | 12 |
| C | 0 | 144 | 16 |
| D | 0 | 144 | 14 |
| Mode M0 | |||
|---|---|---|---|
| Quadrant | BADHDUFLAG | Total packets | Discarded packets |
| A | 0 | 14827 | 1460 |
| B | 0 | 17696 | 1634 |
| C | 0 | 14867 | 1400 |
| D | 0 | 14994 | 1497 |
| Quadrant | Total seconds | Saturated seconds | Saturation percentage |
|---|---|---|---|
| A | 6434 | 306 | 4.755984% |
| B | 6382 | 464 | 7.270448% |
| C | 6458 | 310 | 4.800248% |
| D | 6413 | 265 | 4.132231% |
Noise dominated data is calculated using 1-second bins in cleaned event files. If a bin has >2000 counts, and if more than 50% of those come from <1% of pixels, then it is considered to be noise-dominated and hence unusable.
| Quadrant | # 1 sec bins | Bins with >0 counts | Bins with >2000 counts | High rate bins dominated by noise | Noise dominated (total time) | Noise dominated (detector-on time) | Marked lightcurve |
|---|---|---|---|---|---|---|---|
| A | 7119 | 6744 | 0 | 0 | 0.00% | 0.00% | 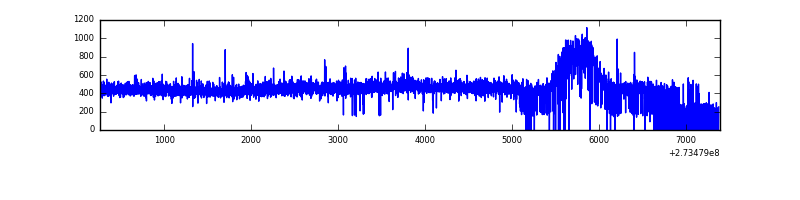 |
| B | 7133 | 6724 | 116 | 116 | 1.63% | 1.73% | 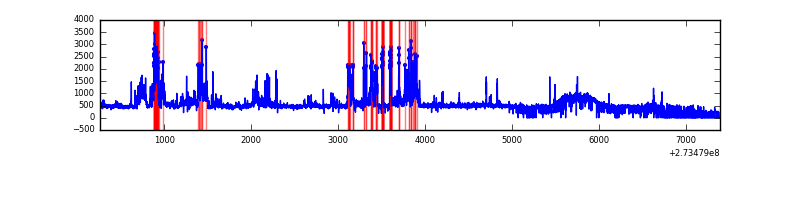 |
| C | 7125 | 6774 | 0 | 0 | 0.00% | 0.00% | 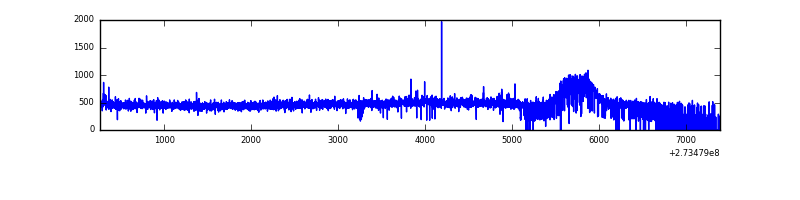 |
| D | 7118 | 6727 | 3 | 3 | 0.04% | 0.04% | 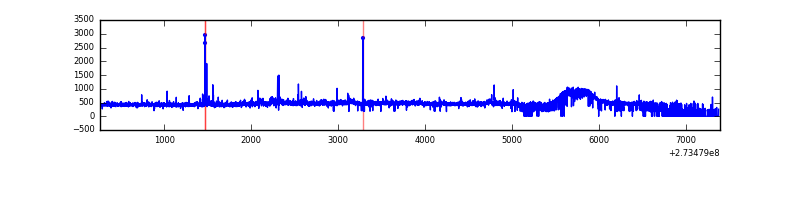 |
Top three noisy pixels from each quadrant. If the there are fewer than three noisy pixels in the level2.evt file, extra rows are filled as -1
| Pixel properties | Quadrant properties | ||||||
|---|---|---|---|---|---|---|---|
| Quadrant | DetID | PixID | Counts | Sigma | Mean | Median | Sigma |
| A | 9 | 143 | 7606 | 42.14 | 790 | 771 | 162.2 |
| A | 0 | 226 | 6952 | 38.11 | 790 | 771 | 162.2 |
| A | 15 | 239 | 6561 | 35.7 | 790 | 771 | 162.2 |
| B | 10 | 245 | 839760 | 5456.78 | 776 | 754 | 153.8 |
| B | 4 | 173 | 78445 | 505.29 | 776 | 754 | 153.8 |
| B | 4 | 216 | 34318 | 218.3 | 776 | 754 | 153.8 |
| C | 14 | 238 | 115688 | 636.21 | 763 | 767 | 180.6 |
| C | 3 | 233 | 33032 | 178.62 | 763 | 767 | 180.6 |
| C | 7 | 247 | 16267 | 85.81 | 763 | 767 | 180.6 |
| D | 1 | 52 | 90681 | 468.26 | 776 | 751 | 192.1 |
| D | 7 | 223 | 36910 | 188.28 | 776 | 751 | 192.1 |
| D | 2 | 234 | 26605 | 134.62 | 776 | 751 | 192.1 |
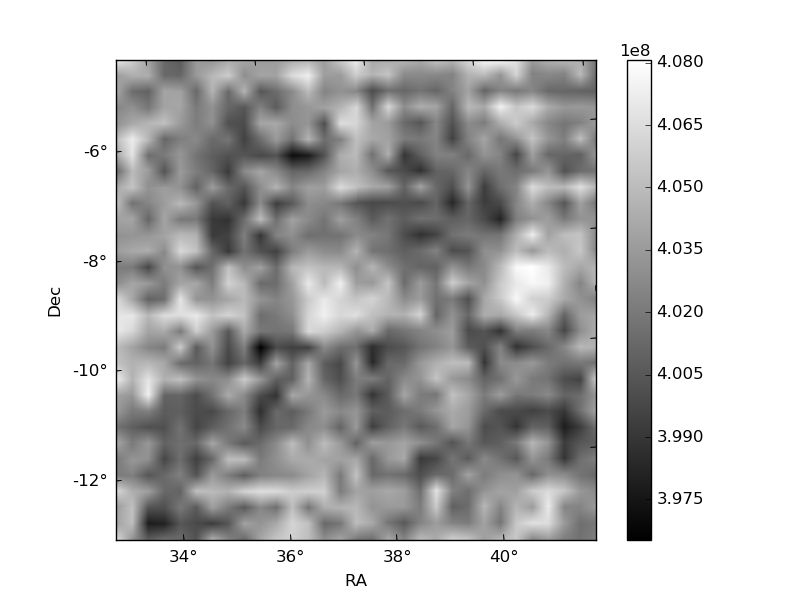
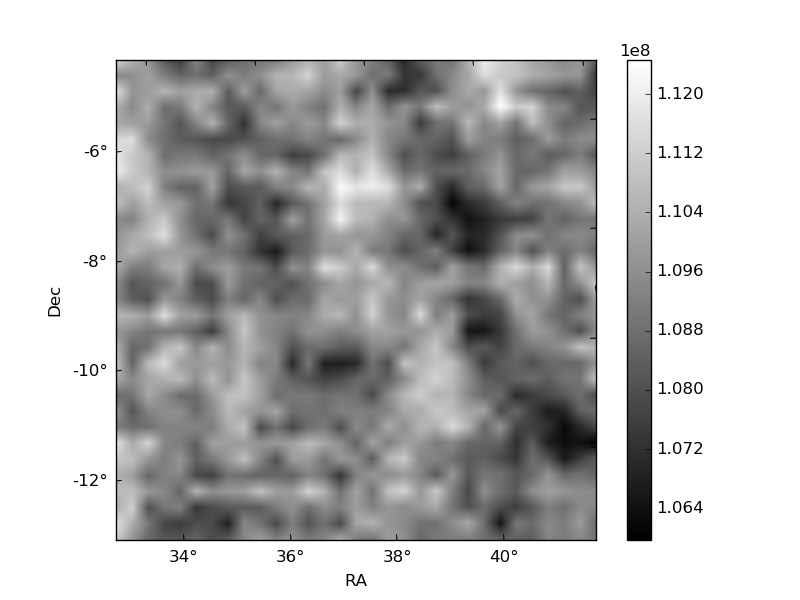
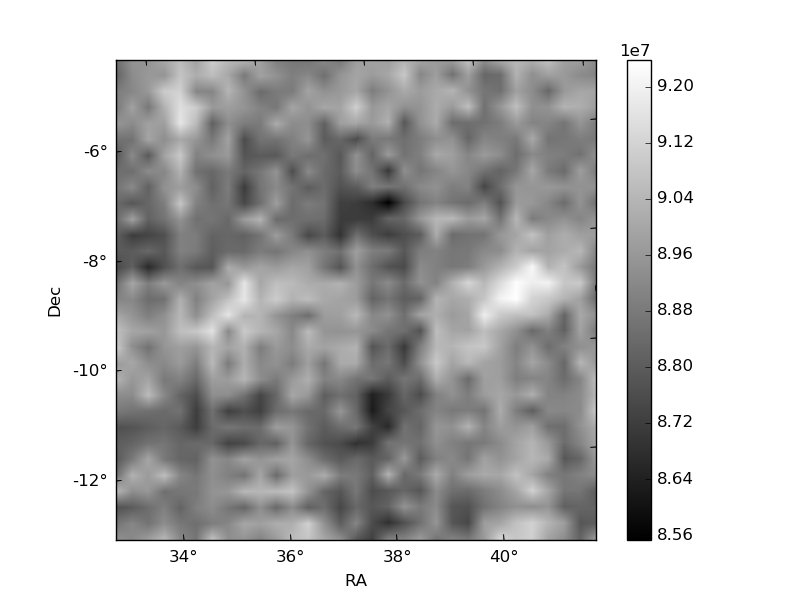
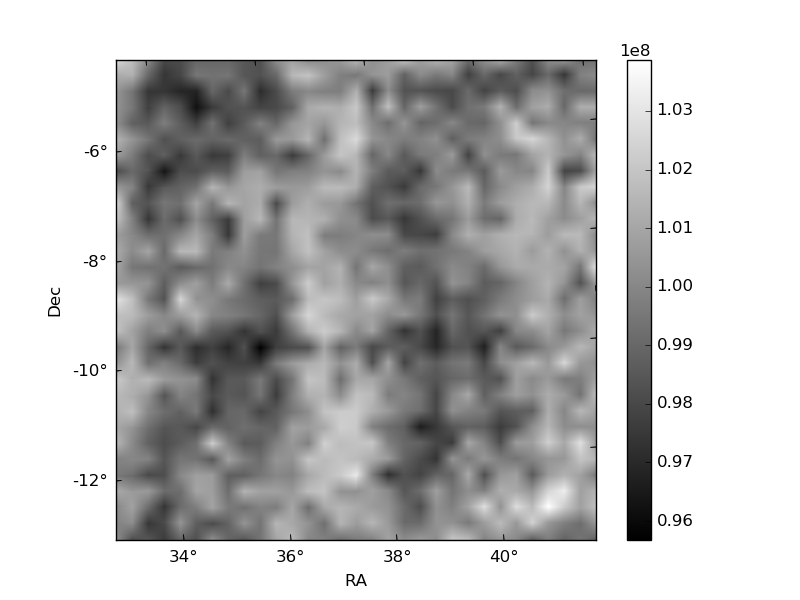
Histogram calculated using DETX and DETY for each event in the final _common_clean file
| Quadrant A | 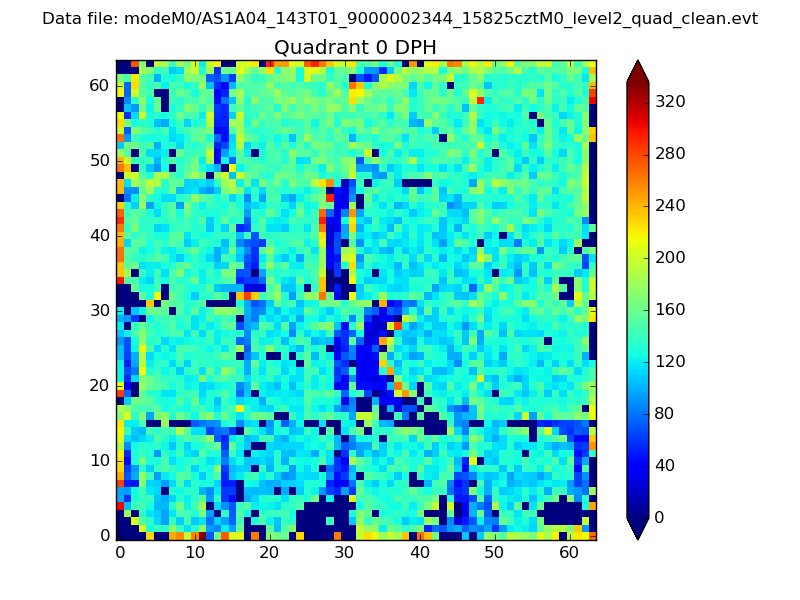 |
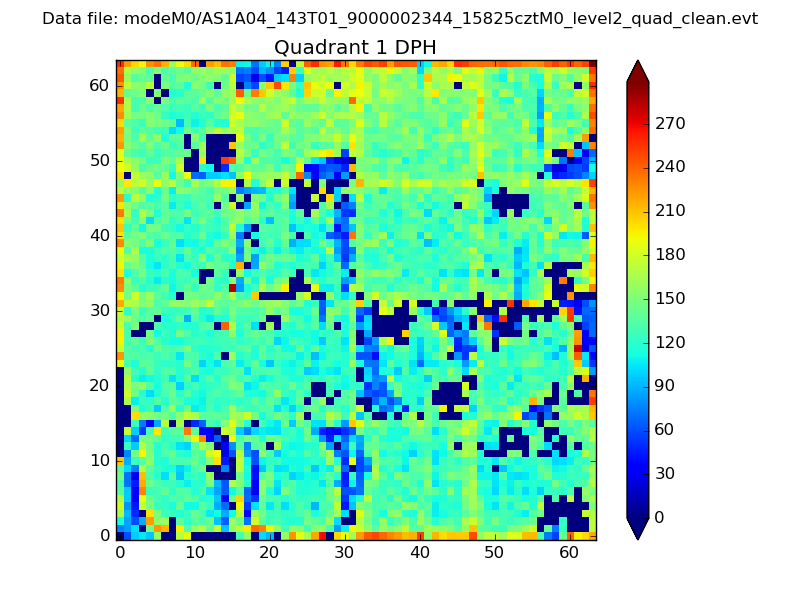 |
Quadrant B |
|---|---|---|---|
| Quadrant D | 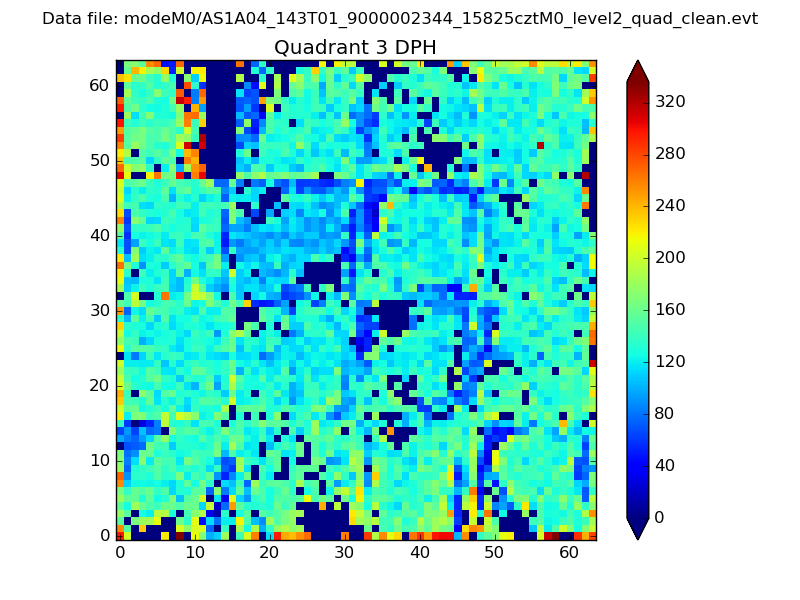 |
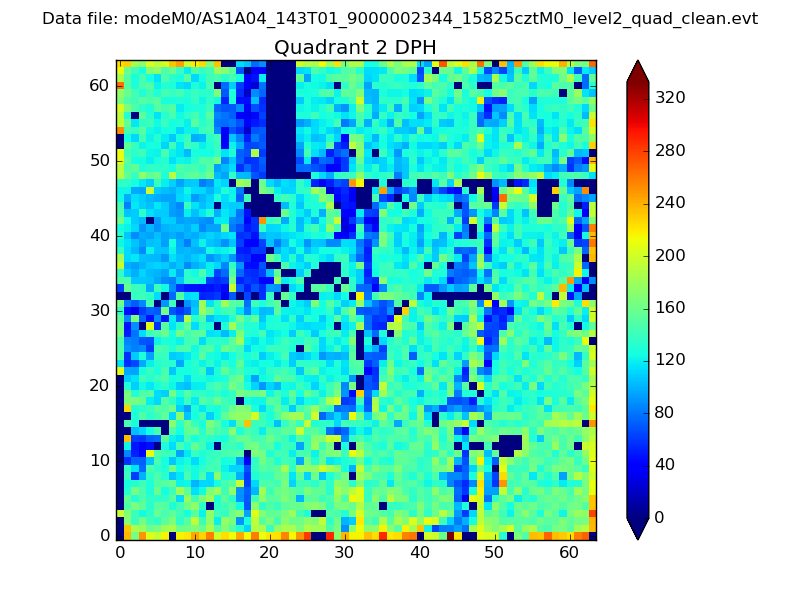 |
Quadrant C |
| Plot type | Count rate plots | Images |
|---|---|---|
| Comparison with Poisson distribution Blue bars denote a histogram of data divided into 1 sec bins. Red curve is a Poisson curve with rate = median count rate of data. |
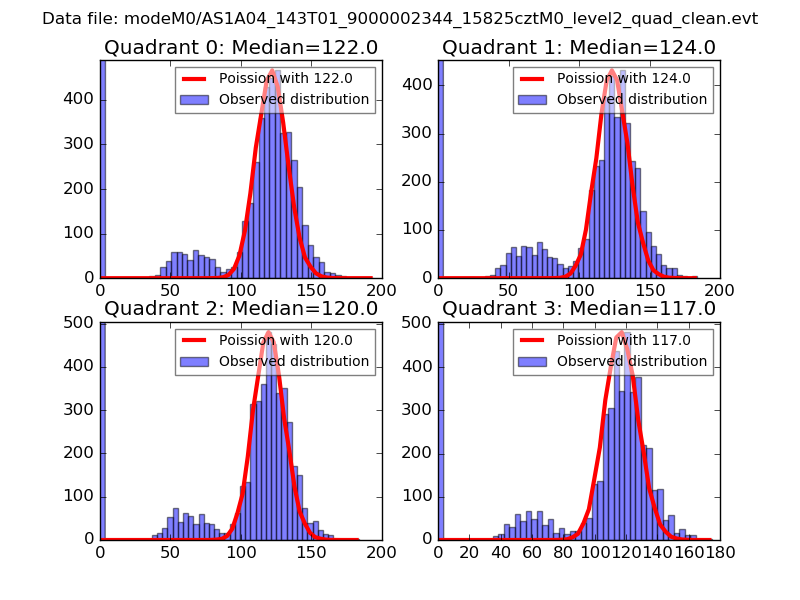 |
 |
| Quadrant-wise count rates Data is divided into 100 sec bins |
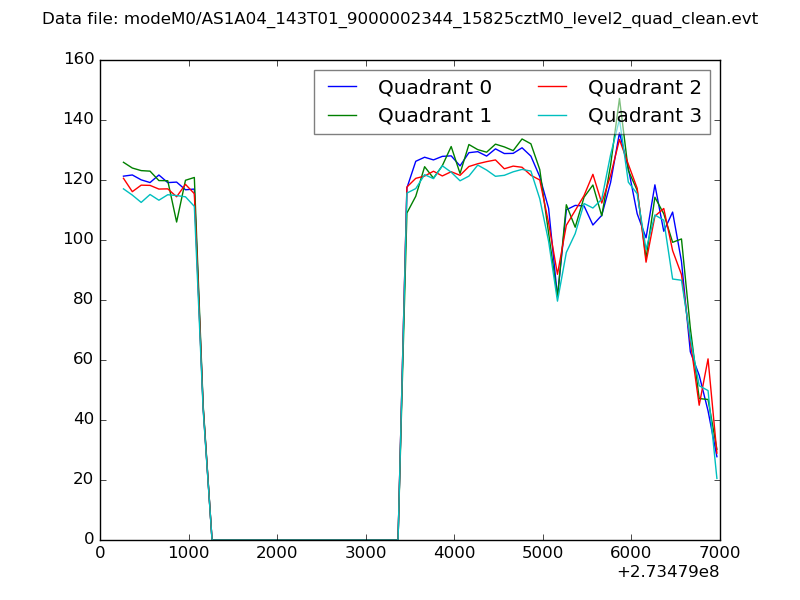 |
|
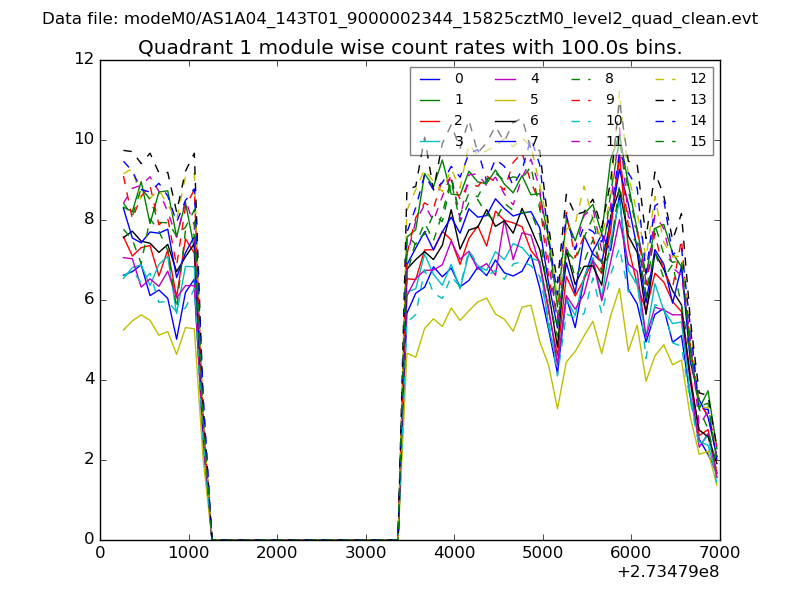
| Module-wise count rates for Quadrant A Data is divided into 100 sec bins |
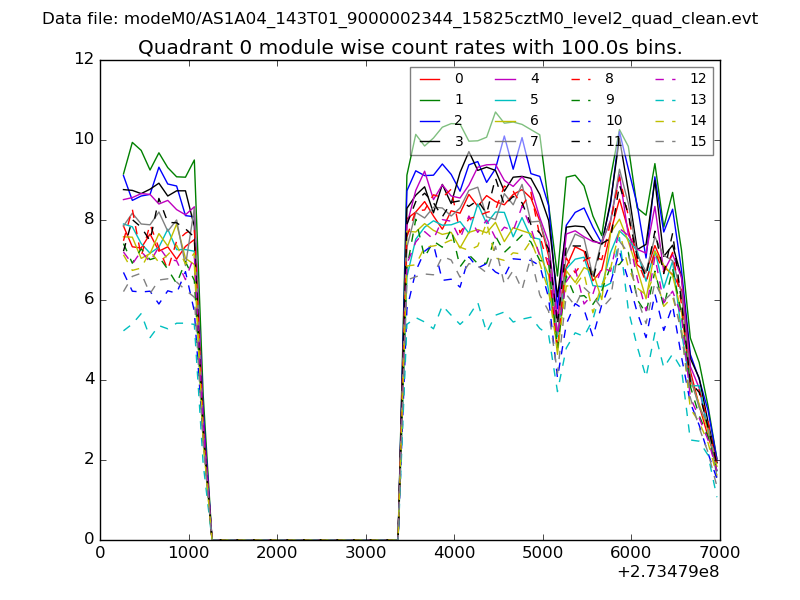 |
 |
| Module-wise count rates for Quadrant B Data is divided into 100 sec bins |
 |
 |
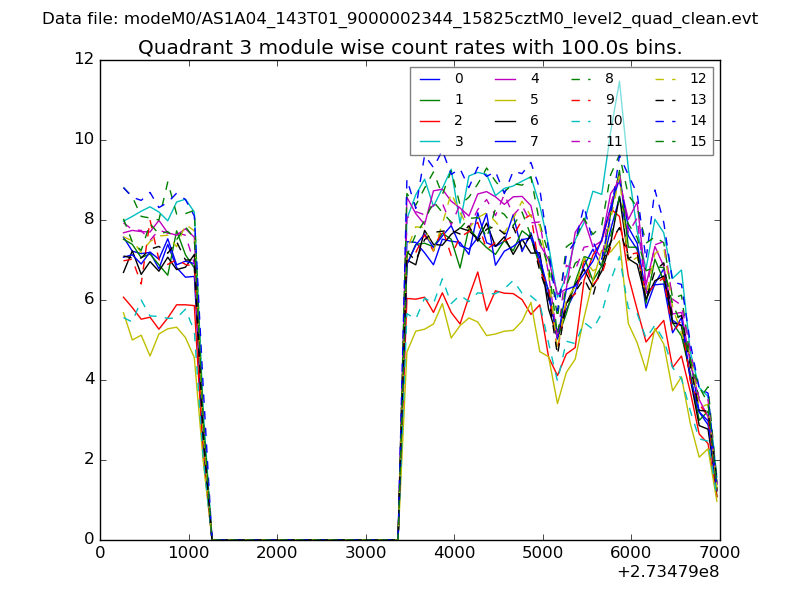
| Module-wise count rates for Quadrant C Data is divided into 100 sec bins |
 |
 |
| Module-wise count rates for Quadrant D Data is divided into 100 sec bins |
 |
 |
| Parameter | Plot |
|---|---|
| CZT HV Monitor | 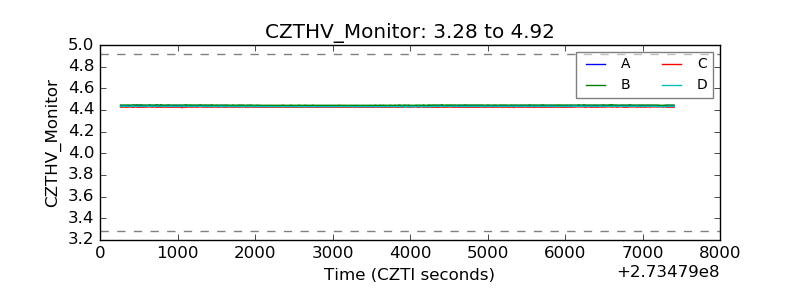 |
| D_VDD |  |
| Temperature 1 | 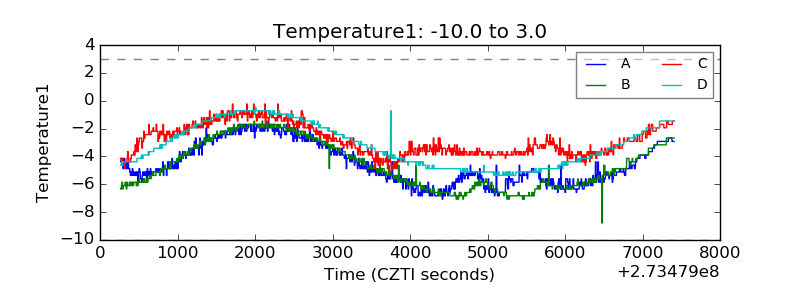 |
| Veto HV Monitor | 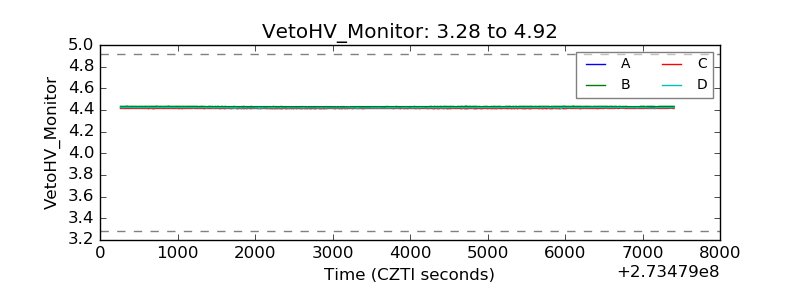 |
| Veto LLD | 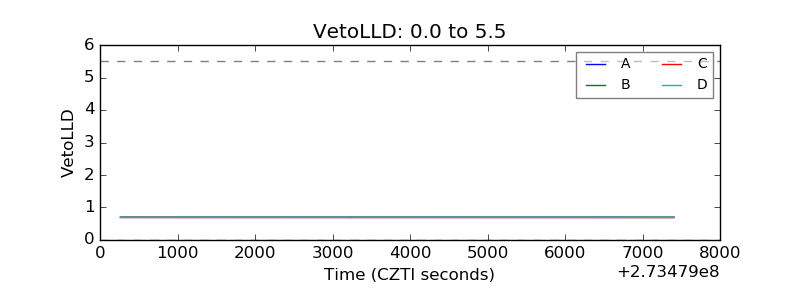 |
| Alpha Counter | 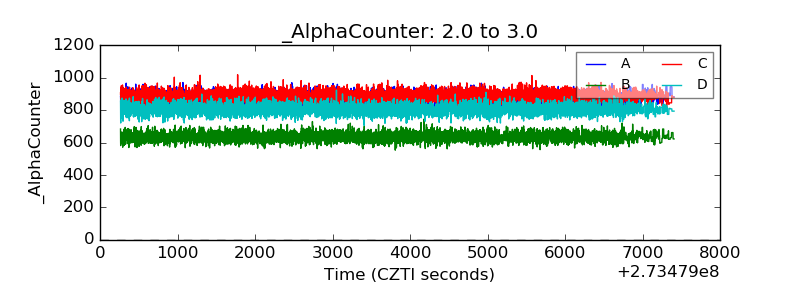 |
| _CPM_Rate | 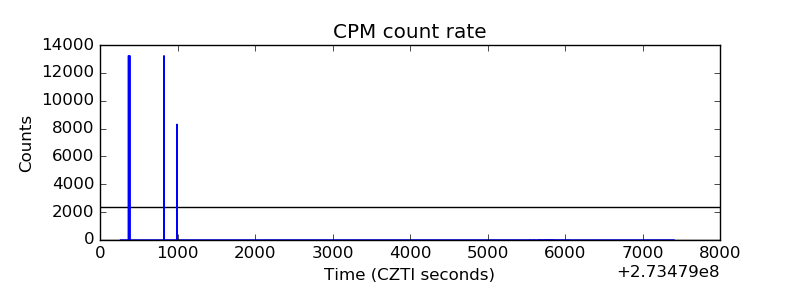 |
| CZT Counter | 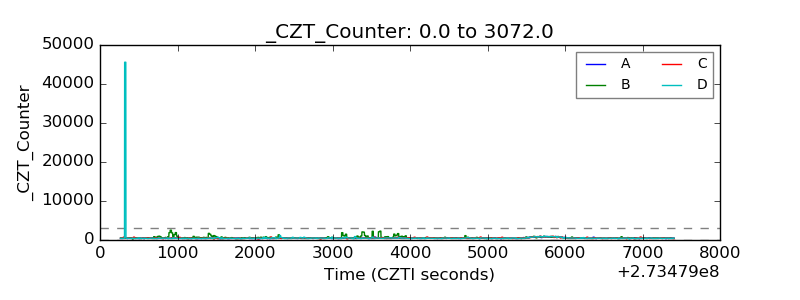 |
| +2.5 Volts monitor |  |
| +5 Volts monitor |  |
| _ROLL_ROT | 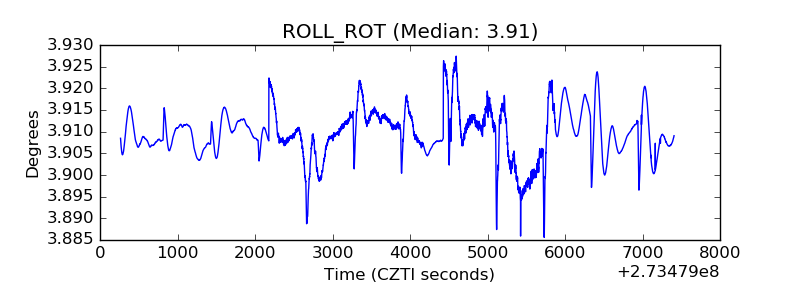 |
| _Roll_DEC | 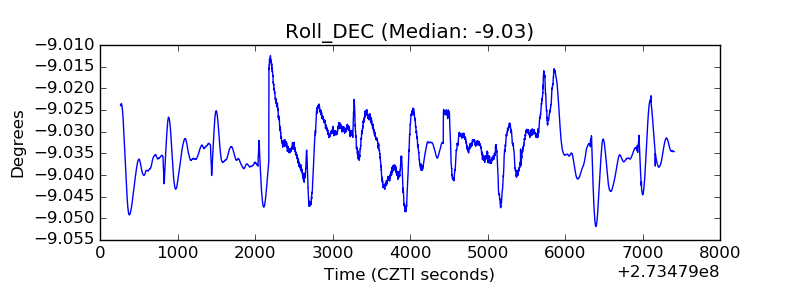 |
| _Roll_RA | 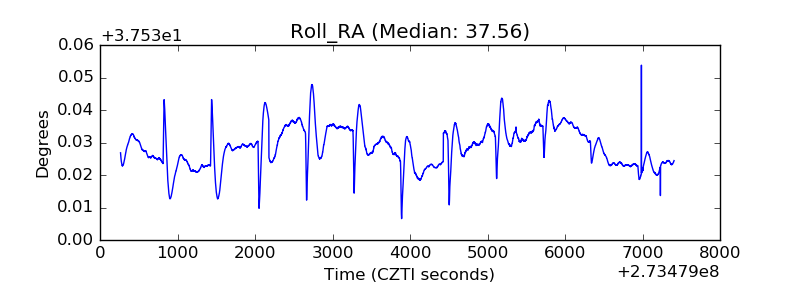 |
| Veto Counter | 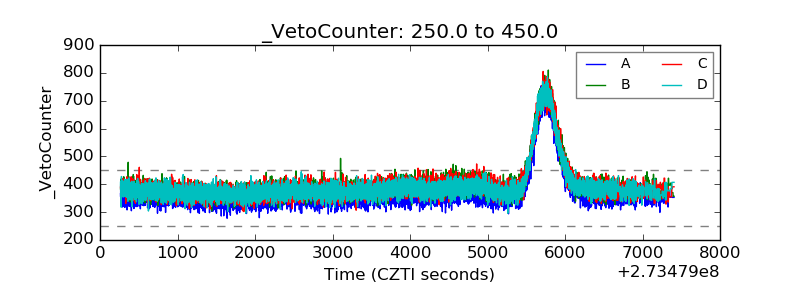 |