| Param | Original file | Final file |
|---|---|---|
| Filename | modeM0/AS1A04_143T01_9000002344_15828cztM0_level2.evt | modeM0/AS1A04_143T01_9000002344_15828cztM0_level2_quad_clean.evt |
| Size (bytes) | 784,353,600 | 136,782,720 |
| Size | 748.0 MB | 130.4 MB |
| Events in quadrant A | 5,490,823 | 848,040 |
| Events in quadrant B | 5,907,481 | 860,383 |
| Events in quadrant C | 5,630,225 | 821,075 |
| Events in quadrant D | 5,937,930 | 808,177 |
| Mode SS | |||
|---|---|---|---|
| Quadrant | BADHDUFLAG | Total packets | Discarded packets |
| A | 0 | 238 | 0 |
| B | 0 | 238 | 0 |
| C | 0 | 238 | 0 |
| D | 0 | 238 | 0 |
| Mode M0 | |||
|---|---|---|---|
| Quadrant | BADHDUFLAG | Total packets | Discarded packets |
| A | 0 | 24162 | 4 |
| B | 0 | 24992 | 3 |
| C | 0 | 24040 | 3 |
| D | 0 | 25368 | 3 |
| Mode M9 | |||
|---|---|---|---|
| Quadrant | BADHDUFLAG | Total packets | Discarded packets |
| A | 0 | 12 | 0 |
| B | 0 | 12 | 0 |
| C | 0 | 12 | 0 |
| D | 0 | 13 | 0 |
| Quadrant | Total seconds | Saturated seconds | Saturation percentage |
|---|---|---|---|
| A | 11623 | 225 | 1.935817% |
| B | 11623 | 246 | 2.116493% |
| C | 11623 | 223 | 1.918610% |
| D | 11623 | 199 | 1.712123% |
Noise dominated data is calculated using 1-second bins in cleaned event files. If a bin has >2000 counts, and if more than 50% of those come from <1% of pixels, then it is considered to be noise-dominated and hence unusable.
| Quadrant | # 1 sec bins | Bins with >0 counts | Bins with >2000 counts | High rate bins dominated by noise | Noise dominated (total time) | Noise dominated (detector-on time) | Marked lightcurve |
|---|---|---|---|---|---|---|---|
| A | 12884 | 11624 | 13 | 13 | 0.10% | 0.11% | 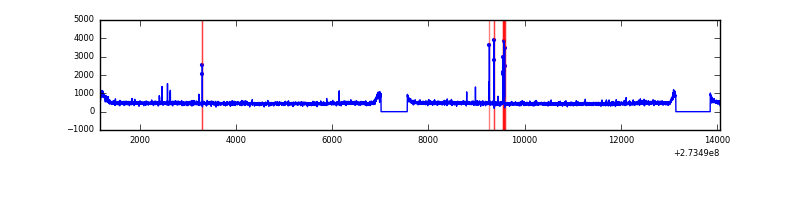 |
| B | 12884 | 11624 | 15 | 15 | 0.12% | 0.13% | 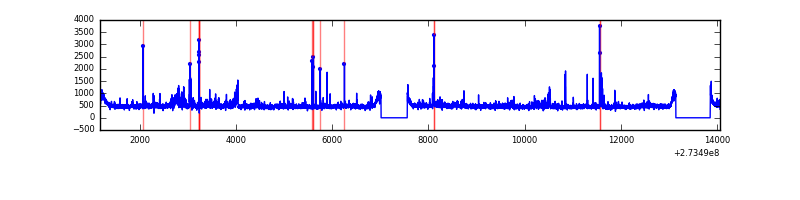 |
| C | 12884 | 11625 | 0 | 0 | 0.00% | 0.00% | 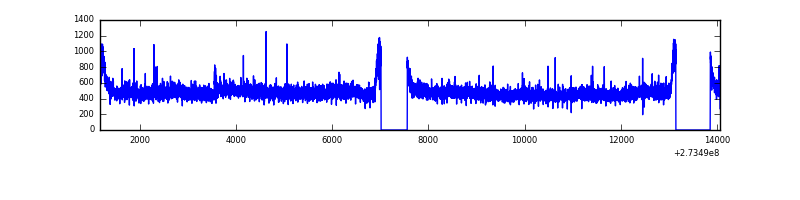 |
| D | 12884 | 11625 | 20 | 20 | 0.16% | 0.17% | 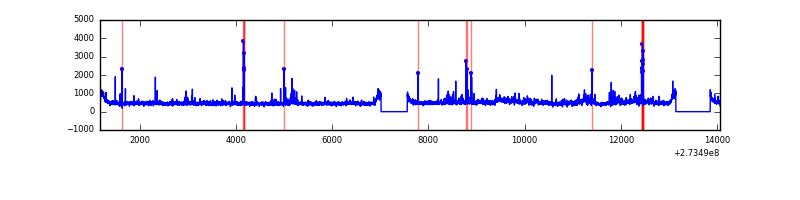 |
Top three noisy pixels from each quadrant. If the there are fewer than three noisy pixels in the level2.evt file, extra rows are filled as -1
| Pixel properties | Quadrant properties | ||||||
|---|---|---|---|---|---|---|---|
| Quadrant | DetID | PixID | Counts | Sigma | Mean | Median | Sigma |
| A | 15 | 239 | 68701 | 236.7 | 1399 | 1367 | 284.5 |
| A | 9 | 143 | 29085 | 97.44 | 1399 | 1367 | 284.5 |
| A | 13 | 210 | 14420 | 45.88 | 1399 | 1367 | 284.5 |
| B | 0 | 189 | 111493 | 408.23 | 1400 | 1365 | 269.8 |
| B | 4 | 216 | 82896 | 302.23 | 1400 | 1365 | 269.8 |
| B | 4 | 48 | 66604 | 241.83 | 1400 | 1365 | 269.8 |
| C | 14 | 238 | 202956 | 636.56 | 1347 | 1356 | 316.7 |
| C | 3 | 233 | 97708 | 304.23 | 1347 | 1356 | 316.7 |
| C | 0 | 207 | 54506 | 167.82 | 1347 | 1356 | 316.7 |
| D | 7 | 223 | 249179 | 733.97 | 1371 | 1333 | 337.7 |
| D | 1 | 52 | 231435 | 681.43 | 1371 | 1333 | 337.7 |
| D | 12 | 218 | 106783 | 312.28 | 1371 | 1333 | 337.7 |
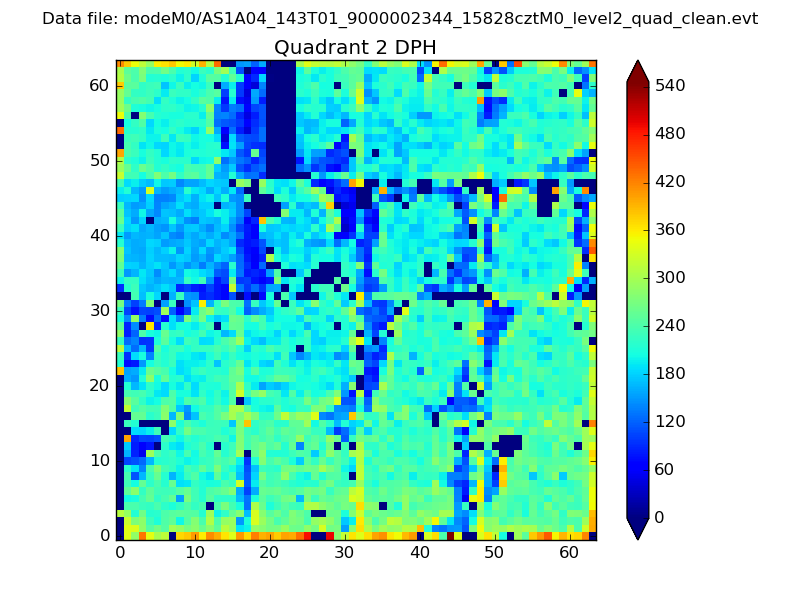
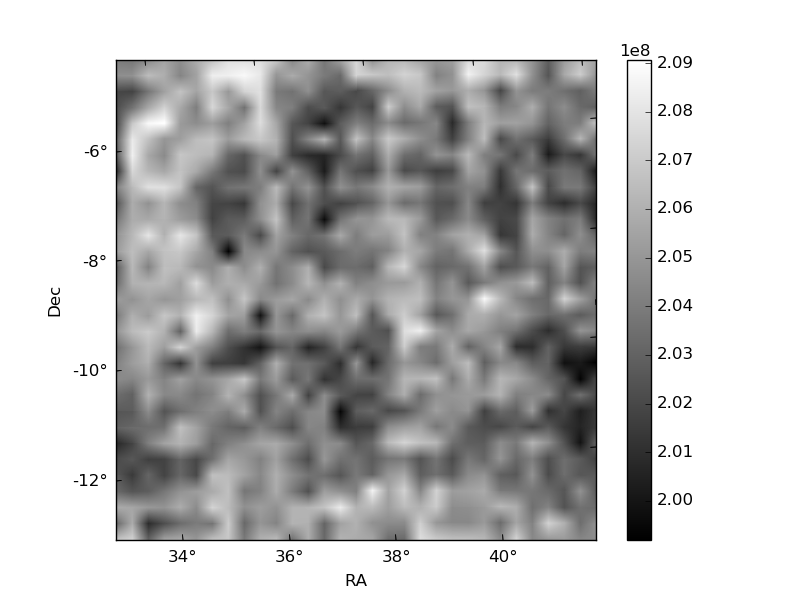
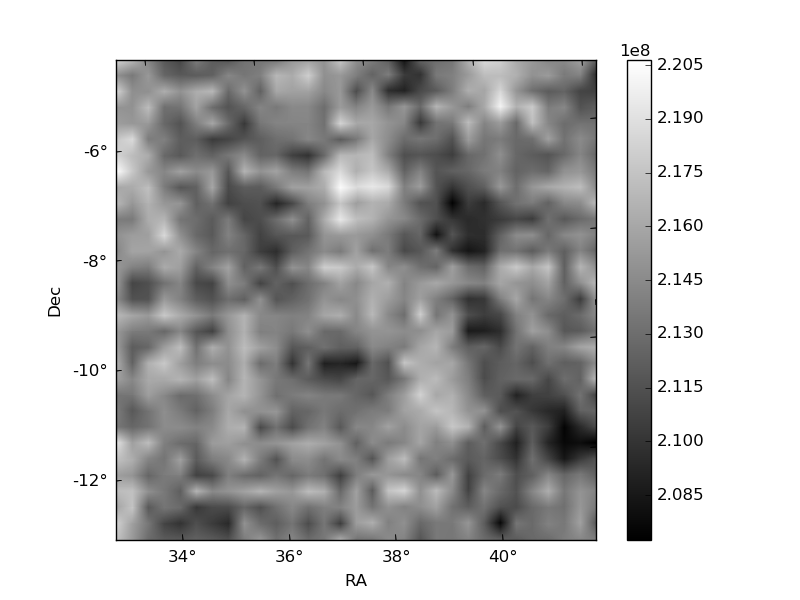
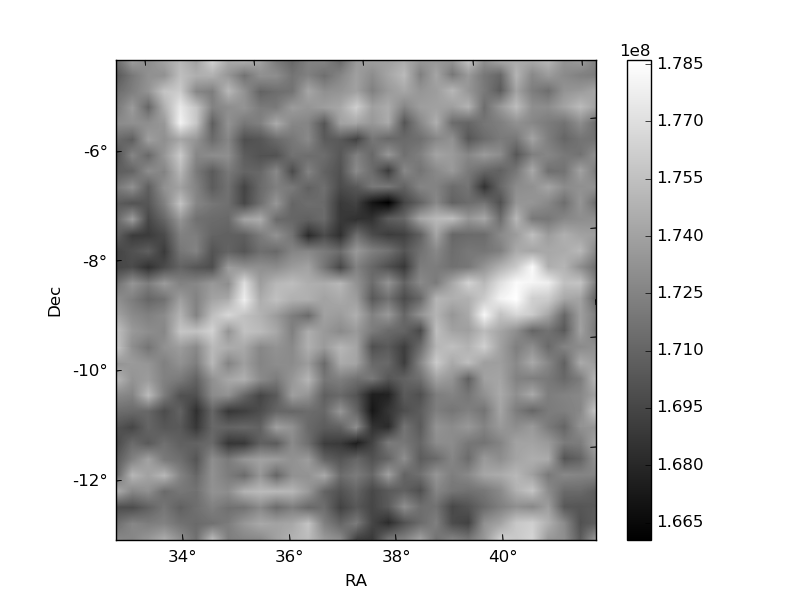
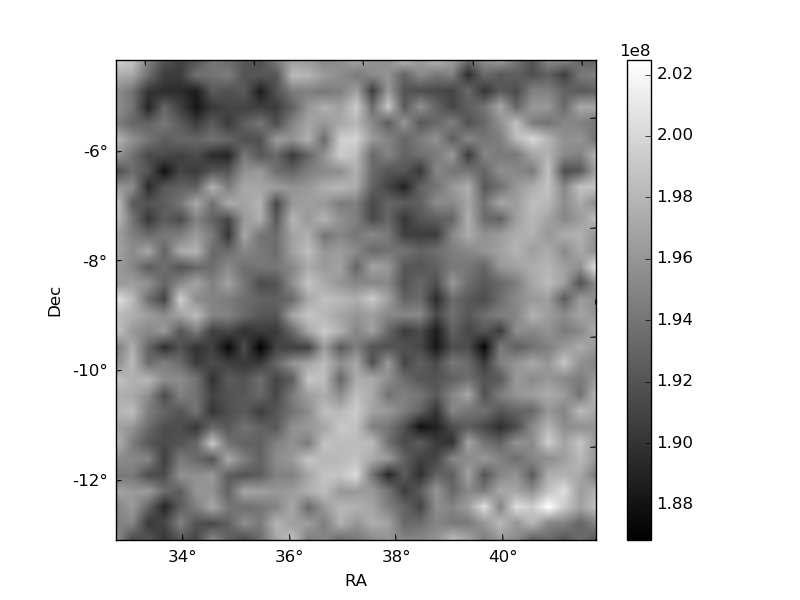
Histogram calculated using DETX and DETY for each event in the final _common_clean file
| Quadrant A | 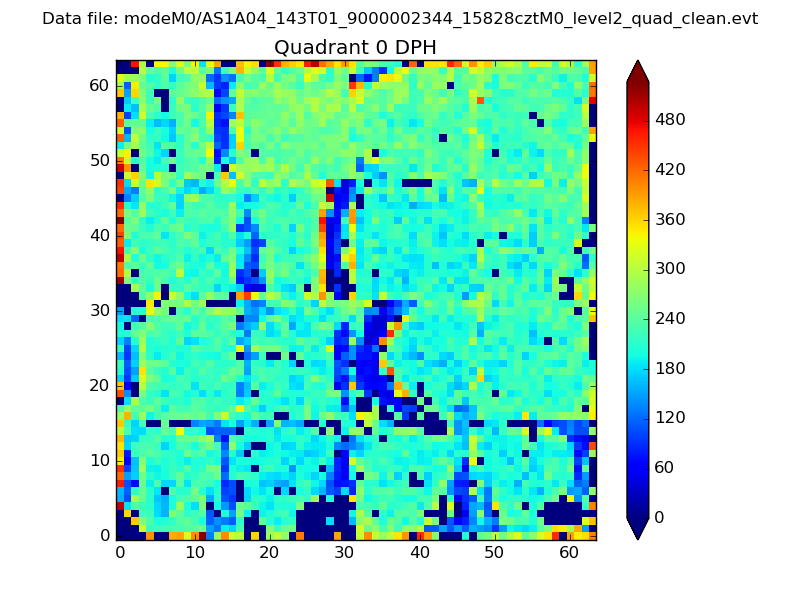 |
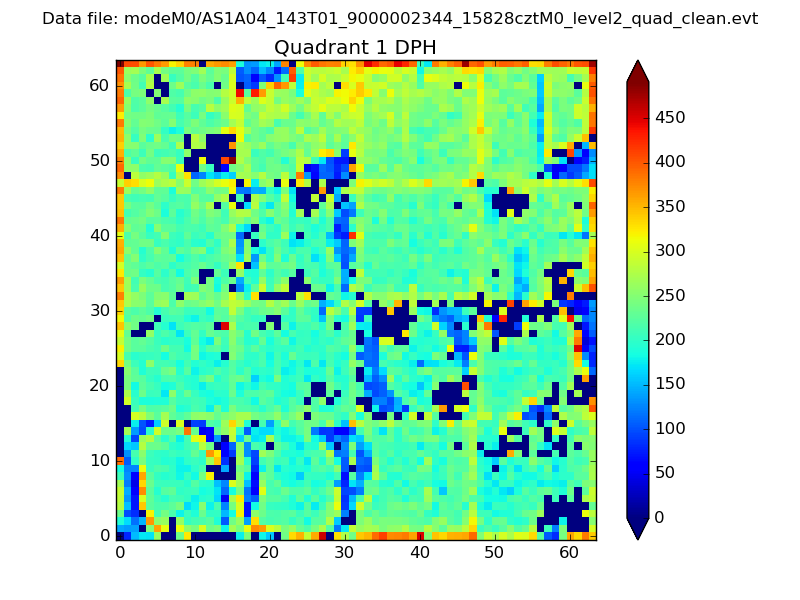 |
Quadrant B |
|---|---|---|---|
| Quadrant D | 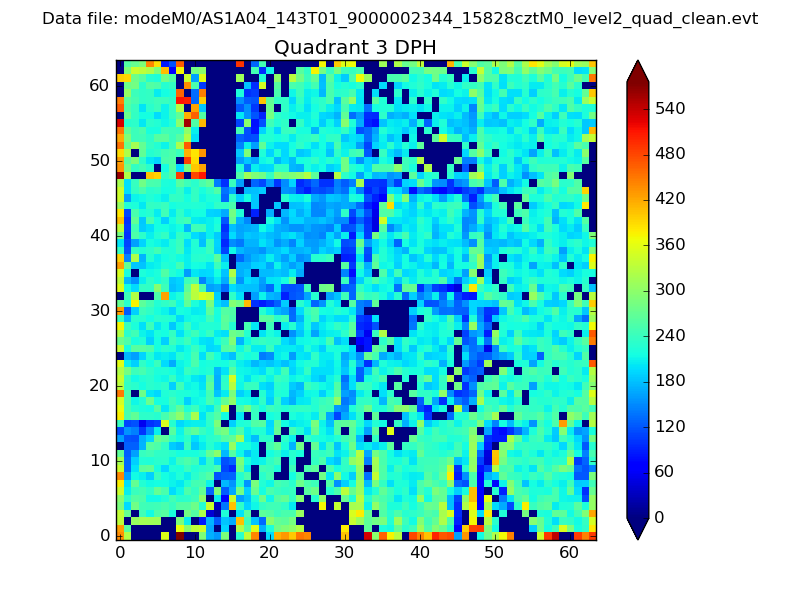 |
 |
Quadrant C |
| Plot type | Count rate plots | Images |
|---|---|---|
| Comparison with Poisson distribution Blue bars denote a histogram of data divided into 1 sec bins. Red curve is a Poisson curve with rate = median count rate of data. |
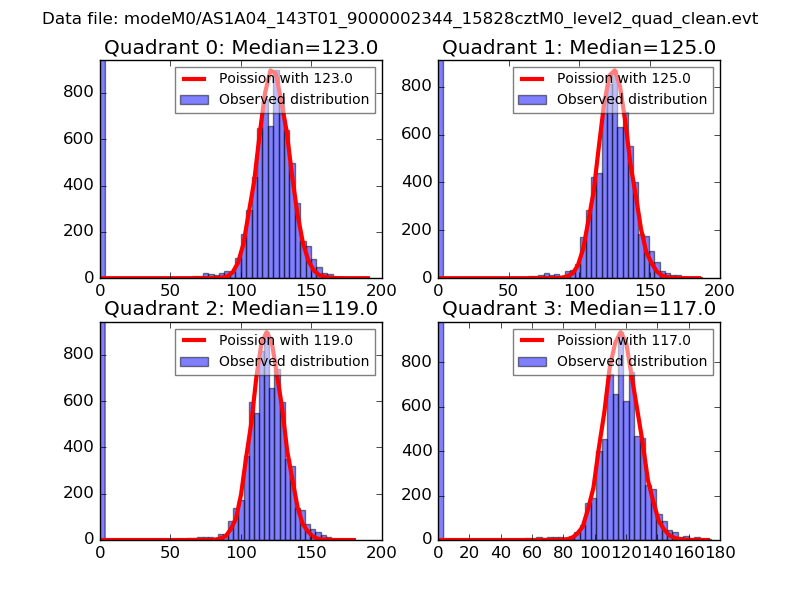 |
 |
| Quadrant-wise count rates Data is divided into 100 sec bins |
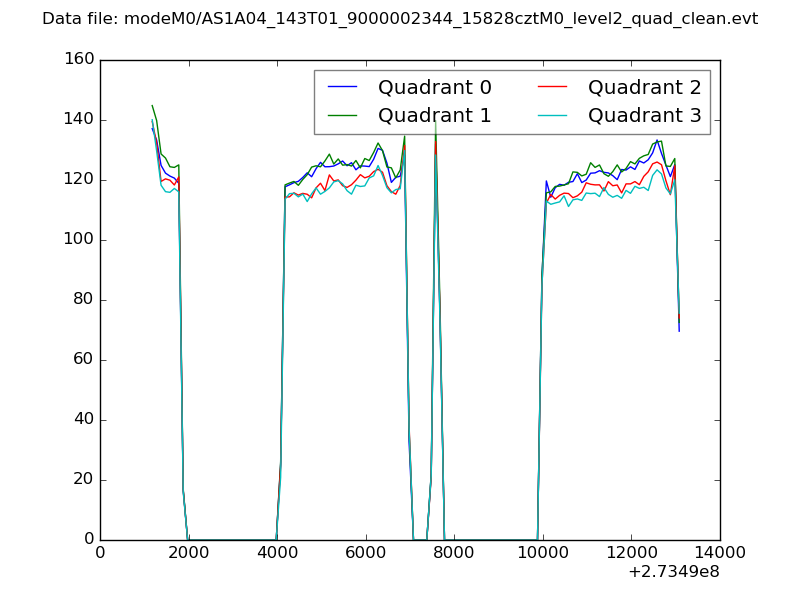 |
|
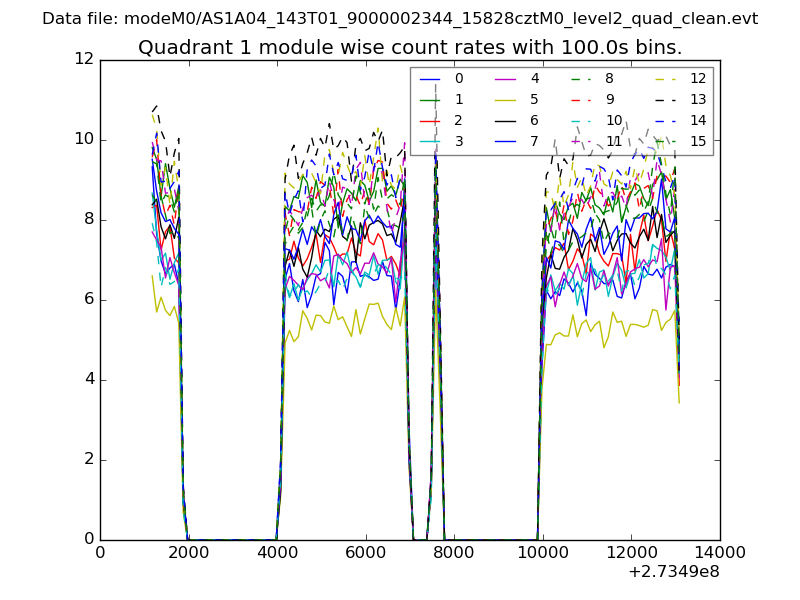
| Module-wise count rates for Quadrant A Data is divided into 100 sec bins |
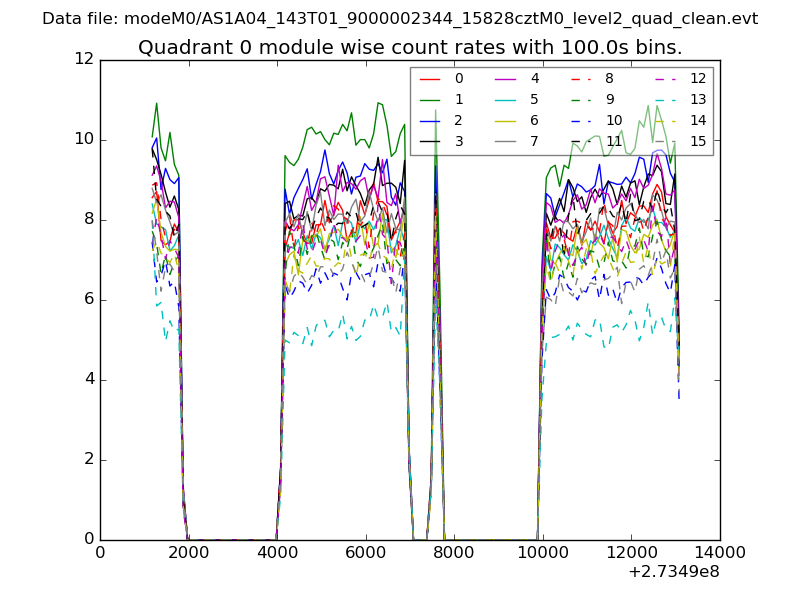 |
 |
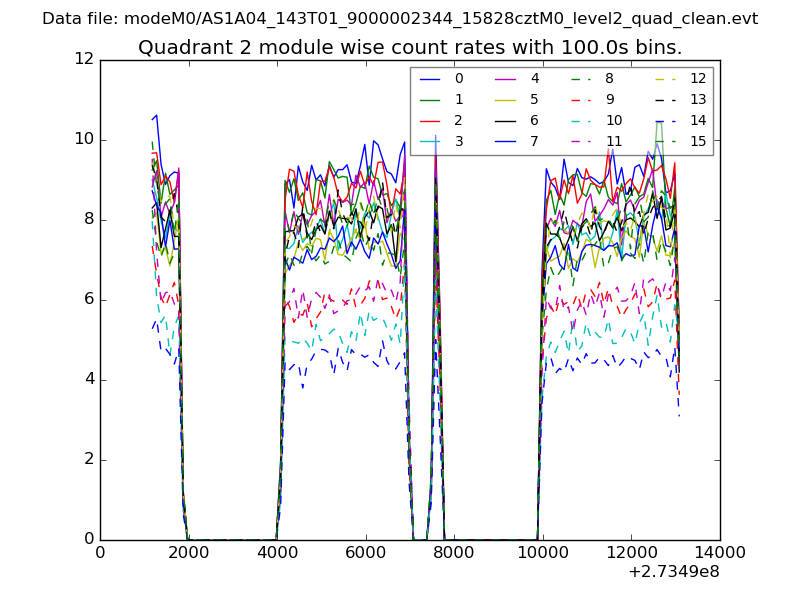
| Module-wise count rates for Quadrant B Data is divided into 100 sec bins |
 |
 |
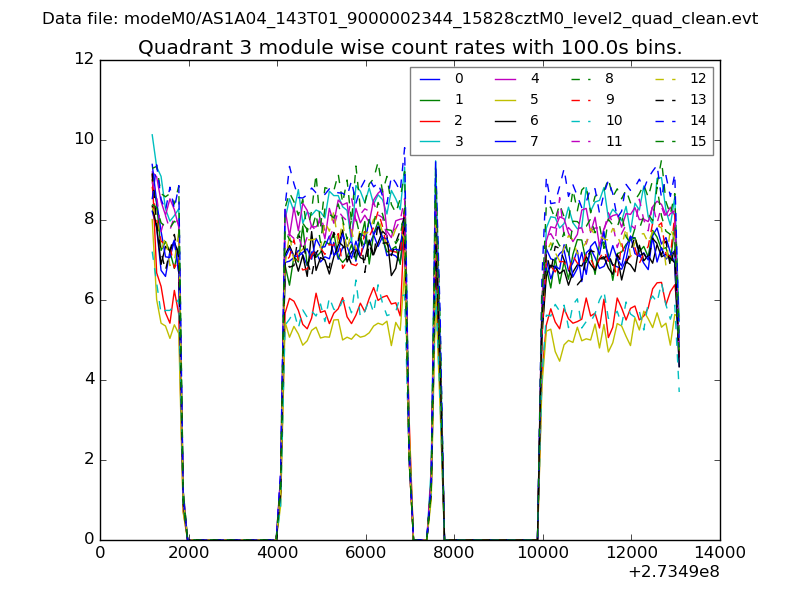
| Module-wise count rates for Quadrant C Data is divided into 100 sec bins |
 |
 |
| Module-wise count rates for Quadrant D Data is divided into 100 sec bins |
 |
 |
| Parameter | Plot |
|---|---|
| CZT HV Monitor | 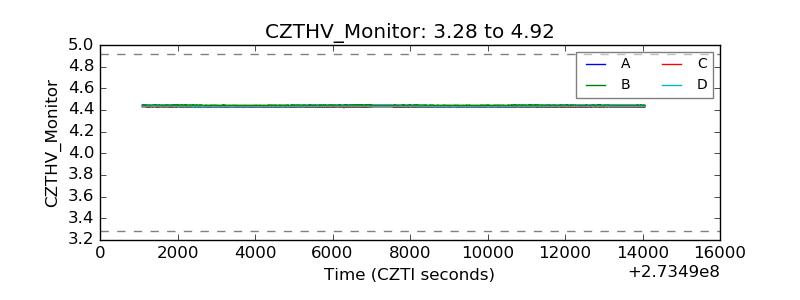 |
| D_VDD | 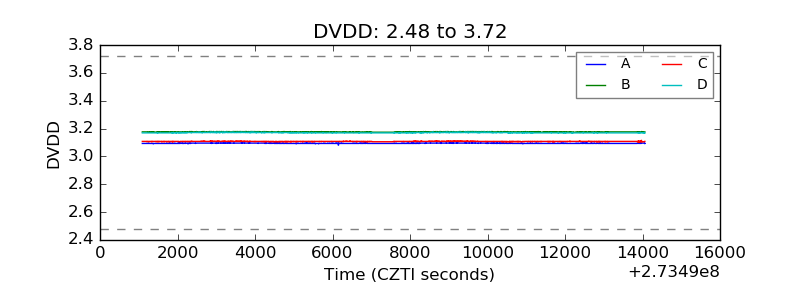 |
| Temperature 1 | 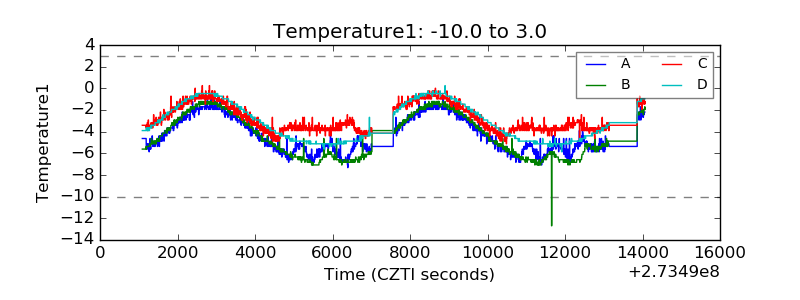 |
| Veto HV Monitor | 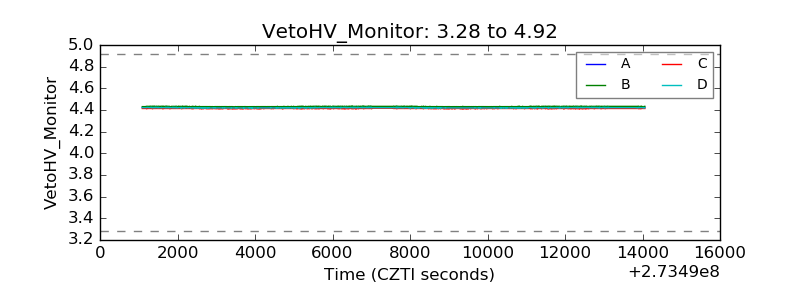 |
| Veto LLD | 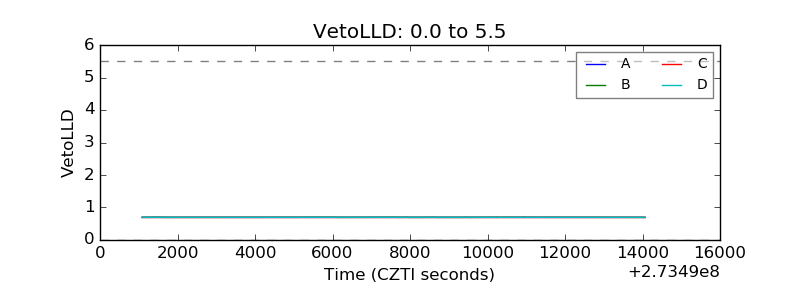 |
| Alpha Counter | 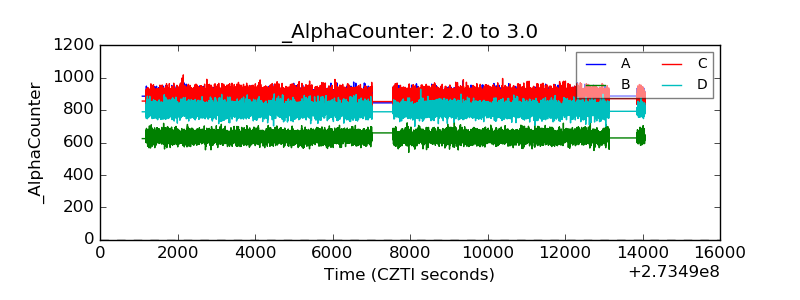 |
| _CPM_Rate | 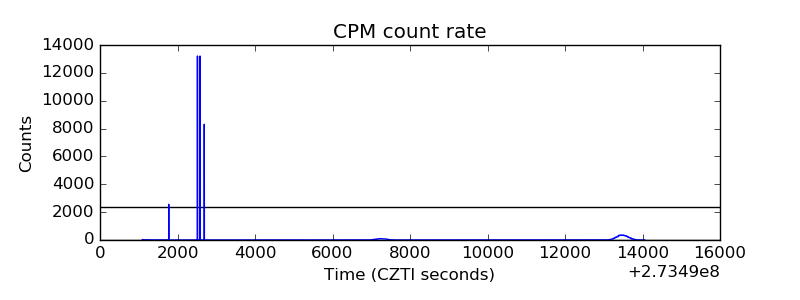 |
| CZT Counter | 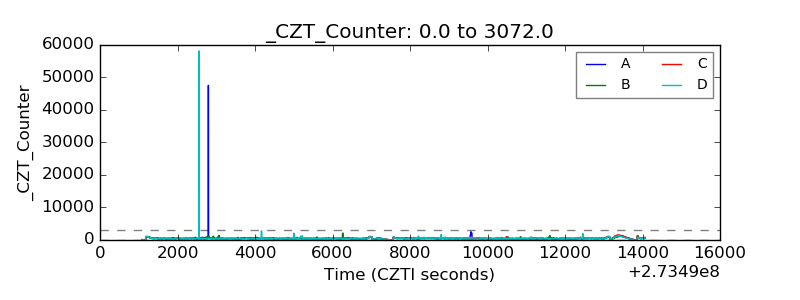 |
| +2.5 Volts monitor | 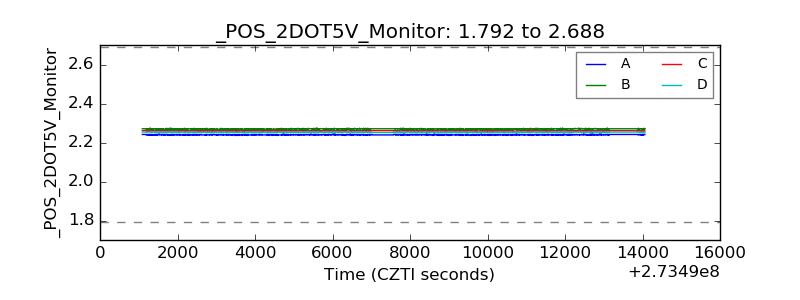 |
| +5 Volts monitor | 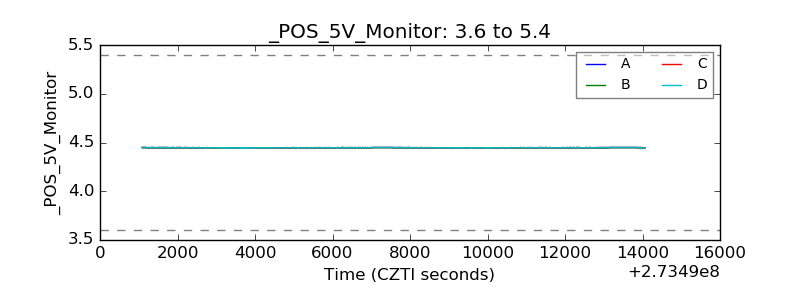 |
| _ROLL_ROT | 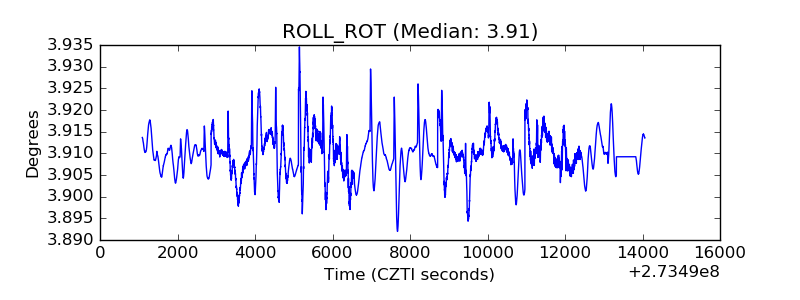 |
| _Roll_DEC | 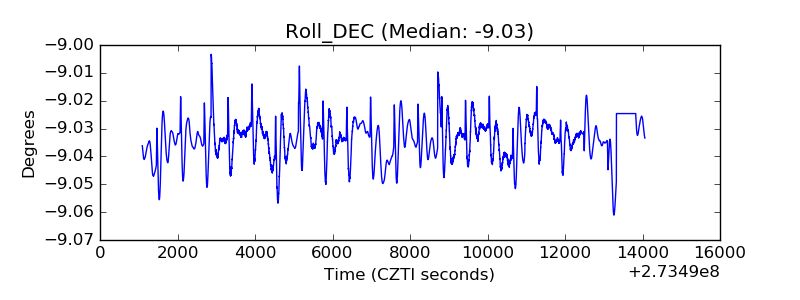 |
| _Roll_RA | 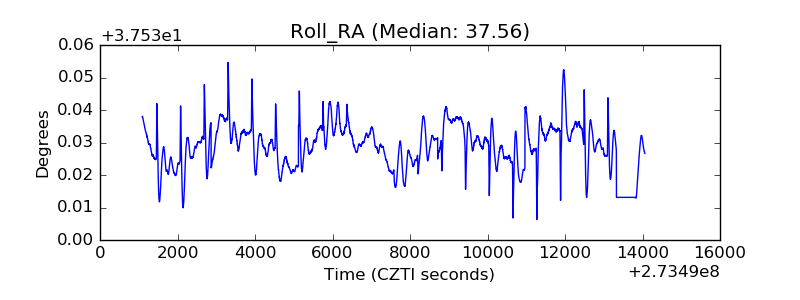 |
| Veto Counter |  |