| Param | Original file | Final file |
|---|---|---|
| Filename | modeM0/AS1A04_143T01_9000002344_15829cztM0_level2.evt | modeM0/AS1A04_143T01_9000002344_15829cztM0_level2_quad_clean.evt |
| Size (bytes) | 2,000,468,160 | 331,983,360 |
| Size | 1.9 GB | 316.6 MB |
| Events in quadrant A | 14,086,312 | 2,043,232 |
| Events in quadrant B | 15,459,459 | 2,075,408 |
| Events in quadrant C | 14,154,733 | 1,983,327 |
| Events in quadrant D | 14,918,178 | 1,952,274 |
| Mode SS | |||
|---|---|---|---|
| Quadrant | BADHDUFLAG | Total packets | Discarded packets |
| A | 0 | 592 | 0 |
| B | 0 | 592 | 0 |
| C | 0 | 592 | 0 |
| D | 0 | 592 | 0 |
| Mode M0 | |||
|---|---|---|---|
| Quadrant | BADHDUFLAG | Total packets | Discarded packets |
| A | 0 | 61307 | 5 |
| B | 0 | 64422 | 4 |
| C | 0 | 60427 | 4 |
| D | 0 | 63570 | 4 |
| Mode M9 | |||
|---|---|---|---|
| Quadrant | BADHDUFLAG | Total packets | Discarded packets |
| A | 0 | 24 | 0 |
| B | 0 | 24 | 0 |
| C | 0 | 24 | 0 |
| D | 0 | 24 | 0 |
| Quadrant | Total seconds | Saturated seconds | Saturation percentage |
|---|---|---|---|
| A | 29083 | 781 | 2.685418% |
| B | 29083 | 861 | 2.960492% |
| C | 29083 | 715 | 2.458481% |
| D | 29083 | 703 | 2.417220% |
Noise dominated data is calculated using 1-second bins in cleaned event files. If a bin has >2000 counts, and if more than 50% of those come from <1% of pixels, then it is considered to be noise-dominated and hence unusable.
| Quadrant | # 1 sec bins | Bins with >0 counts | Bins with >2000 counts | High rate bins dominated by noise | Noise dominated (total time) | Noise dominated (detector-on time) | Marked lightcurve |
|---|---|---|---|---|---|---|---|
| A | 31564 | 29087 | 78 | 78 | 0.25% | 0.27% | 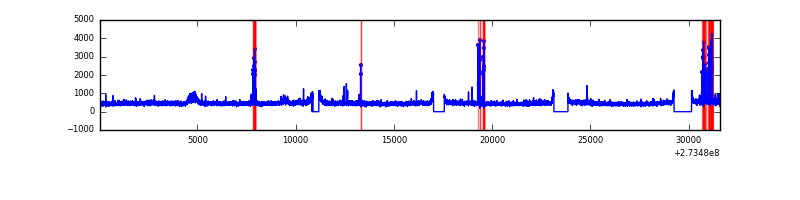 |
| B | 31564 | 29087 | 125 | 125 | 0.40% | 0.43% | 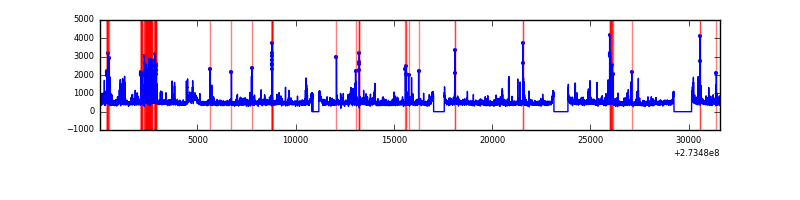 |
| C | 31564 | 29088 | 12 | 12 | 0.04% | 0.04% | 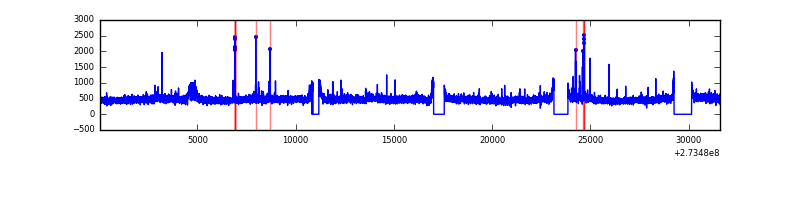 |
| D | 31564 | 29088 | 126 | 126 | 0.40% | 0.43% | 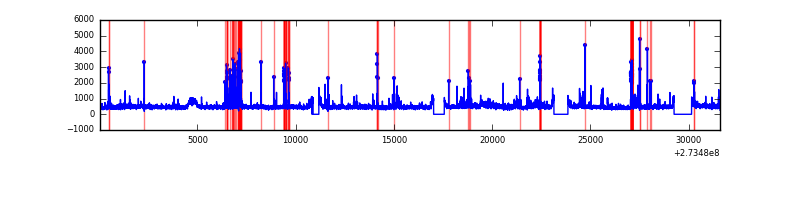 |
Top three noisy pixels from each quadrant. If the there are fewer than three noisy pixels in the level2.evt file, extra rows are filled as -1
| Pixel properties | Quadrant properties | ||||||
|---|---|---|---|---|---|---|---|
| Quadrant | DetID | PixID | Counts | Sigma | Mean | Median | Sigma |
| A | 15 | 239 | 511580 | 715.59 | 3515 | 3436 | 710.1 |
| A | 9 | 143 | 39025 | 50.12 | 3515 | 3436 | 710.1 |
| A | 0 | 226 | 31224 | 39.13 | 3515 | 3436 | 710.1 |
| B | 10 | 245 | 864293 | 1279.45 | 3514 | 3421 | 672.8 |
| B | 4 | 173 | 214635 | 313.91 | 3514 | 3421 | 672.8 |
| B | 0 | 189 | 198604 | 290.09 | 3514 | 3421 | 672.8 |
| C | 14 | 238 | 514167 | 640.2 | 3388 | 3406 | 797.8 |
| C | 3 | 233 | 177921 | 218.74 | 3388 | 3406 | 797.8 |
| C | 0 | 207 | 135700 | 165.82 | 3388 | 3406 | 797.8 |
| D | 7 | 223 | 612331 | 719.85 | 3448 | 3350 | 846.0 |
| D | 12 | 218 | 473032 | 555.19 | 3448 | 3350 | 846.0 |
| D | 1 | 52 | 452440 | 530.85 | 3448 | 3350 | 846.0 |
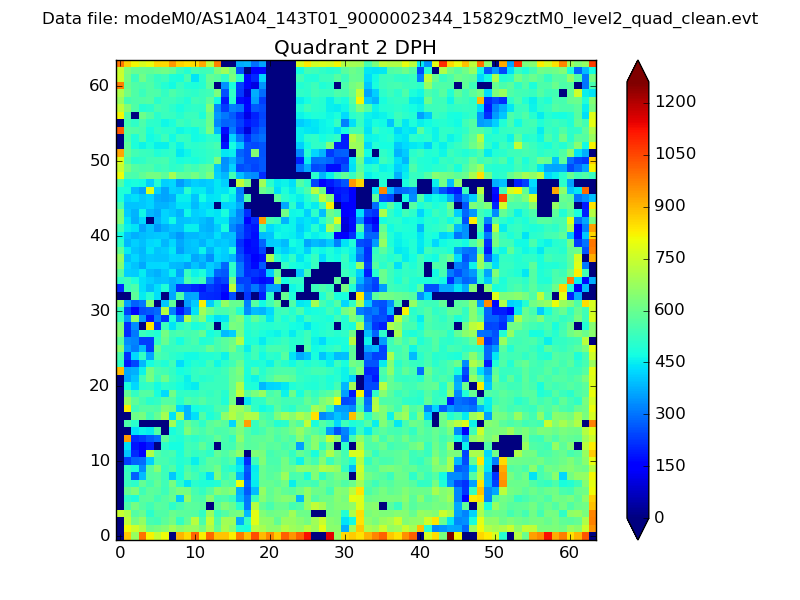
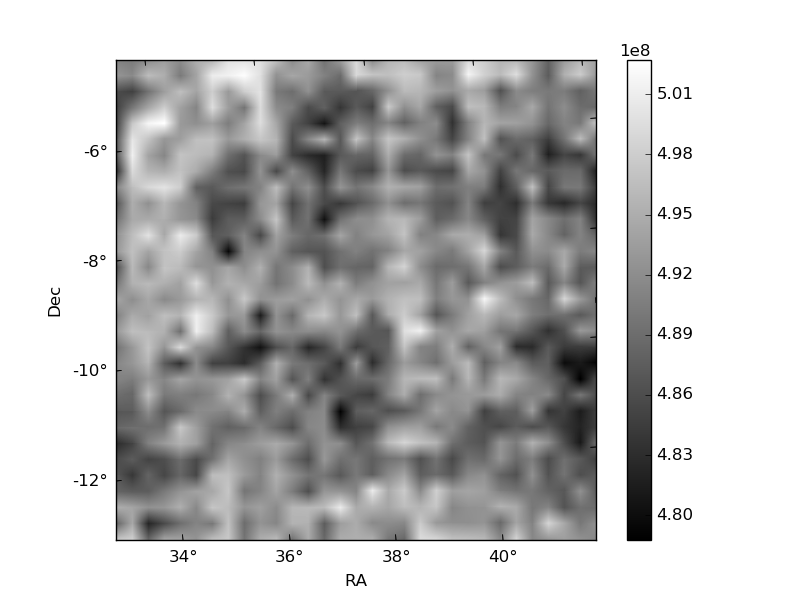
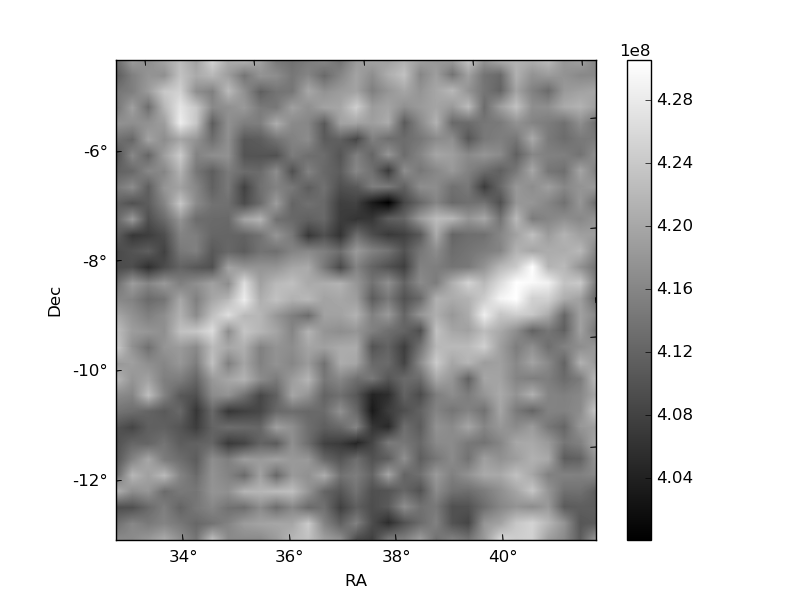
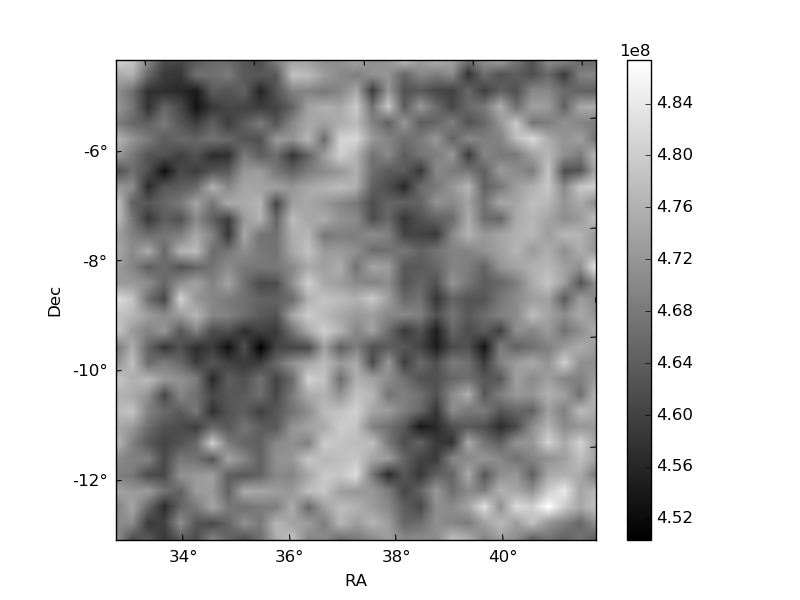
Histogram calculated using DETX and DETY for each event in the final _common_clean file
| Quadrant A | 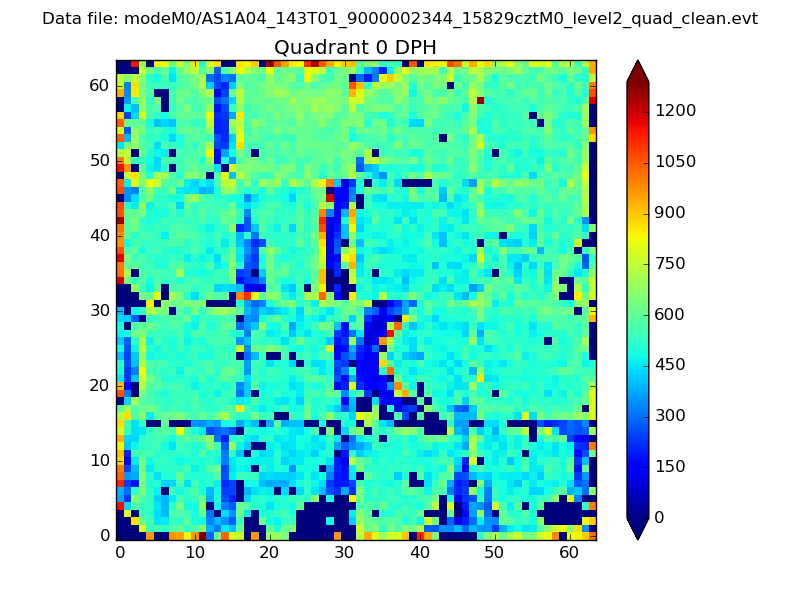 |
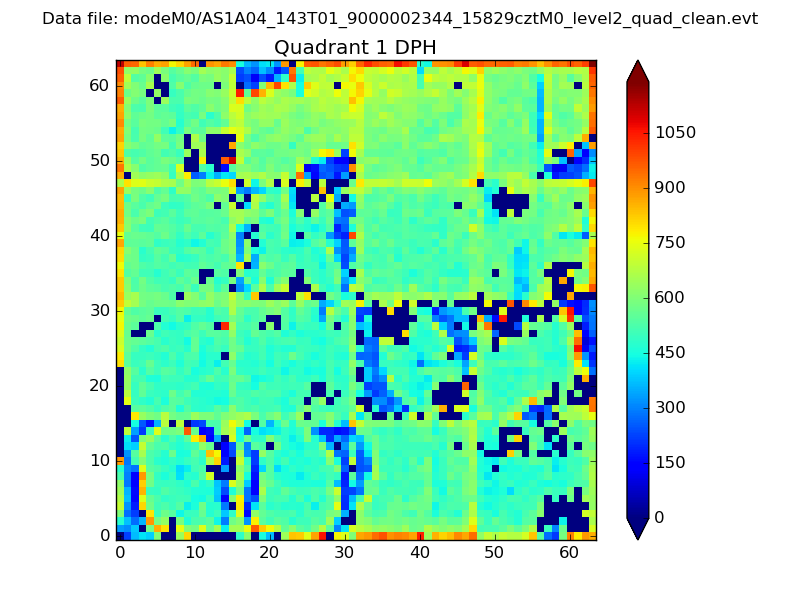 |
Quadrant B |
|---|---|---|---|
| Quadrant D | 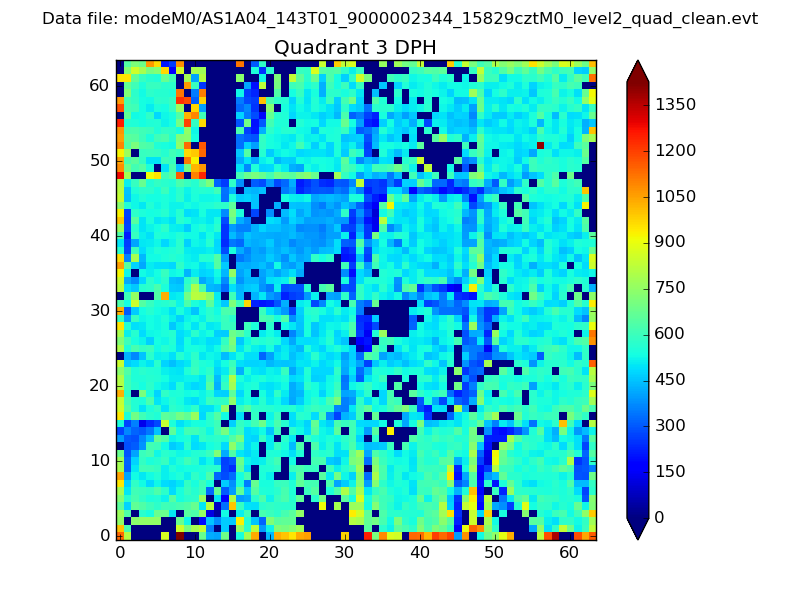 |
 |
Quadrant C |
| Plot type | Count rate plots | Images |
|---|---|---|
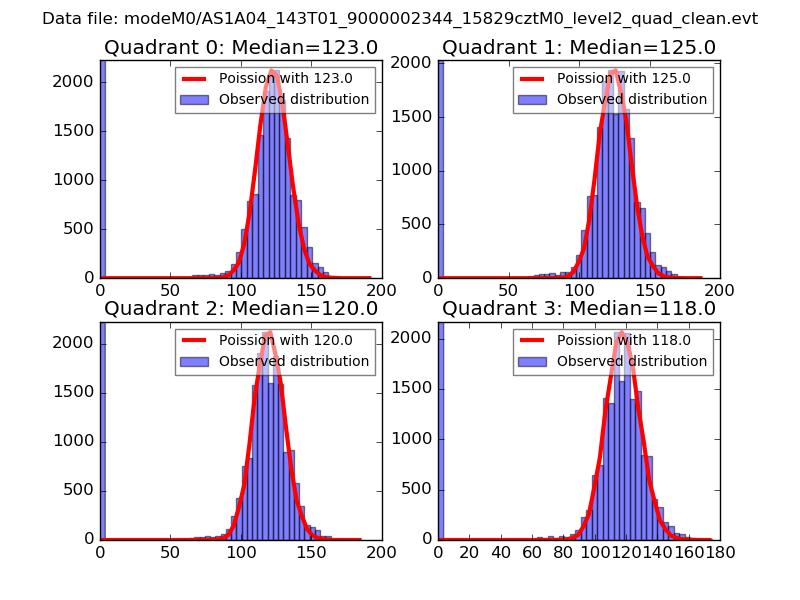
| Comparison with Poisson distribution Blue bars denote a histogram of data divided into 1 sec bins. Red curve is a Poisson curve with rate = median count rate of data. |
 |
 |
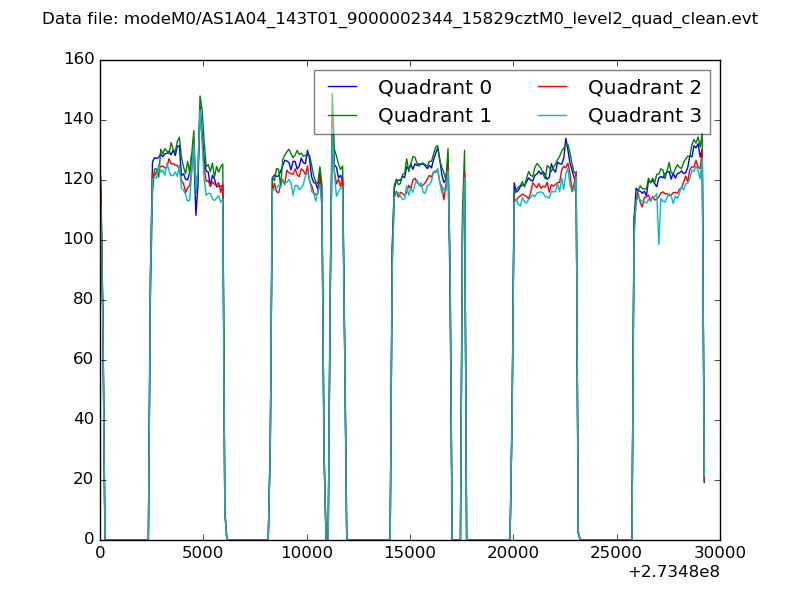
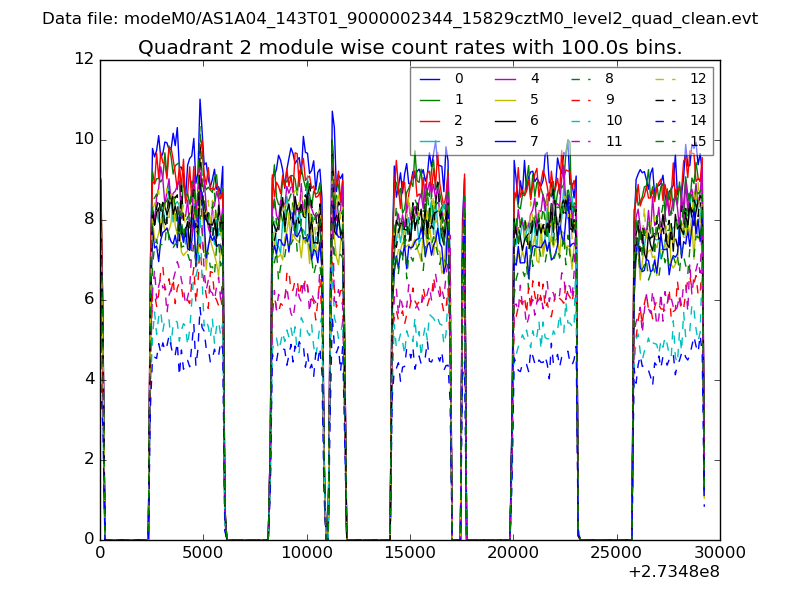
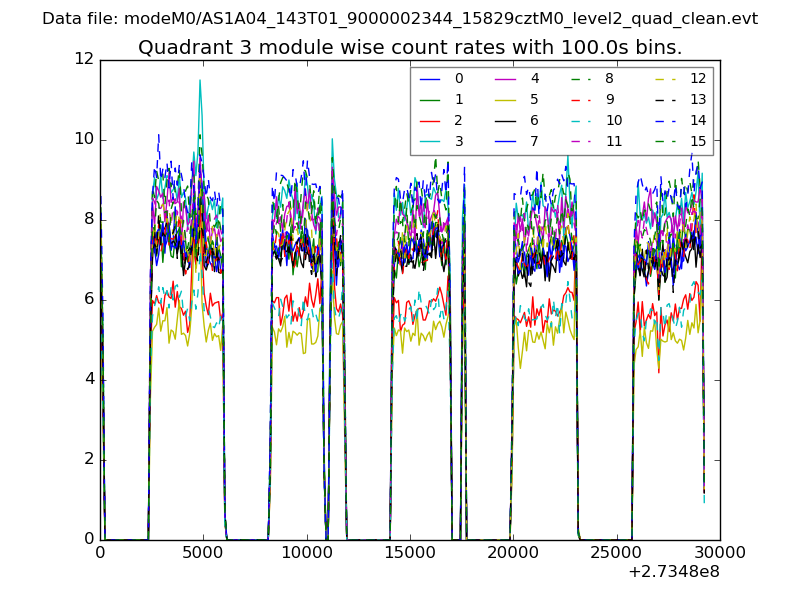
| Quadrant-wise count rates Data is divided into 100 sec bins |
 |
|
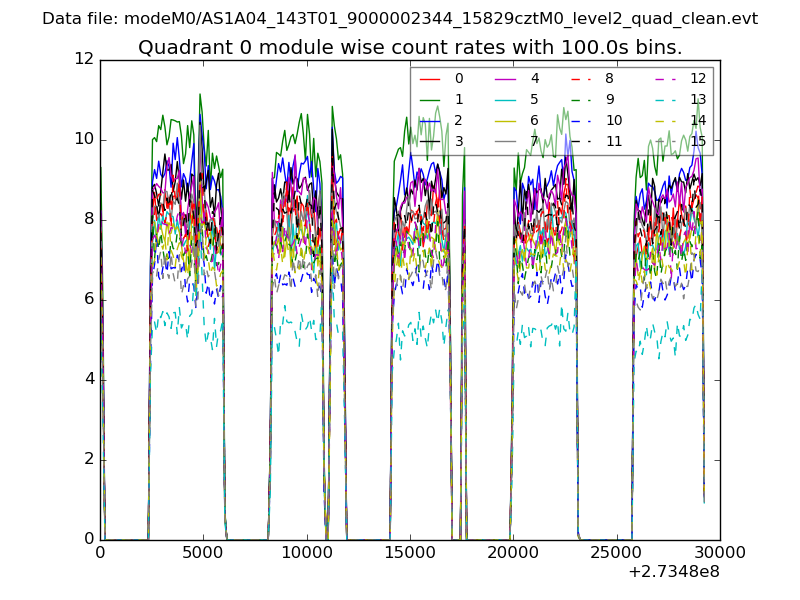
| Module-wise count rates for Quadrant A Data is divided into 100 sec bins |
 |
 |
| Module-wise count rates for Quadrant B Data is divided into 100 sec bins |
 |
 |
| Module-wise count rates for Quadrant C Data is divided into 100 sec bins |
 |
 |
| Module-wise count rates for Quadrant D Data is divided into 100 sec bins |
 |
 |
| Parameter | Plot |
|---|---|
| CZT HV Monitor | 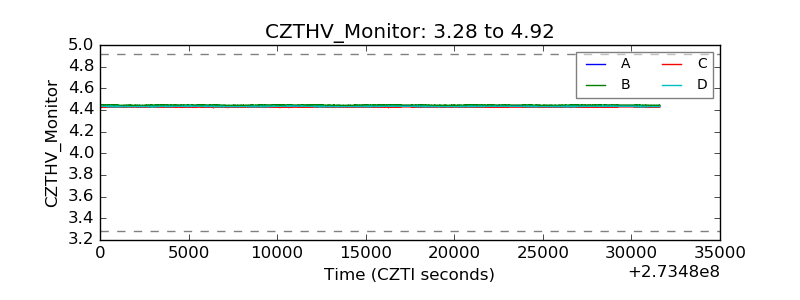 |
| D_VDD | 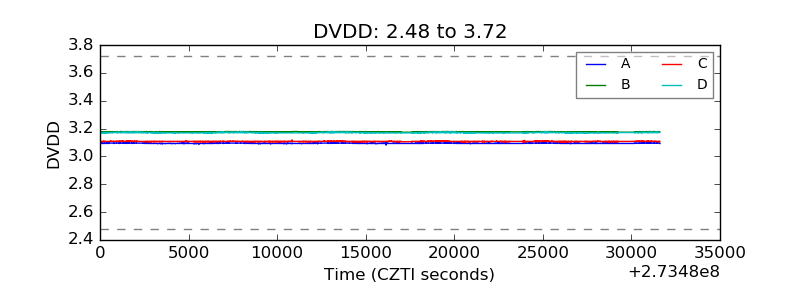 |
| Temperature 1 | 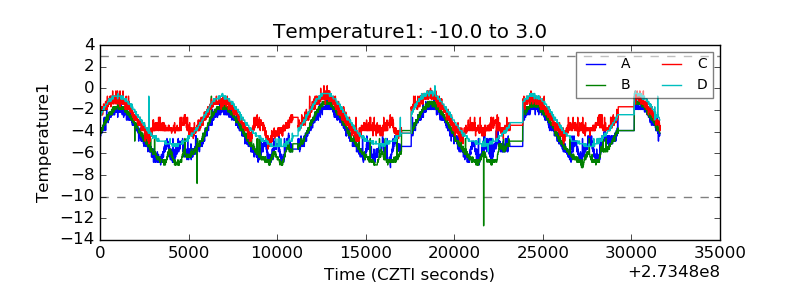 |
| Veto HV Monitor | 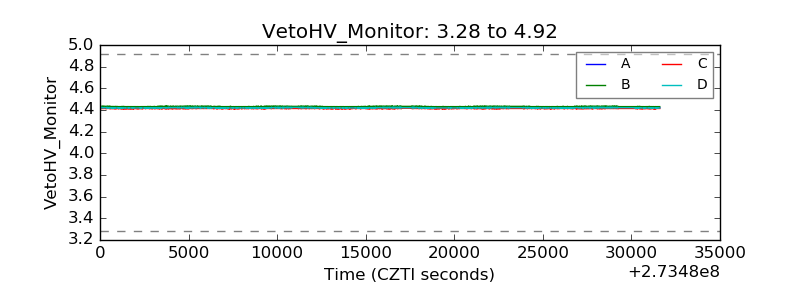 |
| Veto LLD | 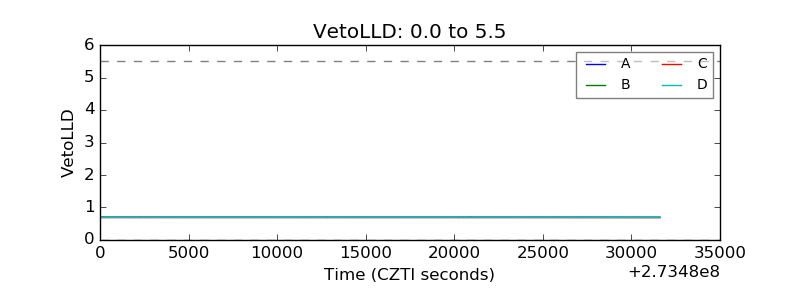 |
| Alpha Counter | 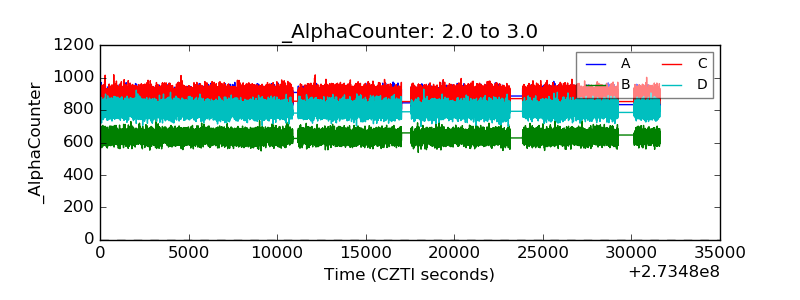 |
| _CPM_Rate | 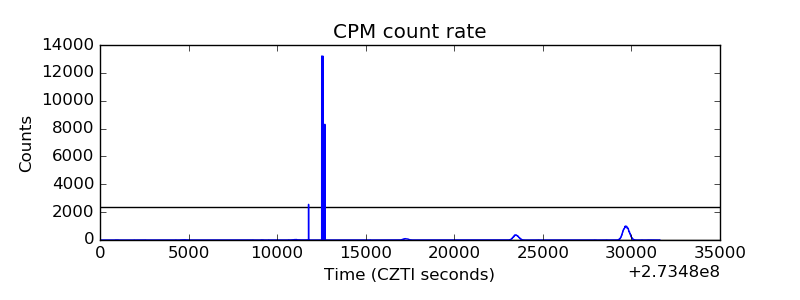 |
| CZT Counter | 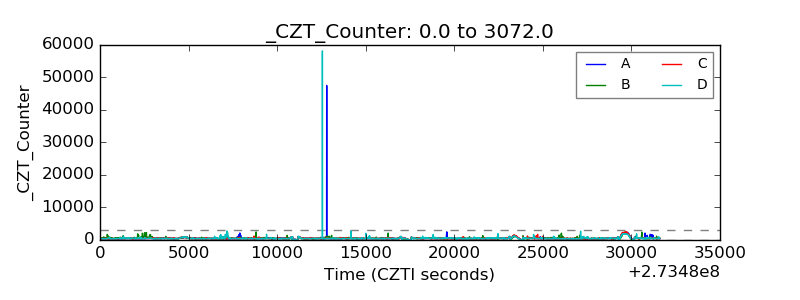 |
| +2.5 Volts monitor |  |
| +5 Volts monitor |  |
| _ROLL_ROT | 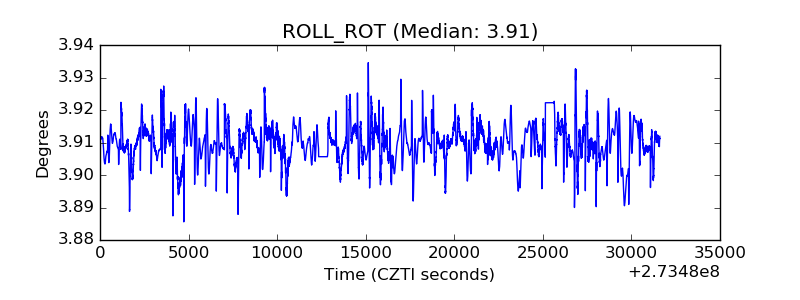 |
| _Roll_DEC | 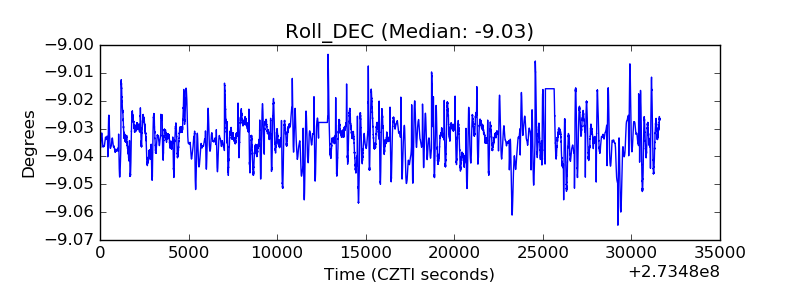 |
| _Roll_RA | 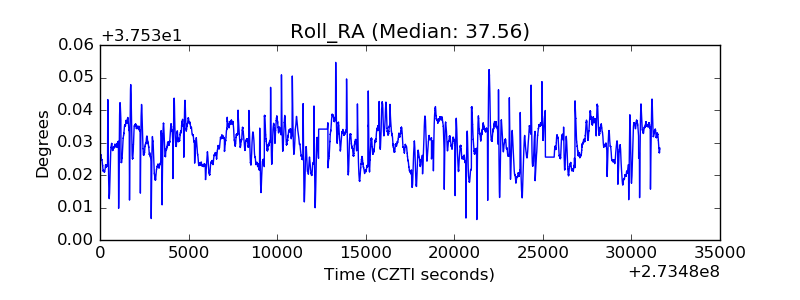 |
| Veto Counter | 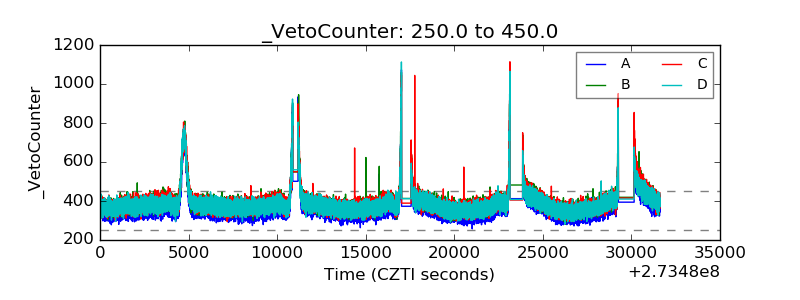 |