| Param | Original file | Final file |
|---|---|---|
| Filename | modeM0/AS1A04_143T01_9000002344_15833cztM0_level2.evt | modeM0/AS1A04_143T01_9000002344_15833cztM0_level2_quad_clean.evt |
| Size (bytes) | 480,176,640 | 96,275,520 |
| Size | 457.9 MB | 91.8 MB |
| Events in quadrant A | 3,995,877 | 614,004 |
| Events in quadrant B | 3,458,952 | 646,796 |
| Events in quadrant C | 3,276,396 | 619,071 |
| Events in quadrant D | 3,388,819 | 601,667 |
| Mode SS | |||
|---|---|---|---|
| Quadrant | BADHDUFLAG | Total packets | Discarded packets |
| A | 0 | 128 | 0 |
| B | 0 | 128 | 0 |
| C | 0 | 128 | 0 |
| D | 0 | 128 | 0 |
| Mode M0 | |||
|---|---|---|---|
| Quadrant | BADHDUFLAG | Total packets | Discarded packets |
| A | 0 | 16025 | 3 |
| B | 0 | 14316 | 2 |
| C | 0 | 13577 | 2 |
| D | 0 | 14343 | 2 |
| Mode M9 | |||
|---|---|---|---|
| Quadrant | BADHDUFLAG | Total packets | Discarded packets |
| A | 0 | 20 | 0 |
| B | 0 | 20 | 0 |
| C | 0 | 20 | 0 |
| D | 0 | 21 | 0 |
| Quadrant | Total seconds | Saturated seconds | Saturation percentage |
|---|---|---|---|
| A | 6211 | 333 | 5.361455% |
| B | 6211 | 89 | 1.432942% |
| C | 6211 | 68 | 1.094832% |
| D | 6211 | 47 | 0.756722% |
Noise dominated data is calculated using 1-second bins in cleaned event files. If a bin has >2000 counts, and if more than 50% of those come from <1% of pixels, then it is considered to be noise-dominated and hence unusable.
| Quadrant | # 1 sec bins | Bins with >0 counts | Bins with >2000 counts | High rate bins dominated by noise | Noise dominated (total time) | Noise dominated (detector-on time) | Marked lightcurve |
|---|---|---|---|---|---|---|---|
| A | 7492 | 6213 | 193 | 193 | 2.58% | 3.11% | 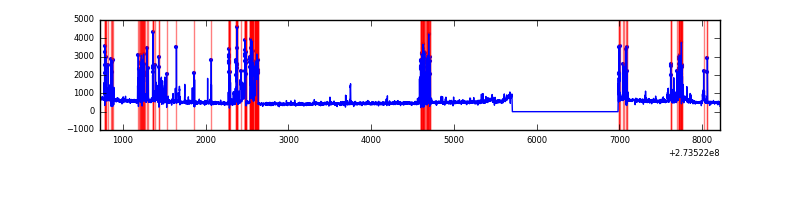 |
| B | 7492 | 6213 | 22 | 22 | 0.29% | 0.35% |  |
| C | 7492 | 6213 | 0 | 0 | 0.00% | 0.00% | 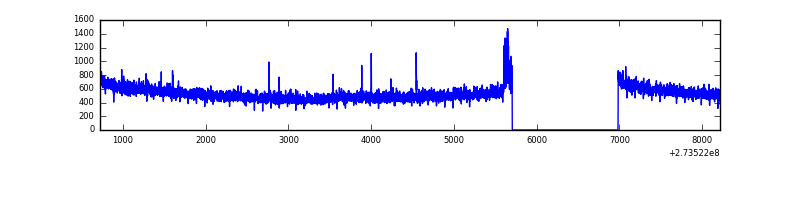 |
| D | 7492 | 6213 | 17 | 17 | 0.23% | 0.27% |  |
Top three noisy pixels from each quadrant. If the there are fewer than three noisy pixels in the level2.evt file, extra rows are filled as -1
| Pixel properties | Quadrant properties | ||||||
|---|---|---|---|---|---|---|---|
| Quadrant | DetID | PixID | Counts | Sigma | Mean | Median | Sigma |
| A | 15 | 239 | 775349 | 4853.36 | 788 | 774 | 159.6 |
| A | 9 | 143 | 123553 | 769.31 | 788 | 774 | 159.6 |
| A | 14 | 239 | 50779 | 313.32 | 788 | 774 | 159.6 |
| B | 4 | 173 | 122492 | 785.94 | 815 | 797 | 154.8 |
| B | 4 | 216 | 88393 | 565.72 | 815 | 797 | 154.8 |
| B | 0 | 244 | 34369 | 216.82 | 815 | 797 | 154.8 |
| C | 14 | 238 | 121692 | 664.92 | 785 | 793 | 181.8 |
| C | 3 | 233 | 63590 | 345.37 | 785 | 793 | 181.8 |
| C | 10 | 22 | 24024 | 127.77 | 785 | 793 | 181.8 |
| D | 1 | 52 | 232934 | 1210.89 | 788 | 766 | 191.7 |
| D | 12 | 221 | 109611 | 567.69 | 788 | 766 | 191.7 |
| D | 12 | 233 | 25198 | 127.43 | 788 | 766 | 191.7 |
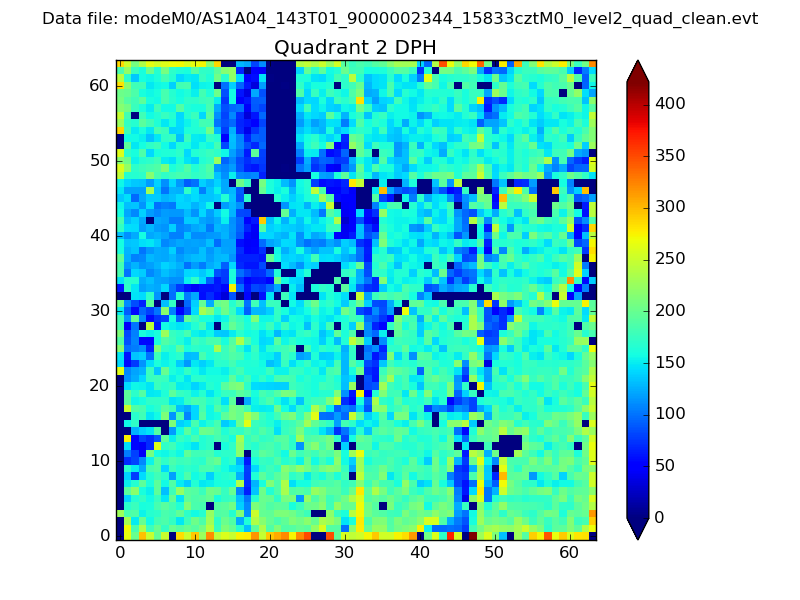
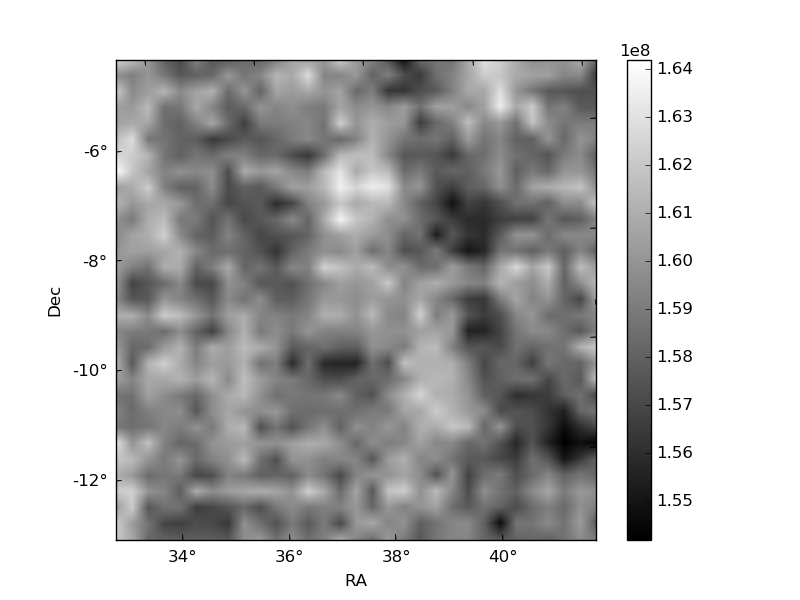
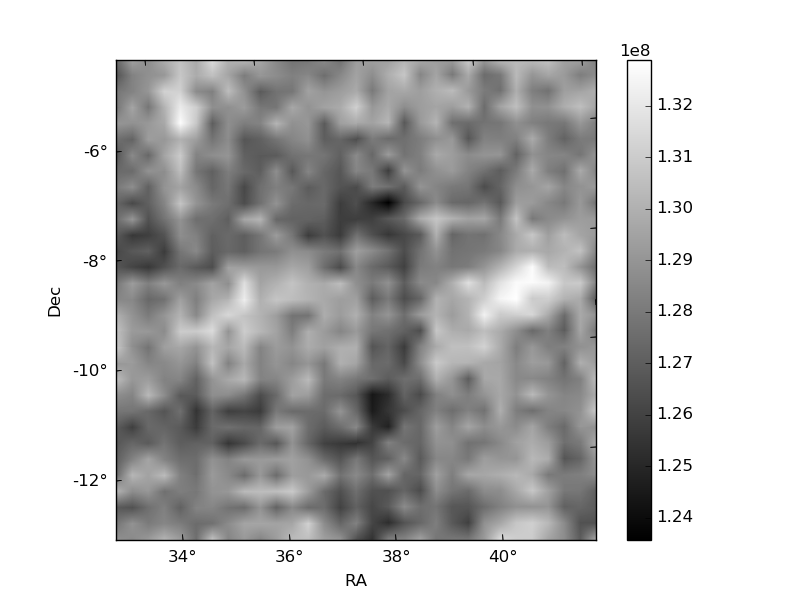
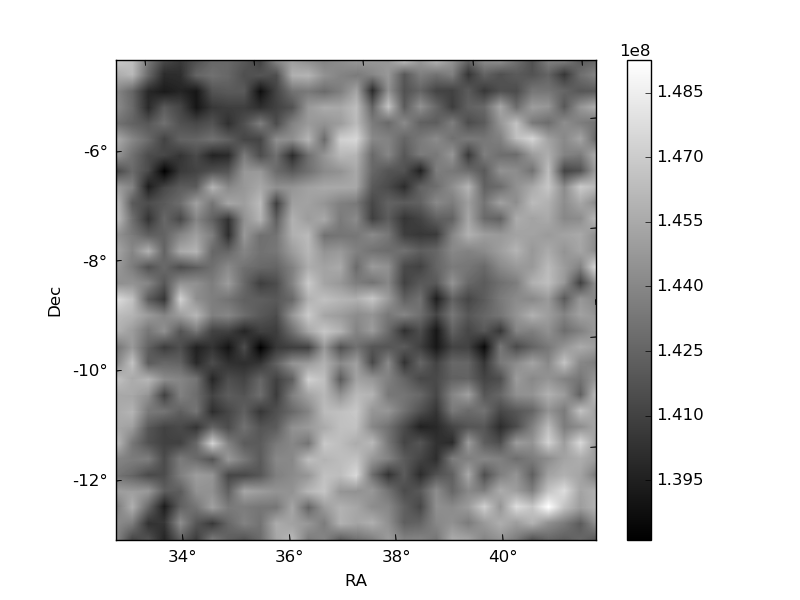
Histogram calculated using DETX and DETY for each event in the final _common_clean file
| Quadrant A | 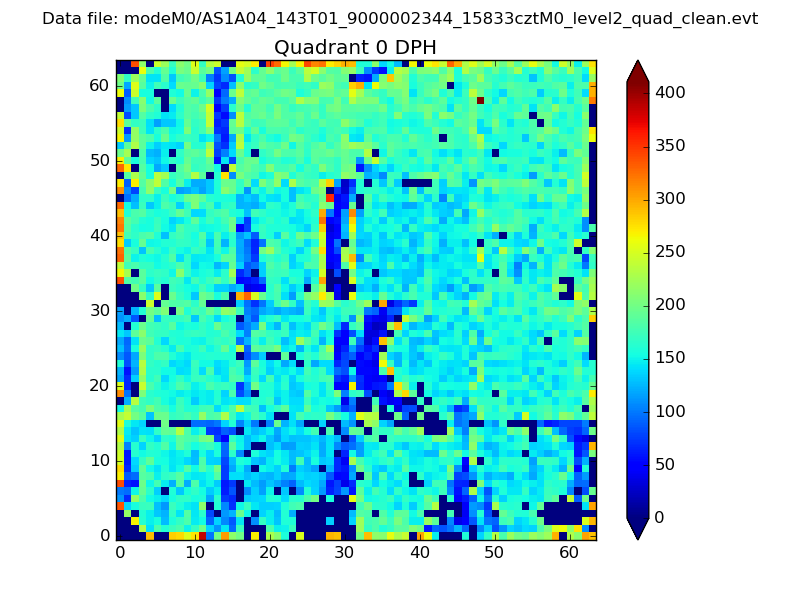 |
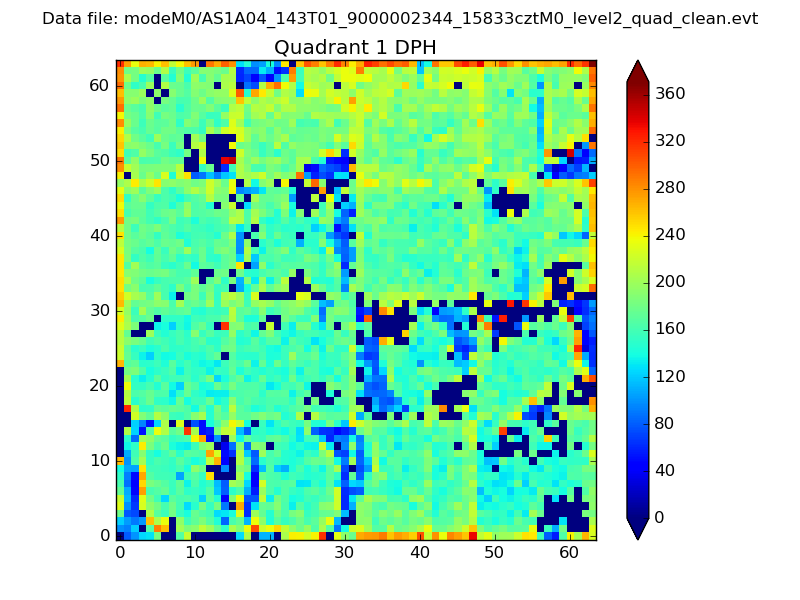 |
Quadrant B |
|---|---|---|---|
| Quadrant D | 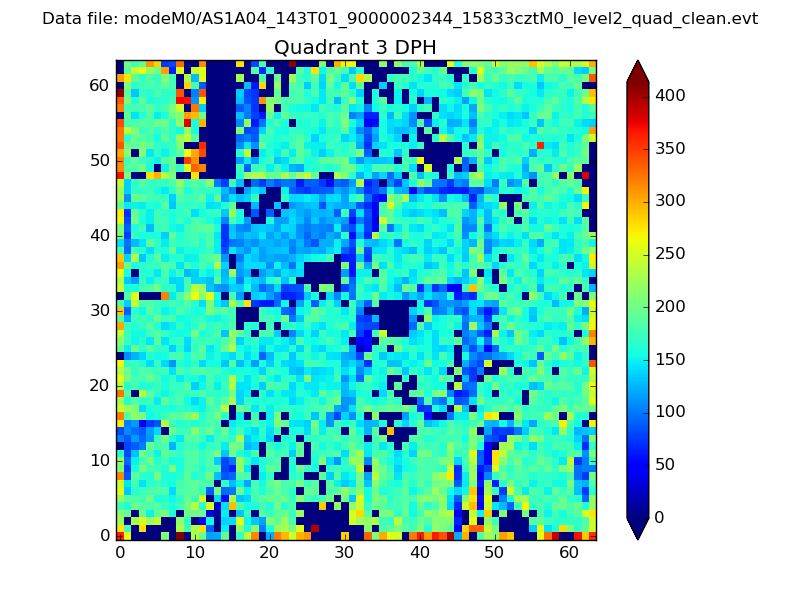 |
 |
Quadrant C |
| Plot type | Count rate plots | Images |
|---|---|---|
| Comparison with Poisson distribution Blue bars denote a histogram of data divided into 1 sec bins. Red curve is a Poisson curve with rate = median count rate of data. |
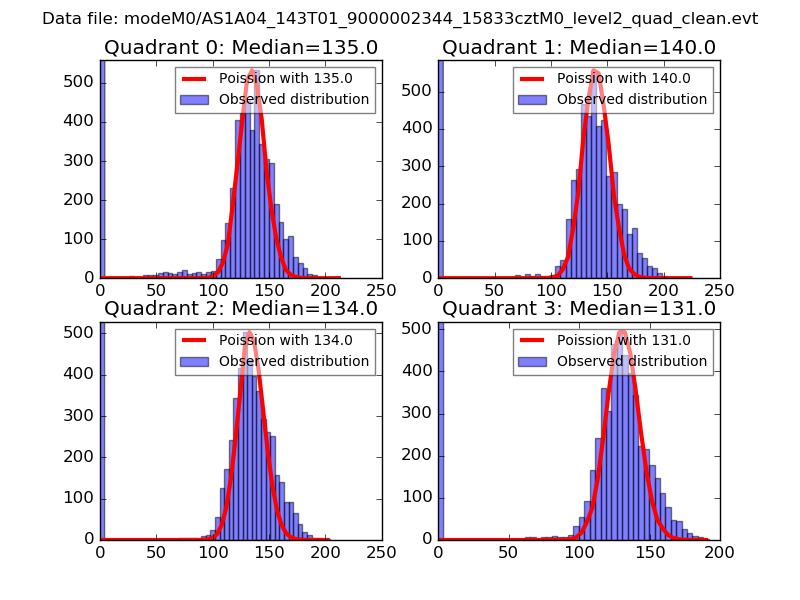 |
 |
| Quadrant-wise count rates Data is divided into 100 sec bins |
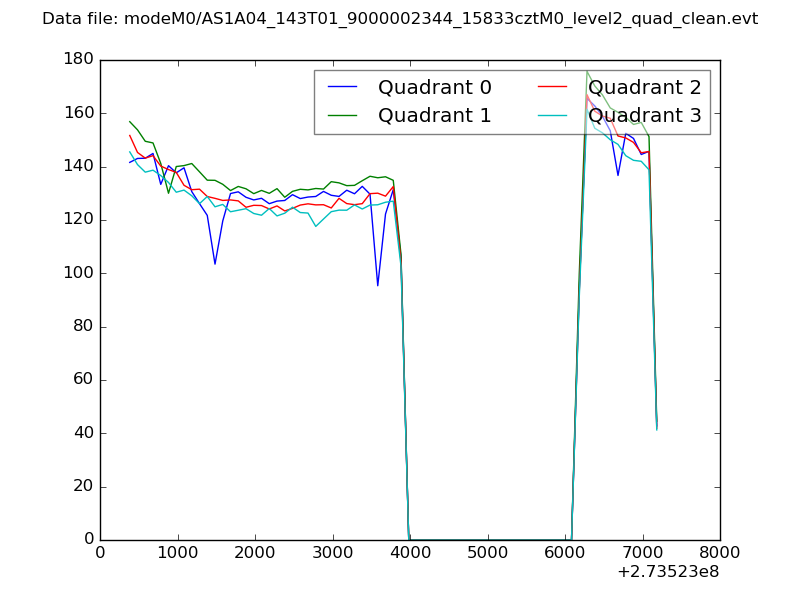 |
|
| Module-wise count rates for Quadrant A Data is divided into 100 sec bins |
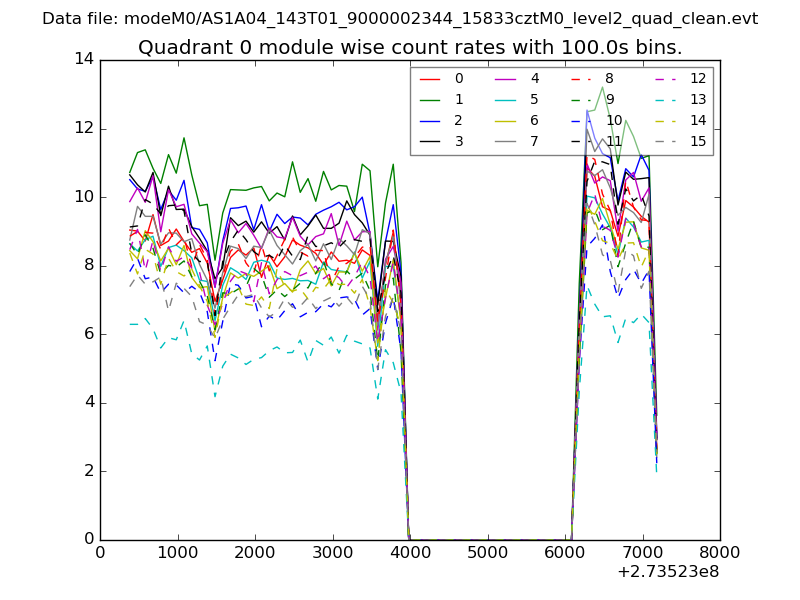 |
 |
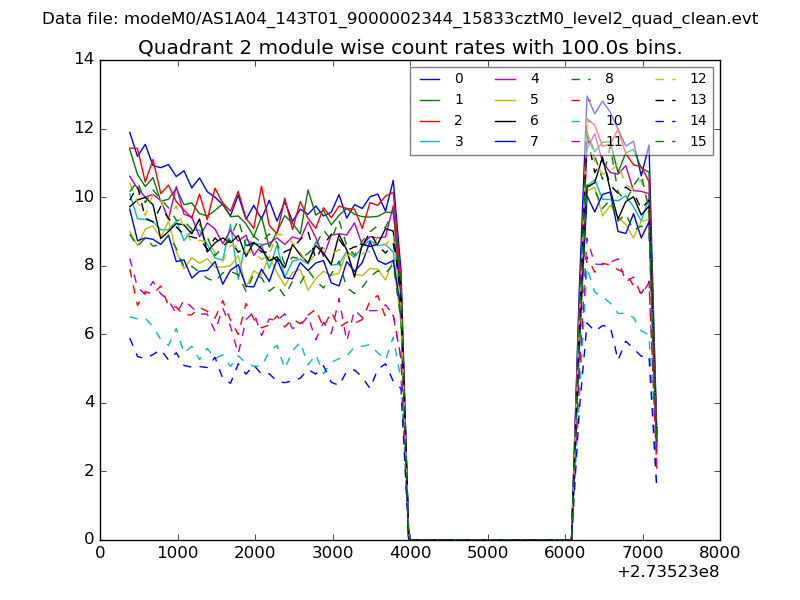
| Module-wise count rates for Quadrant B Data is divided into 100 sec bins |
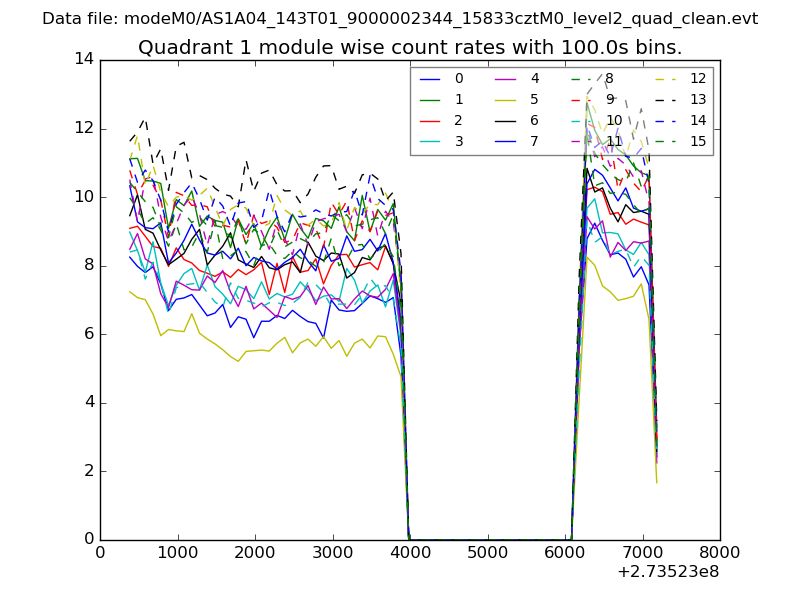 |
 |
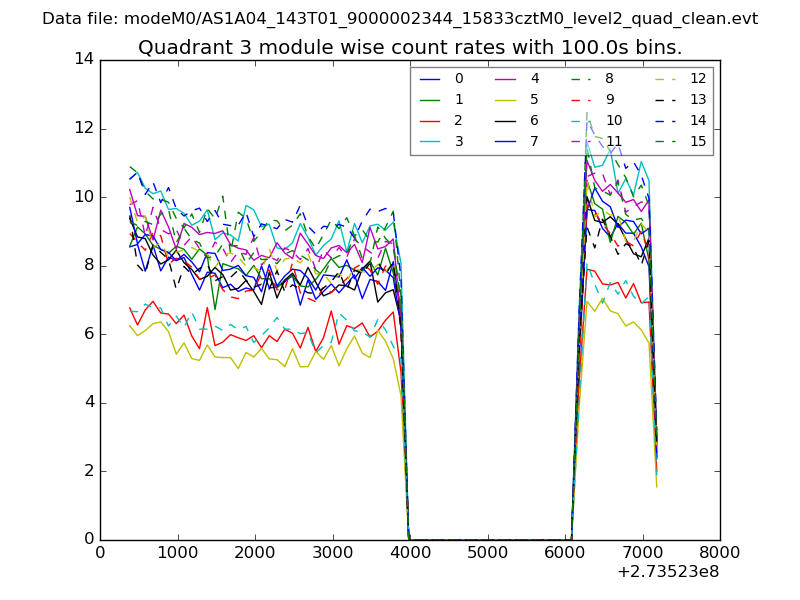
| Module-wise count rates for Quadrant C Data is divided into 100 sec bins |
 |
 |
| Module-wise count rates for Quadrant D Data is divided into 100 sec bins |
 |
 |
| Parameter | Plot |
|---|---|
| CZT HV Monitor | 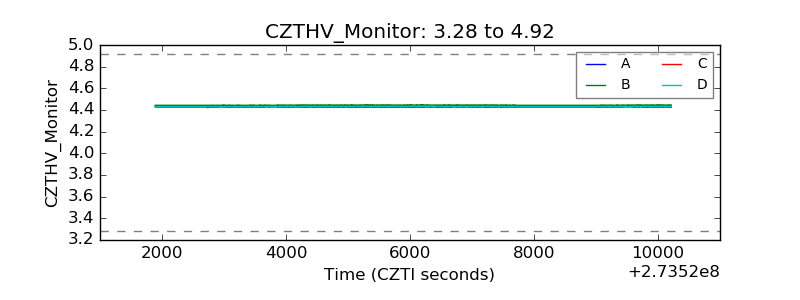 |
| D_VDD |  |
| Temperature 1 | 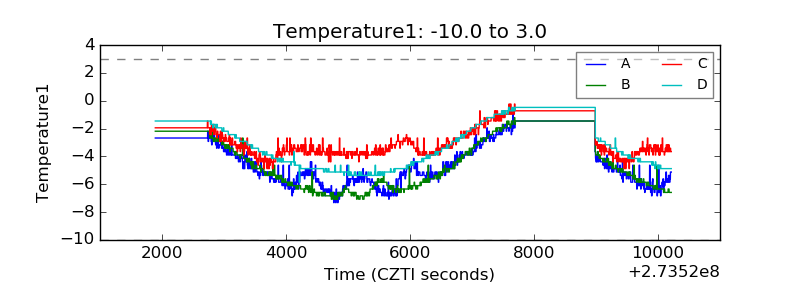 |
| Veto HV Monitor | 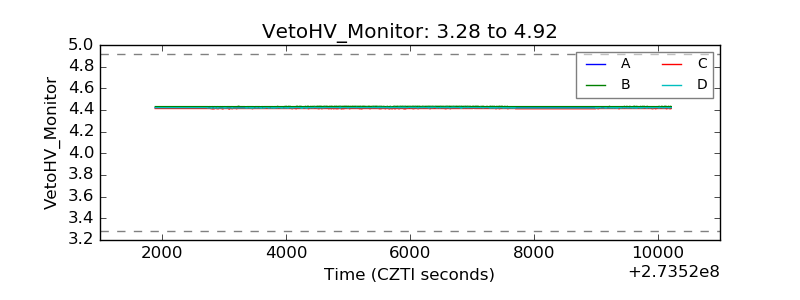 |
| Veto LLD | 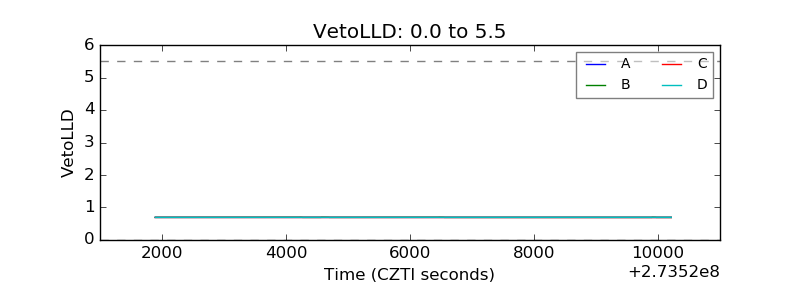 |
| Alpha Counter | 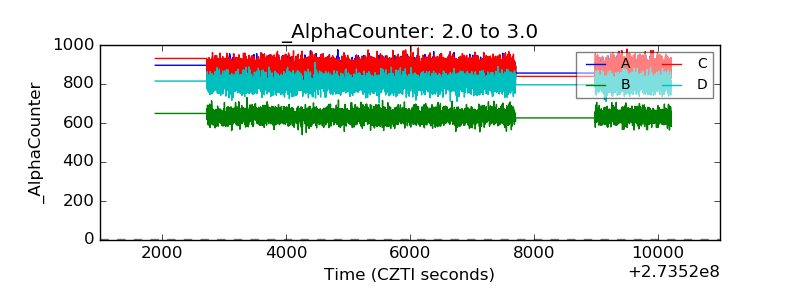 |
| _CPM_Rate | 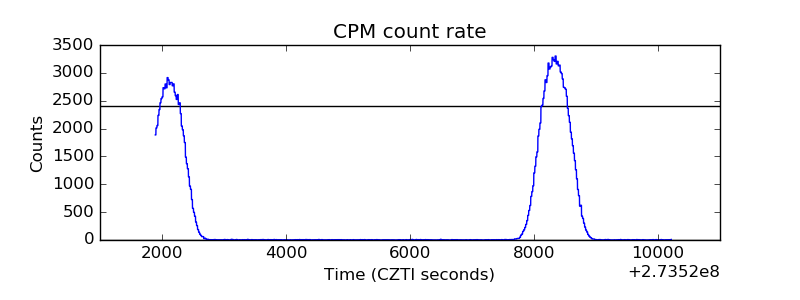 |
| CZT Counter | 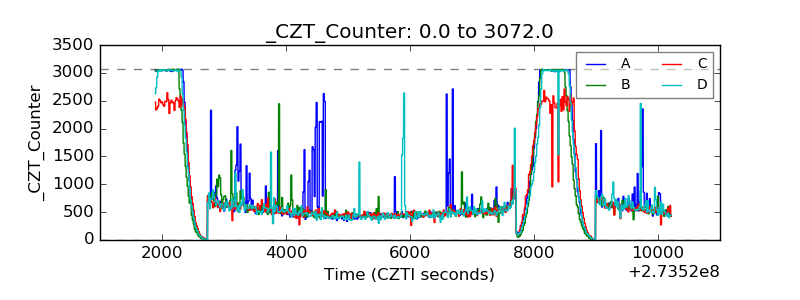 |
| +2.5 Volts monitor | 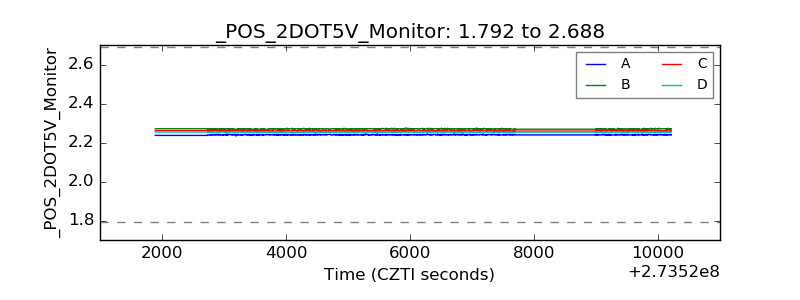 |
| +5 Volts monitor |  |
| _ROLL_ROT | 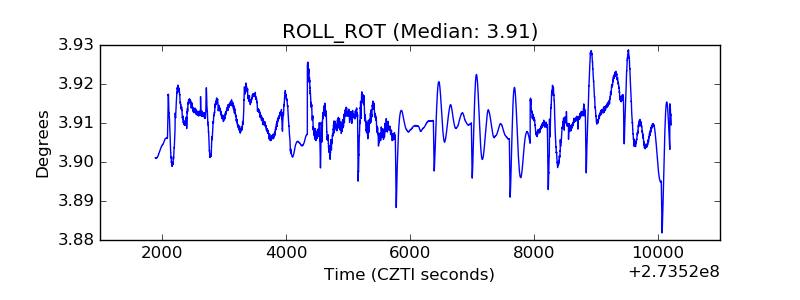 |
| _Roll_DEC | 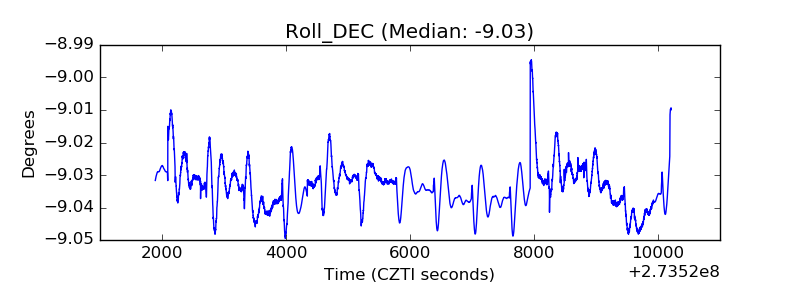 |
| _Roll_RA | 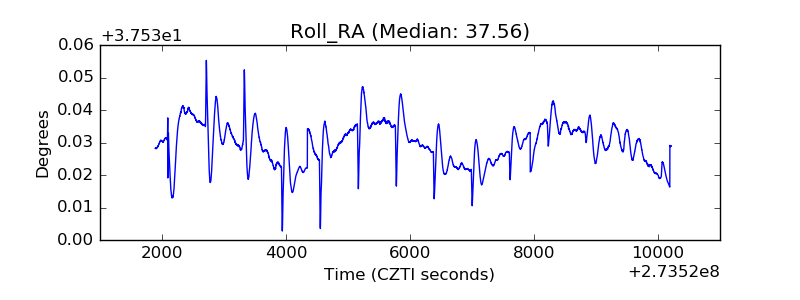 |
| Veto Counter | 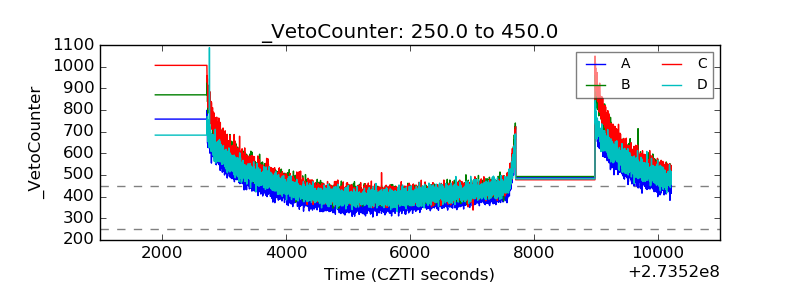 |