| Param | Original file | Final file |
|---|---|---|
| Filename | modeM0/AS1A04_143T01_9000002344_15834cztM0_level2.evt | modeM0/AS1A04_143T01_9000002344_15834cztM0_level2_quad_clean.evt |
| Size (bytes) | 505,157,760 | 104,929,920 |
| Size | 481.8 MB | 100.1 MB |
| Events in quadrant A | 3,917,285 | 676,771 |
| Events in quadrant B | 3,677,038 | 709,059 |
| Events in quadrant C | 3,657,101 | 672,297 |
| Events in quadrant D | 3,592,668 | 652,545 |
| Mode SS | |||
|---|---|---|---|
| Quadrant | BADHDUFLAG | Total packets | Discarded packets |
| A | 0 | 138 | 0 |
| B | 0 | 138 | 0 |
| C | 0 | 138 | 0 |
| D | 0 | 138 | 0 |
| Mode M0 | |||
|---|---|---|---|
| Quadrant | BADHDUFLAG | Total packets | Discarded packets |
| A | 0 | 15955 | 3 |
| B | 0 | 15208 | 2 |
| C | 0 | 14907 | 2 |
| D | 0 | 14998 | 2 |
| Mode M9 | |||
|---|---|---|---|
| Quadrant | BADHDUFLAG | Total packets | Discarded packets |
| A | 0 | 26 | 0 |
| B | 0 | 26 | 0 |
| C | 0 | 26 | 0 |
| D | 0 | 26 | 0 |
| Quadrant | Total seconds | Saturated seconds | Saturation percentage |
|---|---|---|---|
| A | 6703 | 138 | 2.058780% |
| B | 6703 | 82 | 1.223333% |
| C | 6703 | 106 | 1.581381% |
| D | 6703 | 45 | 0.671341% |
Noise dominated data is calculated using 1-second bins in cleaned event files. If a bin has >2000 counts, and if more than 50% of those come from <1% of pixels, then it is considered to be noise-dominated and hence unusable.
| Quadrant | # 1 sec bins | Bins with >0 counts | Bins with >2000 counts | High rate bins dominated by noise | Noise dominated (total time) | Noise dominated (detector-on time) | Marked lightcurve |
|---|---|---|---|---|---|---|---|
| A | 9344 | 6706 | 44 | 44 | 0.47% | 0.66% | 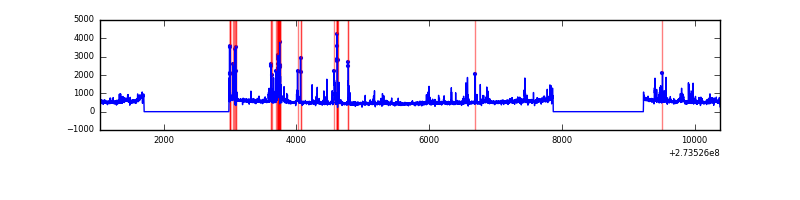 |
| B | 9344 | 6706 | 3 | 3 | 0.03% | 0.04% | 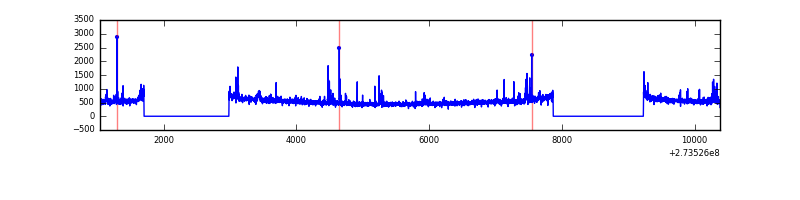 |
| C | 9344 | 6706 | 5 | 5 | 0.05% | 0.07% | 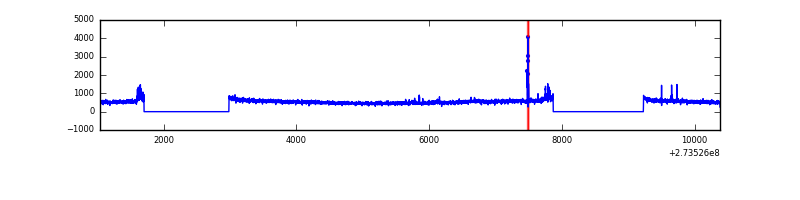 |
| D | 9344 | 6706 | 9 | 9 | 0.10% | 0.13% | 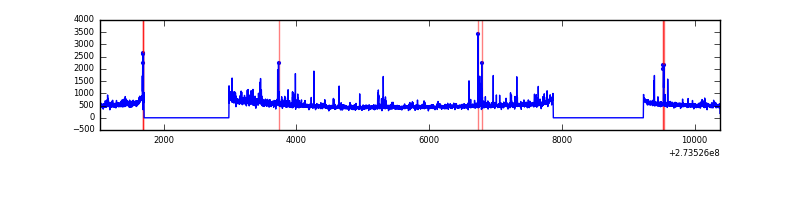 |
Top three noisy pixels from each quadrant. If the there are fewer than three noisy pixels in the level2.evt file, extra rows are filled as -1
| Pixel properties | Quadrant properties | ||||||
|---|---|---|---|---|---|---|---|
| Quadrant | DetID | PixID | Counts | Sigma | Mean | Median | Sigma |
| A | 15 | 239 | 364964 | 2053.24 | 876 | 857 | 177.3 |
| A | 14 | 239 | 146533 | 821.49 | 876 | 857 | 177.3 |
| A | 15 | 157 | 27126 | 148.13 | 876 | 857 | 177.3 |
| B | 6 | 36 | 37636 | 217.98 | 893 | 873 | 168.7 |
| B | 3 | 209 | 35144 | 203.2 | 893 | 873 | 168.7 |
| B | 4 | 173 | 32509 | 187.58 | 893 | 873 | 168.7 |
| C | 14 | 238 | 132048 | 662.37 | 856 | 864 | 198.1 |
| C | 3 | 233 | 102463 | 512.99 | 856 | 864 | 198.1 |
| C | 10 | 22 | 65861 | 328.18 | 856 | 864 | 198.1 |
| D | 1 | 52 | 222229 | 1050.1 | 862 | 838 | 210.8 |
| D | 7 | 223 | 87144 | 409.37 | 862 | 838 | 210.8 |
| D | 2 | 234 | 25256 | 115.82 | 862 | 838 | 210.8 |
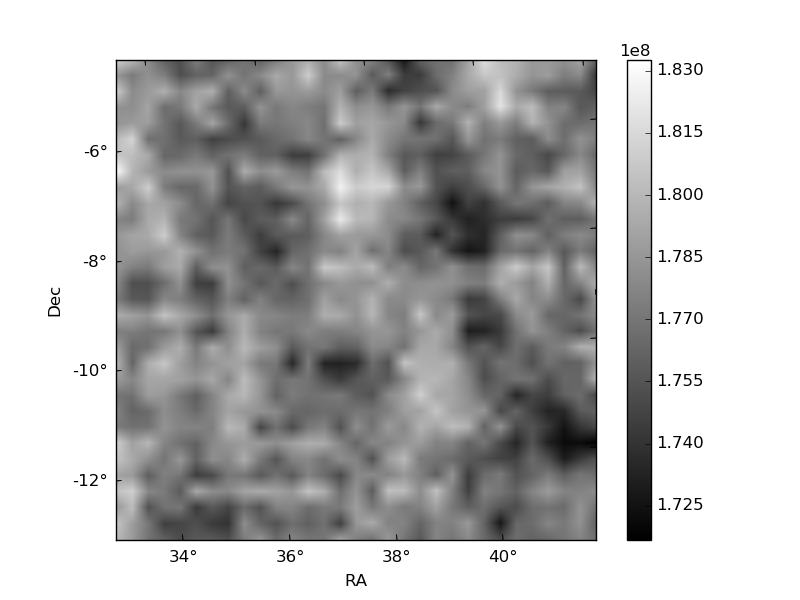
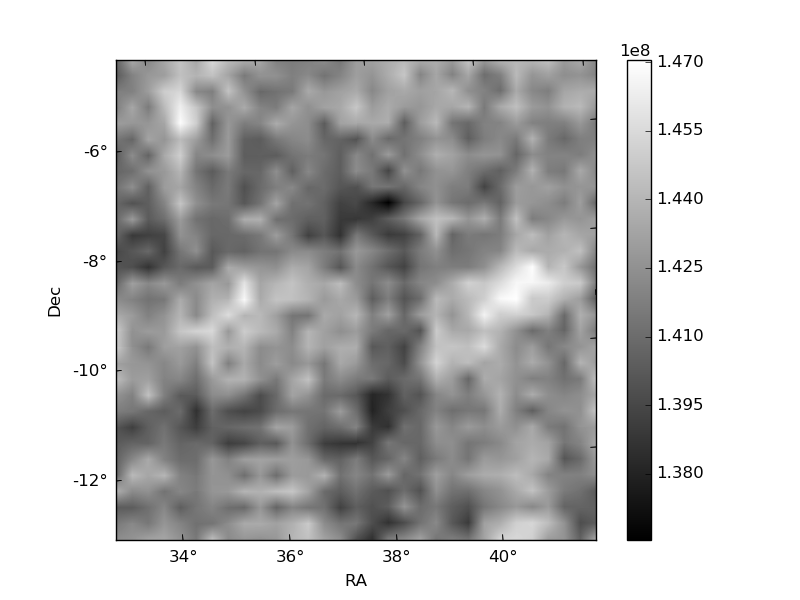
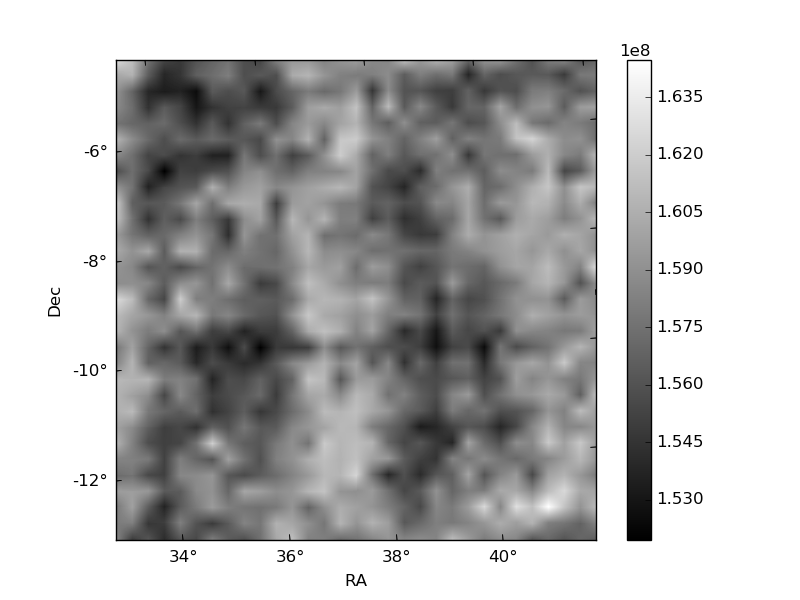
Histogram calculated using DETX and DETY for each event in the final _common_clean file
| Quadrant A | 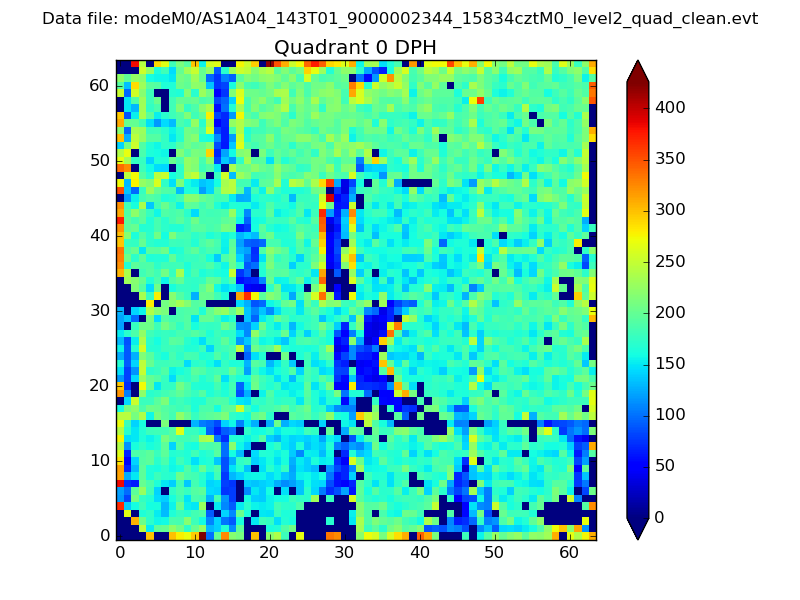 |
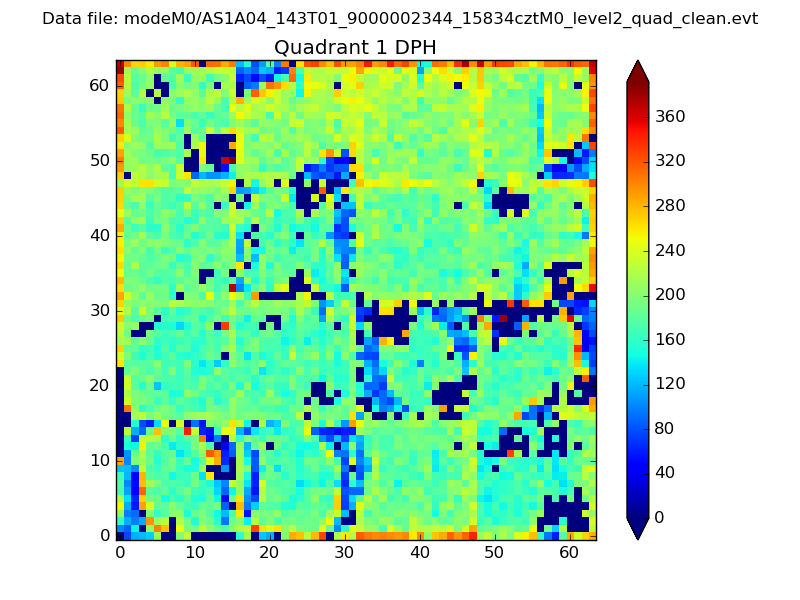 |
Quadrant B |
|---|---|---|---|
| Quadrant D | 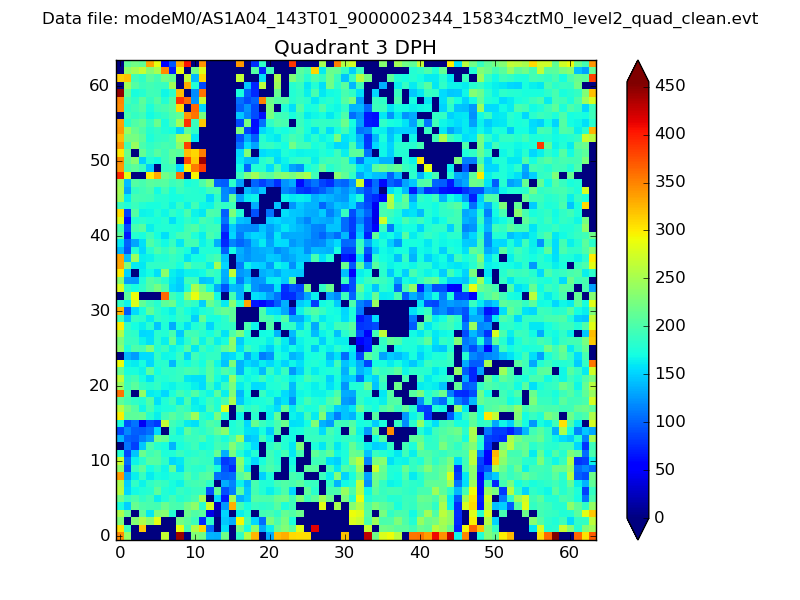 |
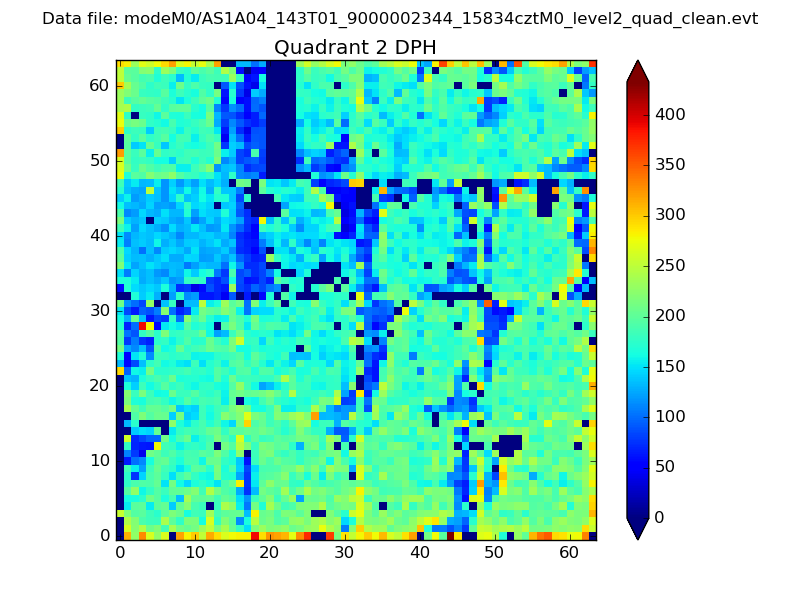 |
Quadrant C |
| Plot type | Count rate plots | Images |
|---|---|---|
| Comparison with Poisson distribution Blue bars denote a histogram of data divided into 1 sec bins. Red curve is a Poisson curve with rate = median count rate of data. |
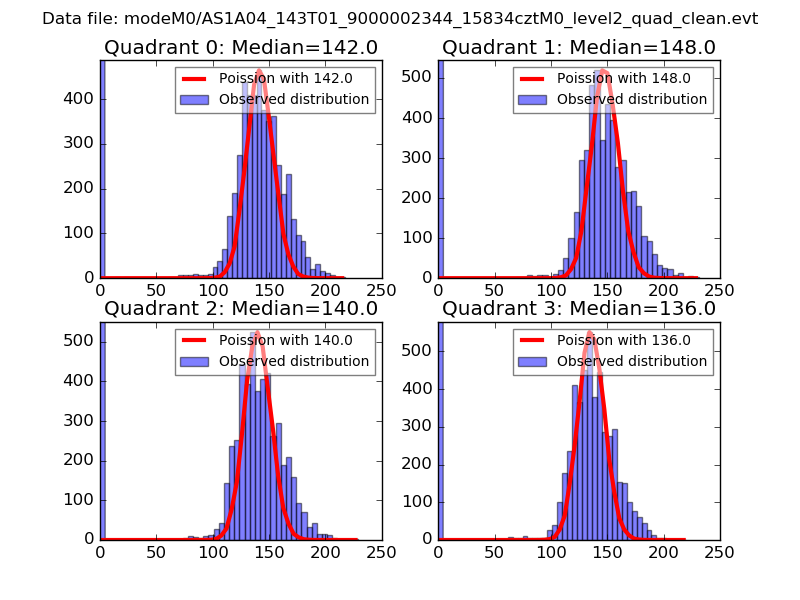 |
 |
| Quadrant-wise count rates Data is divided into 100 sec bins |
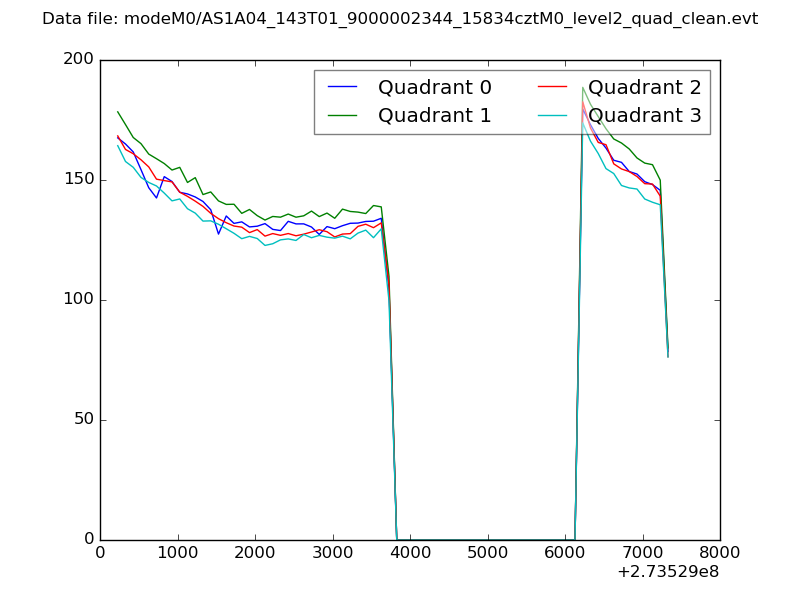 |
|
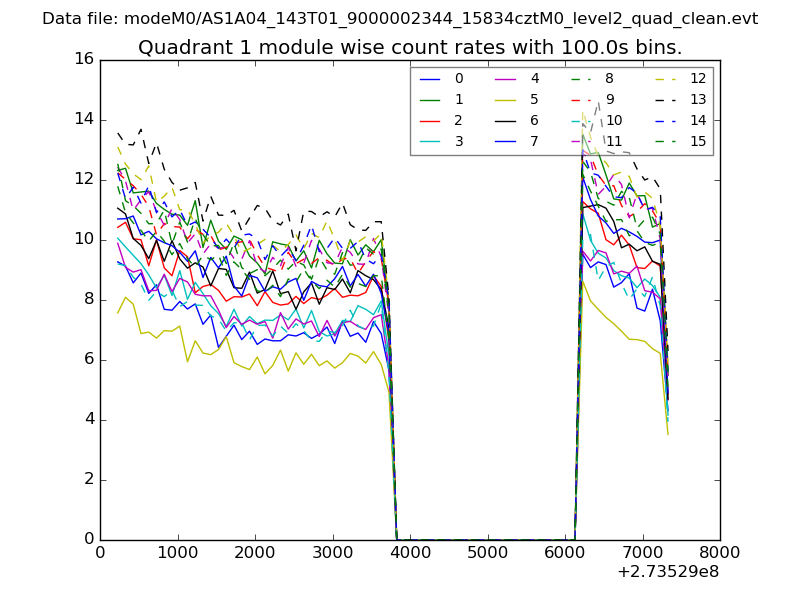
| Module-wise count rates for Quadrant A Data is divided into 100 sec bins |
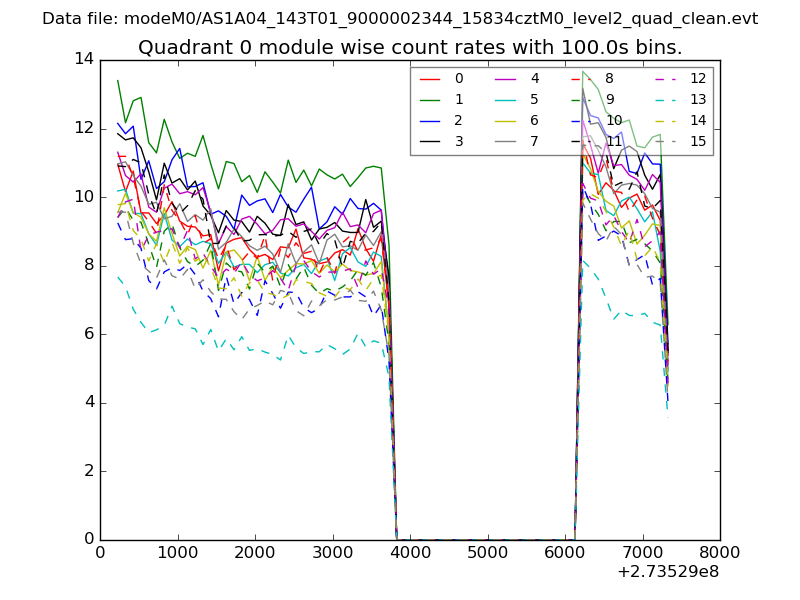 |
 |
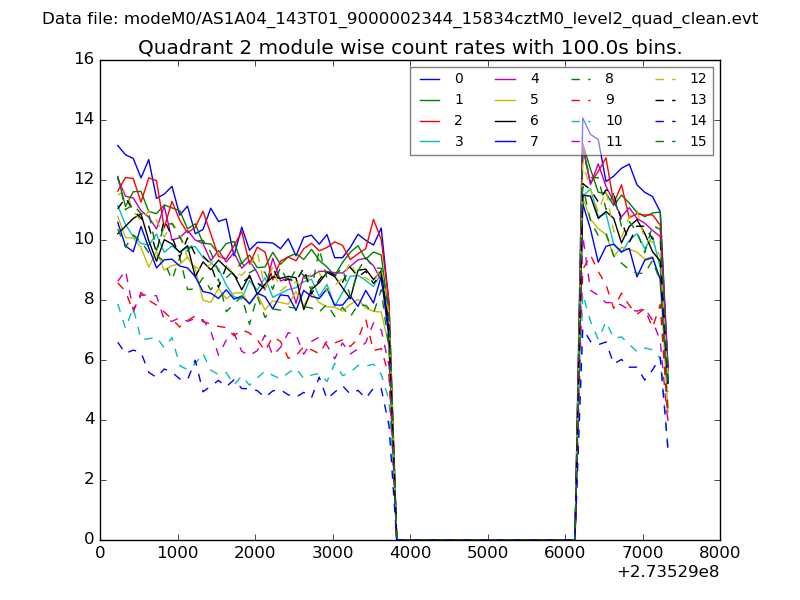
| Module-wise count rates for Quadrant B Data is divided into 100 sec bins |
 |
 |
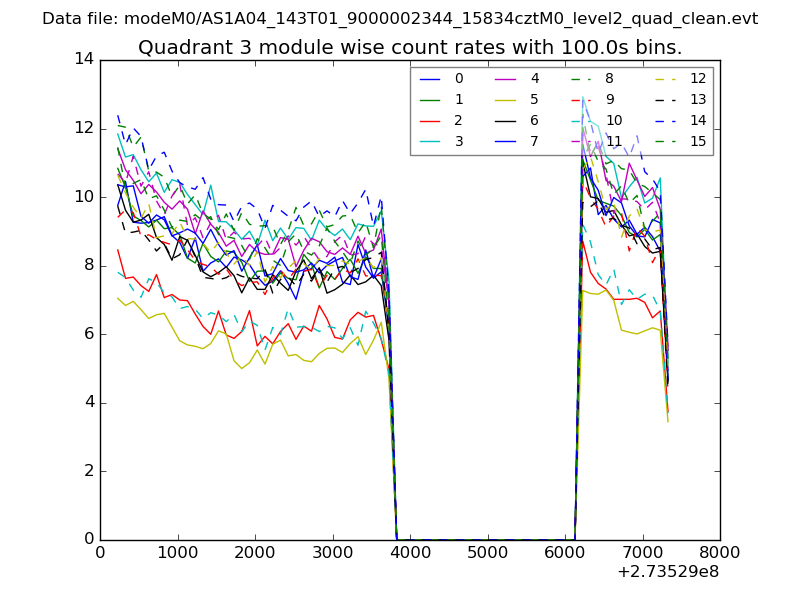
| Module-wise count rates for Quadrant C Data is divided into 100 sec bins |
 |
 |
| Module-wise count rates for Quadrant D Data is divided into 100 sec bins |
 |
 |
| Parameter | Plot |
|---|---|
| CZT HV Monitor | 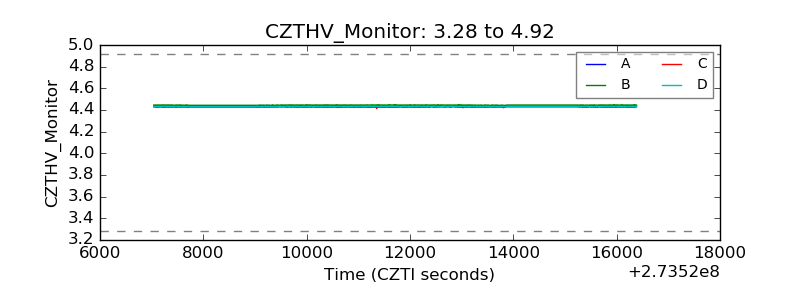 |
| D_VDD | 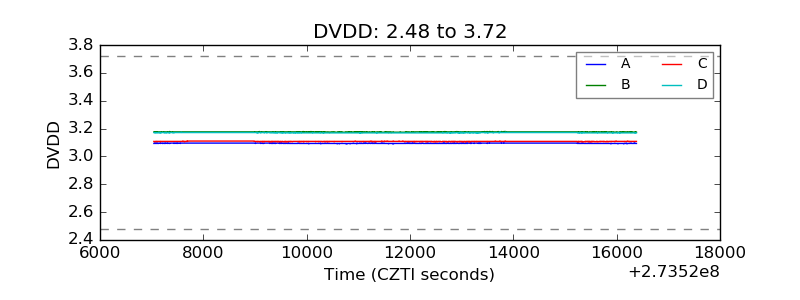 |
| Temperature 1 | 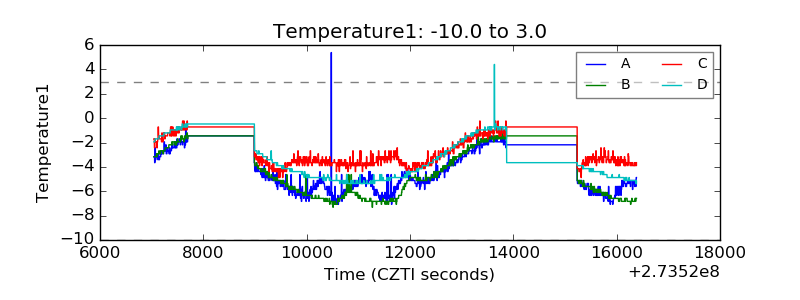 |
| Veto HV Monitor | 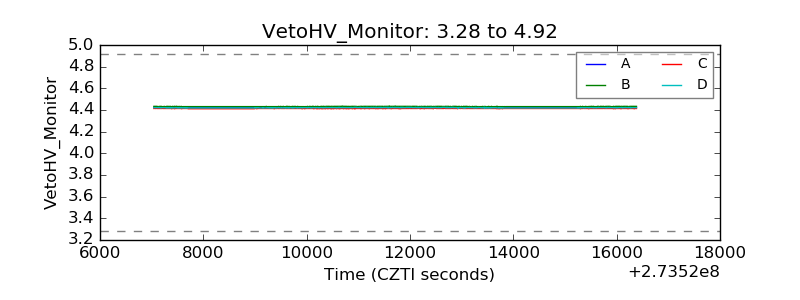 |
| Veto LLD | 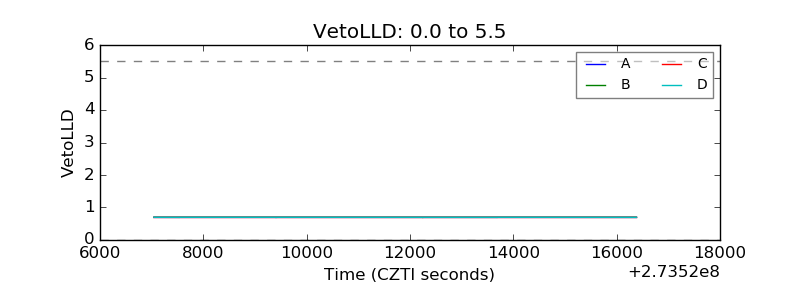 |
| Alpha Counter | 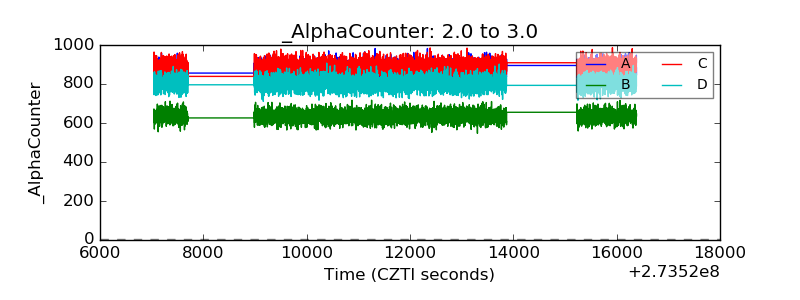 |
| _CPM_Rate | 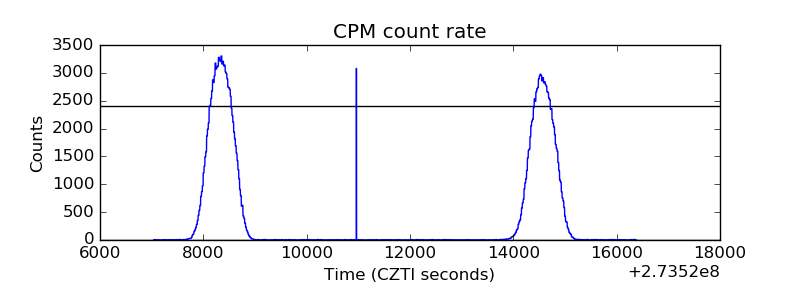 |
| CZT Counter | 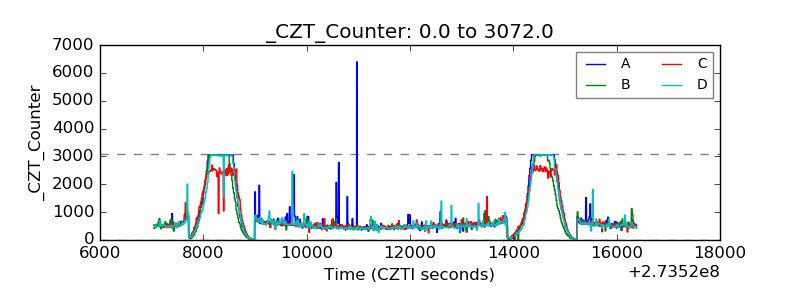 |
| +2.5 Volts monitor | 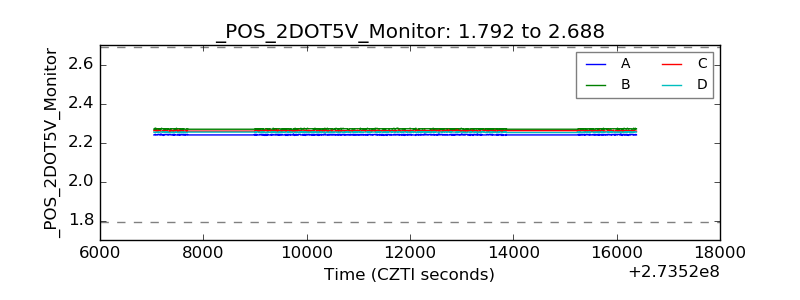 |
| +5 Volts monitor | 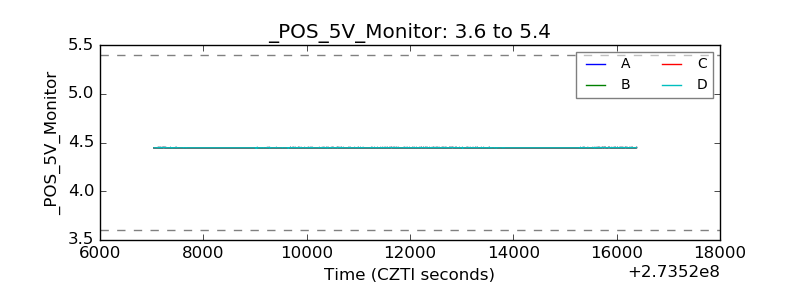 |
| _ROLL_ROT | 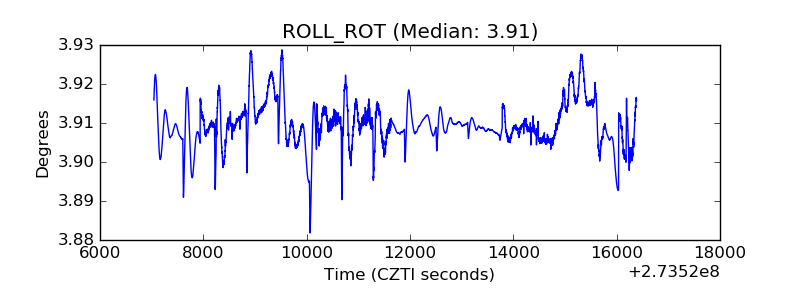 |
| _Roll_DEC | 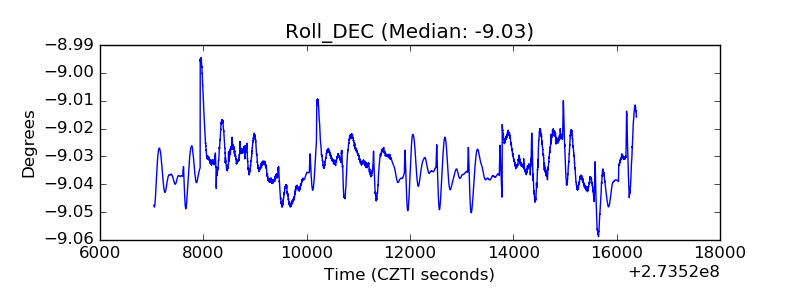 |
| _Roll_RA | 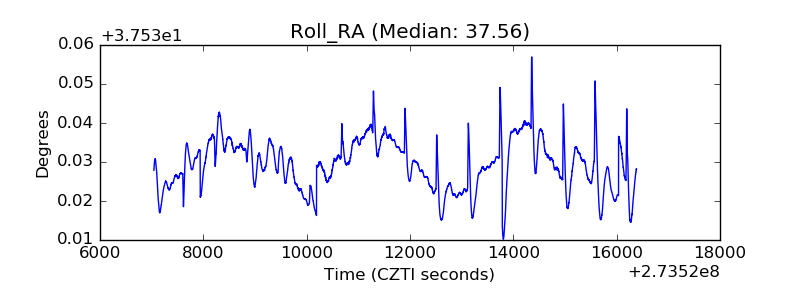 |
| Veto Counter |  |