| Param | Original file | Final file |
|---|---|---|
| Filename | modeM0/AS1A04_143T01_9000002344_15835cztM0_level2.evt | modeM0/AS1A04_143T01_9000002344_15835cztM0_level2_quad_clean.evt |
| Size (bytes) | 450,498,240 | 101,093,760 |
| Size | 429.6 MB | 96.4 MB |
| Events in quadrant A | 3,615,220 | 657,665 |
| Events in quadrant B | 3,348,622 | 688,861 |
| Events in quadrant C | 3,154,052 | 656,246 |
| Events in quadrant D | 3,112,746 | 634,496 |
| Mode SS | |||
|---|---|---|---|
| Quadrant | BADHDUFLAG | Total packets | Discarded packets |
| A | 0 | 124 | 0 |
| B | 0 | 124 | 0 |
| C | 0 | 124 | 0 |
| D | 0 | 124 | 0 |
| Mode M0 | |||
|---|---|---|---|
| Quadrant | BADHDUFLAG | Total packets | Discarded packets |
| A | 0 | 14643 | 3 |
| B | 0 | 13695 | 2 |
| C | 0 | 13023 | 2 |
| D | 0 | 13109 | 2 |
| Mode M9 | |||
|---|---|---|---|
| Quadrant | BADHDUFLAG | Total packets | Discarded packets |
| A | 0 | 19 | 0 |
| B | 0 | 19 | 0 |
| C | 0 | 19 | 0 |
| D | 0 | 20 | 0 |
| Quadrant | Total seconds | Saturated seconds | Saturation percentage |
|---|---|---|---|
| A | 6077 | 113 | 1.859470% |
| B | 6077 | 73 | 1.201251% |
| C | 6077 | 50 | 0.822774% |
| D | 6077 | 12 | 0.197466% |
Noise dominated data is calculated using 1-second bins in cleaned event files. If a bin has >2000 counts, and if more than 50% of those come from <1% of pixels, then it is considered to be noise-dominated and hence unusable.
| Quadrant | # 1 sec bins | Bins with >0 counts | Bins with >2000 counts | High rate bins dominated by noise | Noise dominated (total time) | Noise dominated (detector-on time) | Marked lightcurve |
|---|---|---|---|---|---|---|---|
| A | 7428 | 6079 | 44 | 44 | 0.59% | 0.72% | 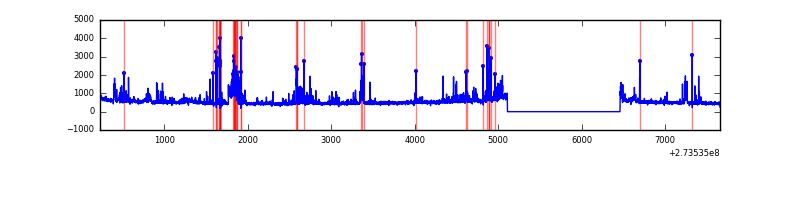 |
| B | 7428 | 6079 | 1 | 1 | 0.01% | 0.02% | 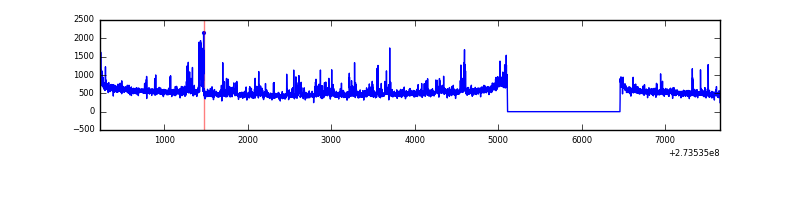 |
| C | 7428 | 6079 | 1 | 1 | 0.01% | 0.02% | 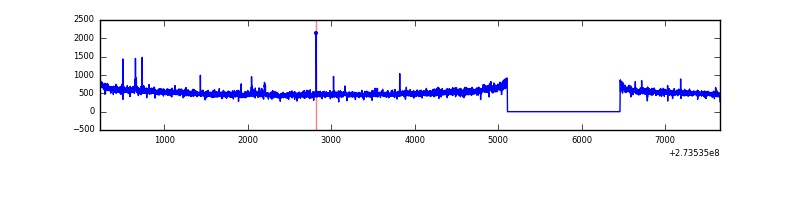 |
| D | 7428 | 6079 | 8 | 8 | 0.11% | 0.13% | 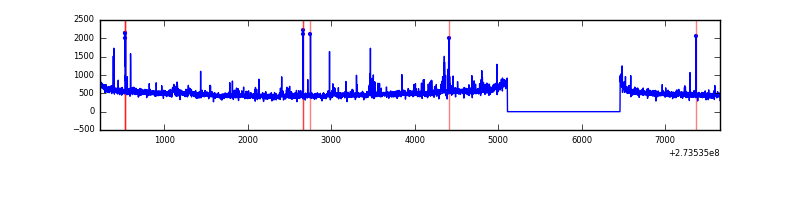 |
Top three noisy pixels from each quadrant. If the there are fewer than three noisy pixels in the level2.evt file, extra rows are filled as -1
| Pixel properties | Quadrant properties | ||||||
|---|---|---|---|---|---|---|---|
| Quadrant | DetID | PixID | Counts | Sigma | Mean | Median | Sigma |
| A | 15 | 239 | 409336 | 2618.67 | 776 | 761 | 156.0 |
| A | 14 | 239 | 209673 | 1338.98 | 776 | 761 | 156.0 |
| A | 0 | 226 | 6845 | 38.99 | 776 | 761 | 156.0 |
| B | 5 | 65 | 126326 | 844.49 | 792 | 775 | 148.7 |
| B | 10 | 245 | 46800 | 309.57 | 792 | 775 | 148.7 |
| B | 4 | 173 | 25523 | 166.46 | 792 | 775 | 148.7 |
| C | 14 | 238 | 116191 | 652.59 | 761 | 769 | 176.9 |
| C | 3 | 233 | 26392 | 144.87 | 761 | 769 | 176.9 |
| C | 0 | 207 | 16832 | 90.82 | 761 | 769 | 176.9 |
| D | 1 | 52 | 149175 | 800.83 | 763 | 744 | 185.3 |
| D | 7 | 223 | 70241 | 374.96 | 763 | 744 | 185.3 |
| D | 2 | 234 | 23421 | 122.35 | 763 | 744 | 185.3 |
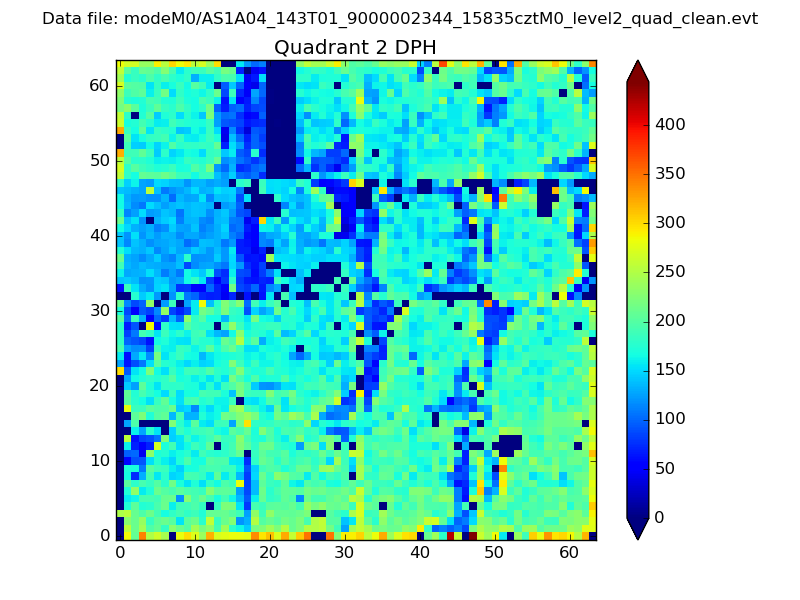
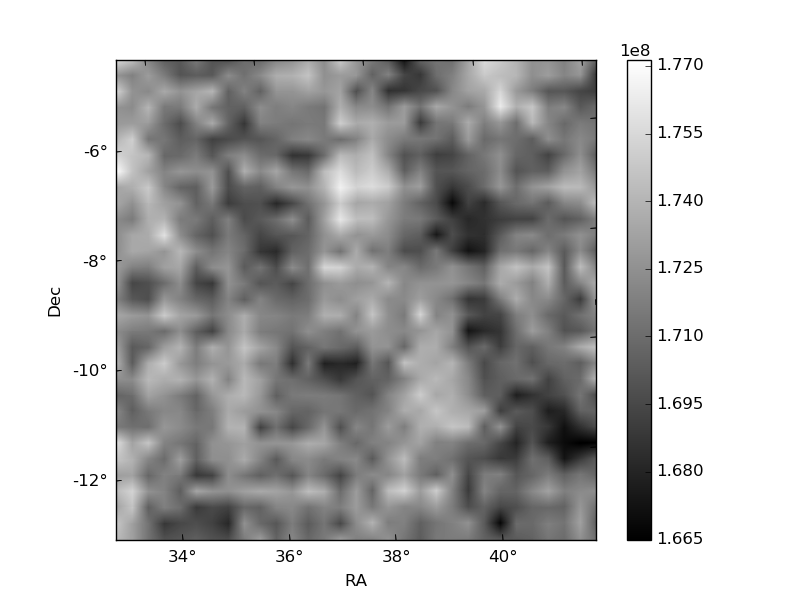
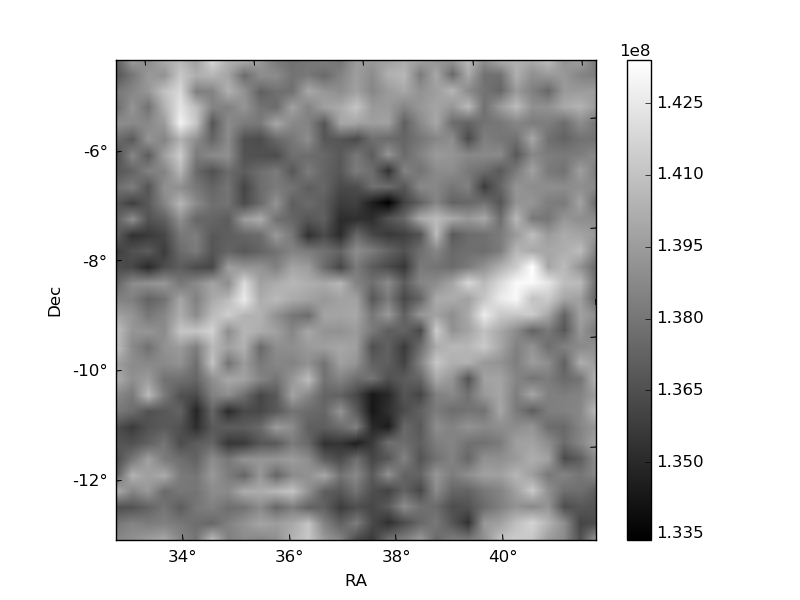
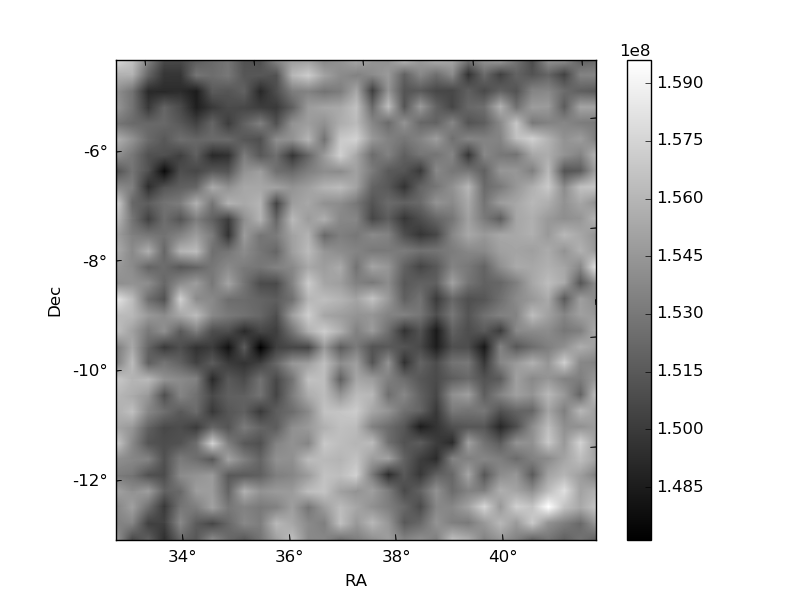
Histogram calculated using DETX and DETY for each event in the final _common_clean file
| Quadrant A | 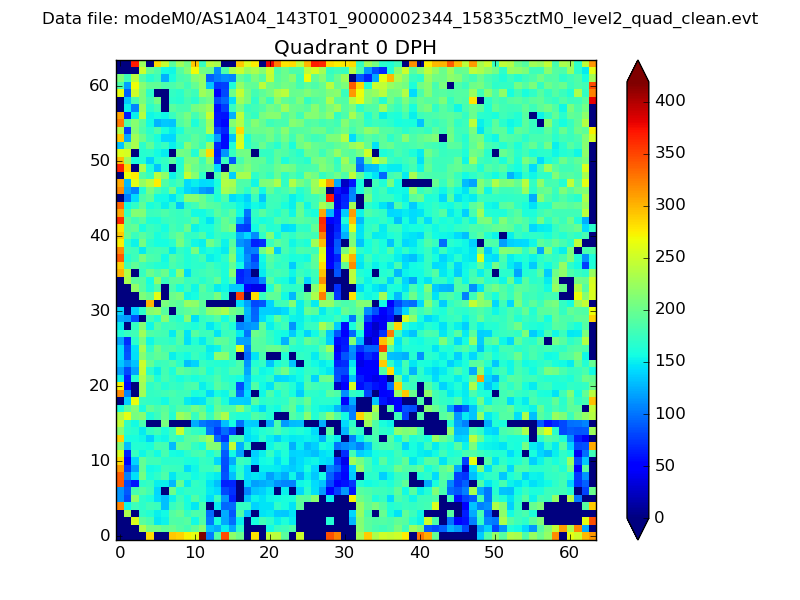 |
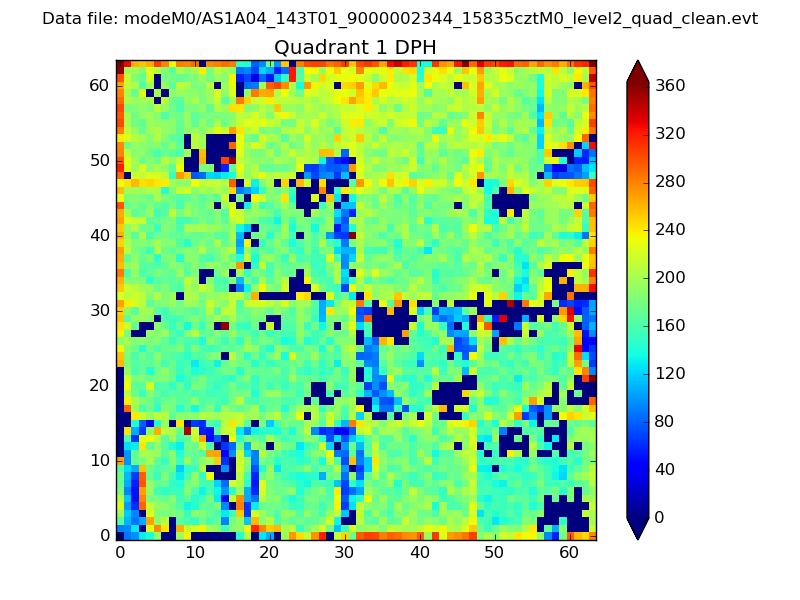 |
Quadrant B |
|---|---|---|---|
| Quadrant D | 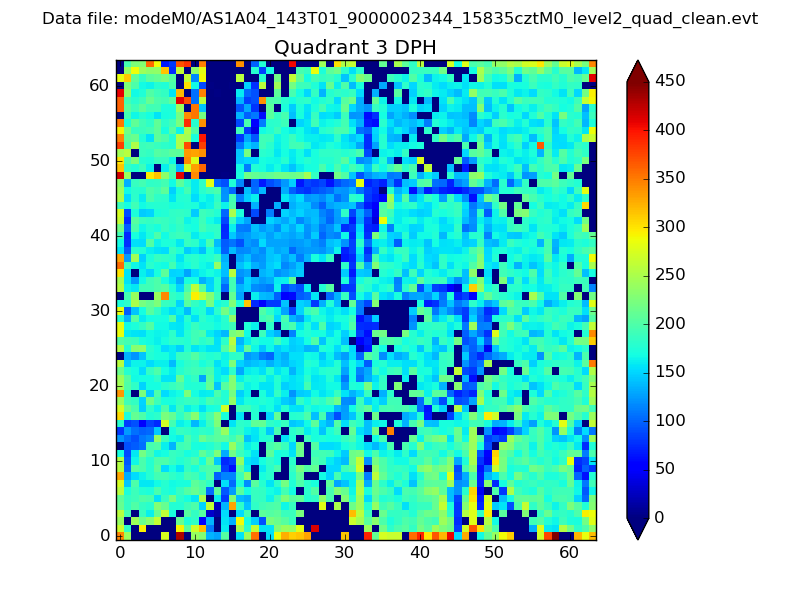 |
 |
Quadrant C |
| Plot type | Count rate plots | Images |
|---|---|---|
| Comparison with Poisson distribution Blue bars denote a histogram of data divided into 1 sec bins. Red curve is a Poisson curve with rate = median count rate of data. |
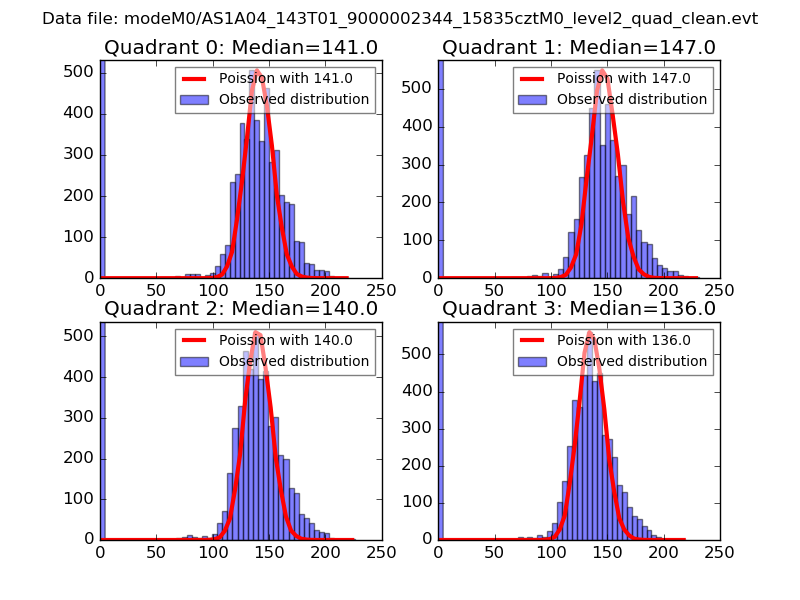 |
 |
| Quadrant-wise count rates Data is divided into 100 sec bins |
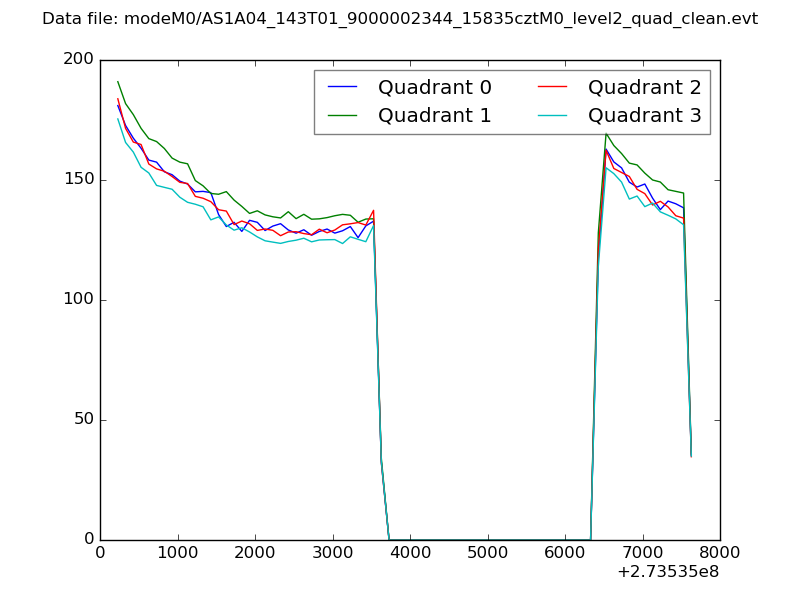 |
|
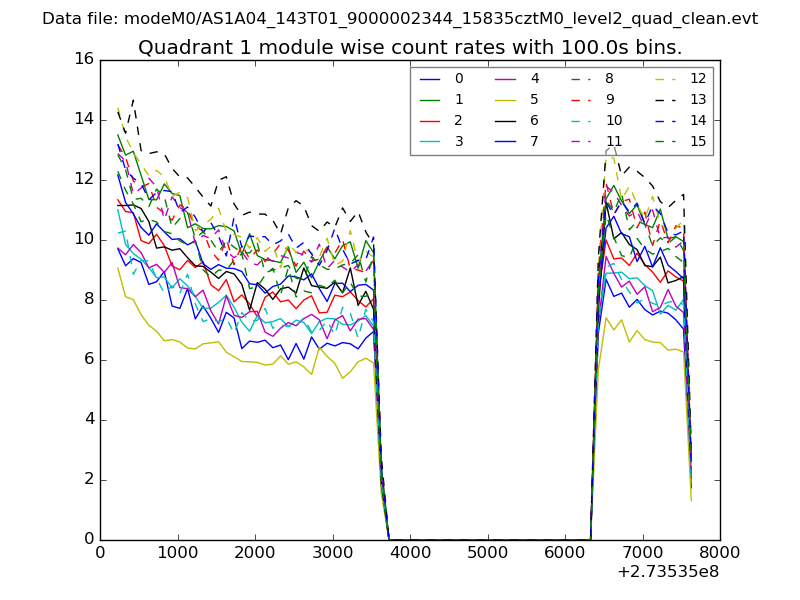
| Module-wise count rates for Quadrant A Data is divided into 100 sec bins |
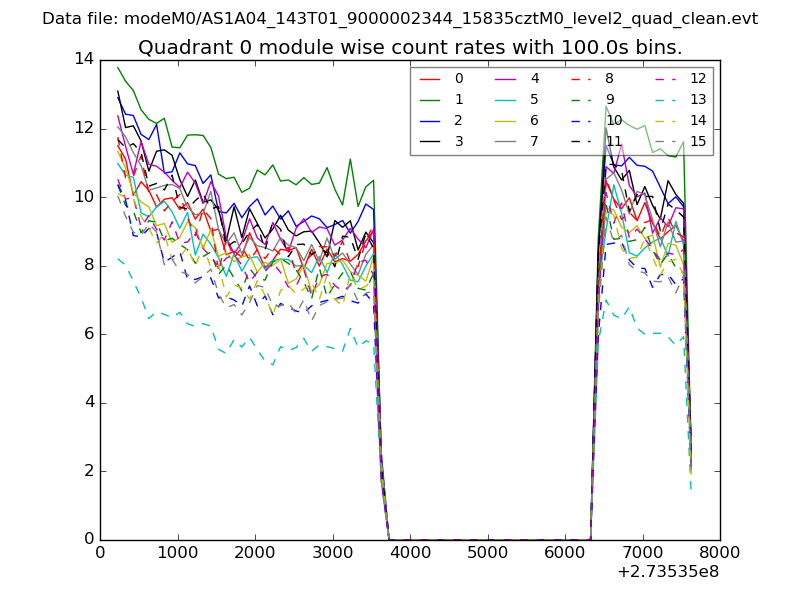 |
 |
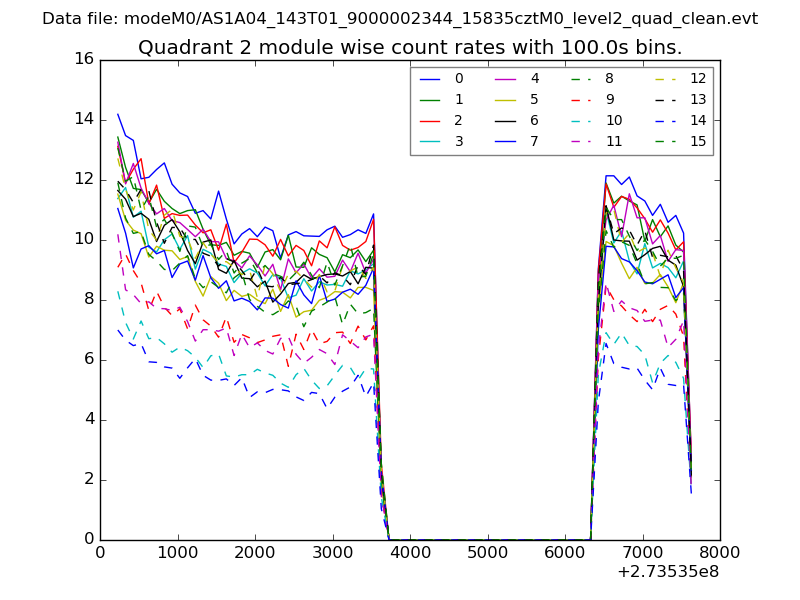
| Module-wise count rates for Quadrant B Data is divided into 100 sec bins |
 |
 |
| Module-wise count rates for Quadrant C Data is divided into 100 sec bins |
 |
 |
| Module-wise count rates for Quadrant D Data is divided into 100 sec bins |
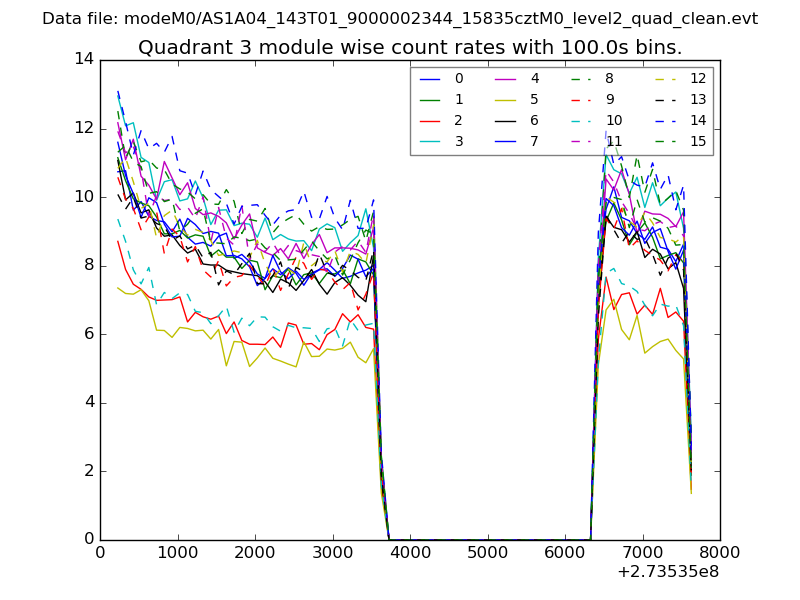 |
 |
| Parameter | Plot |
|---|---|
| CZT HV Monitor | 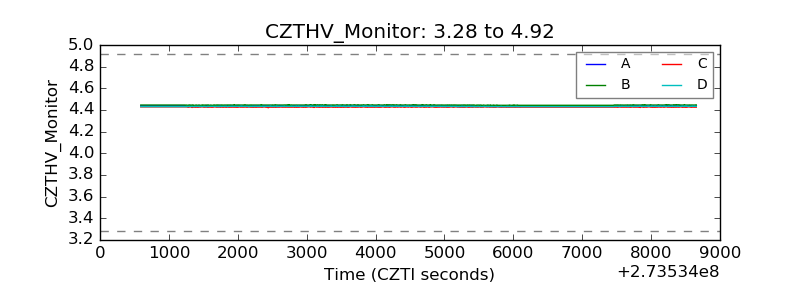 |
| D_VDD | 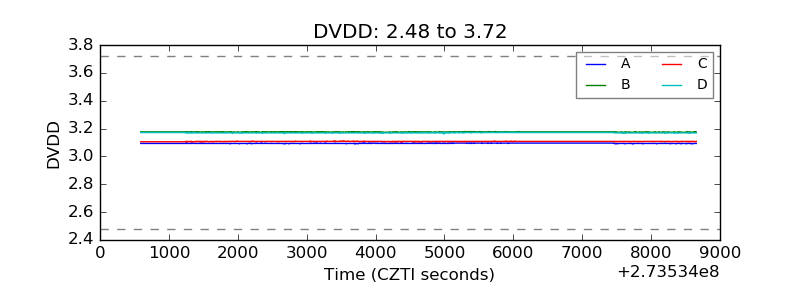 |
| Temperature 1 | 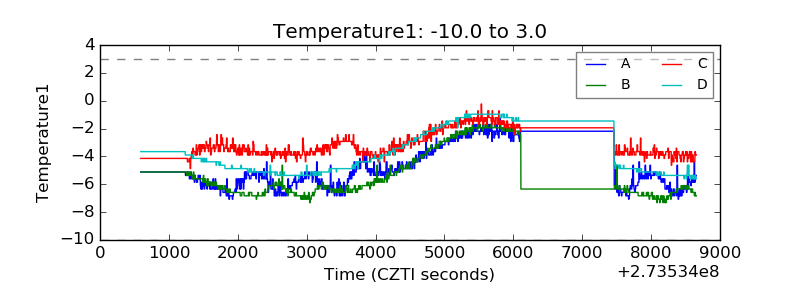 |
| Veto HV Monitor | 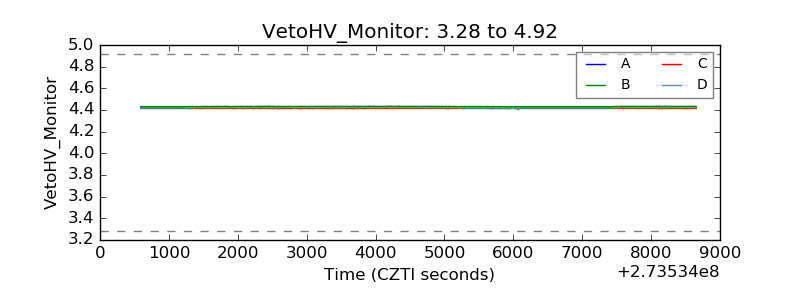 |
| Veto LLD | 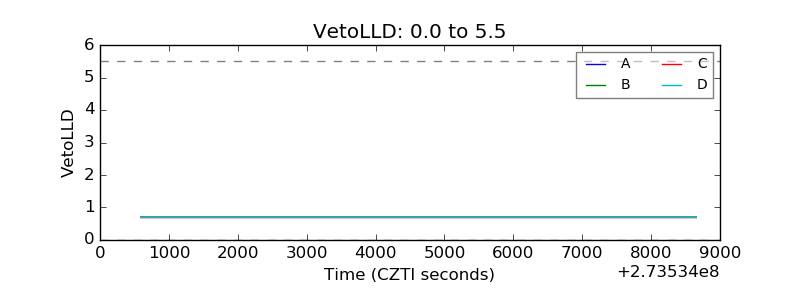 |
| Alpha Counter | 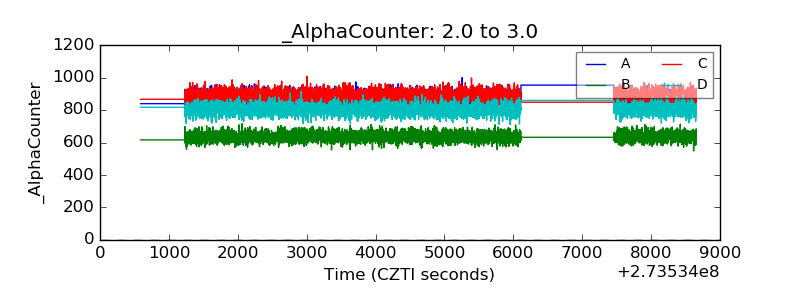 |
| _CPM_Rate | 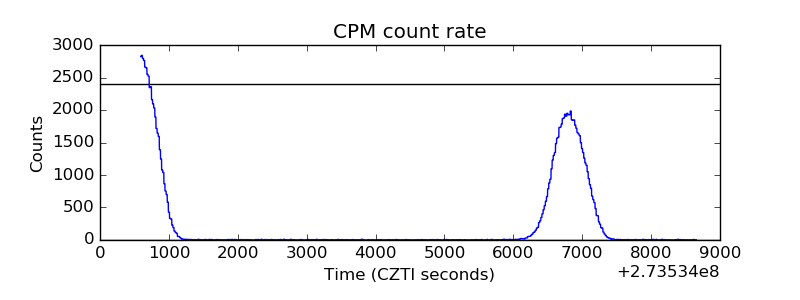 |
| CZT Counter | 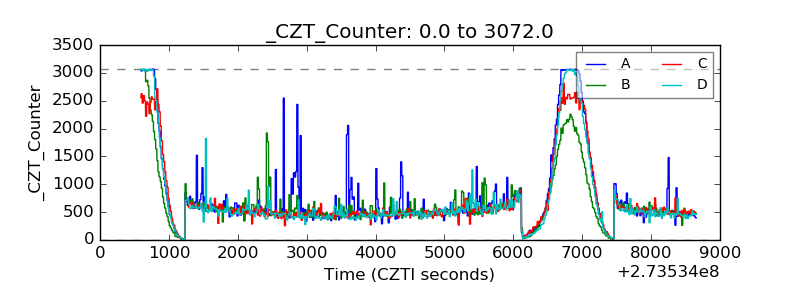 |
| +2.5 Volts monitor | 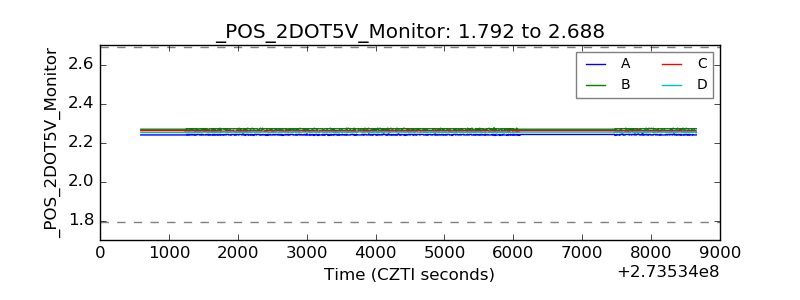 |
| +5 Volts monitor | 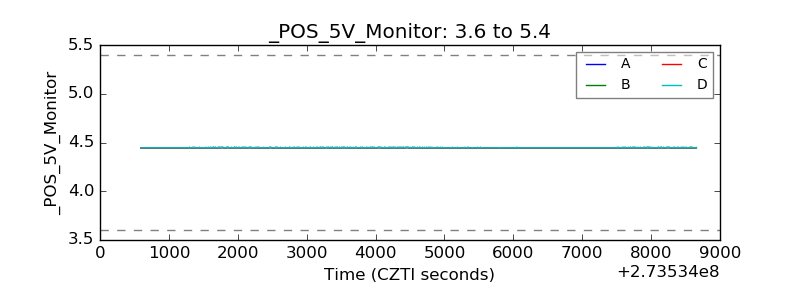 |
| _ROLL_ROT | 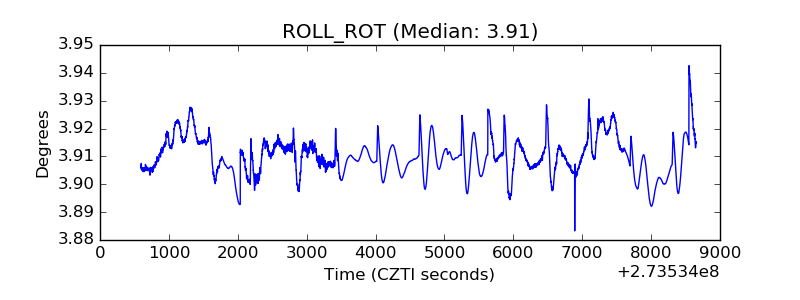 |
| _Roll_DEC | 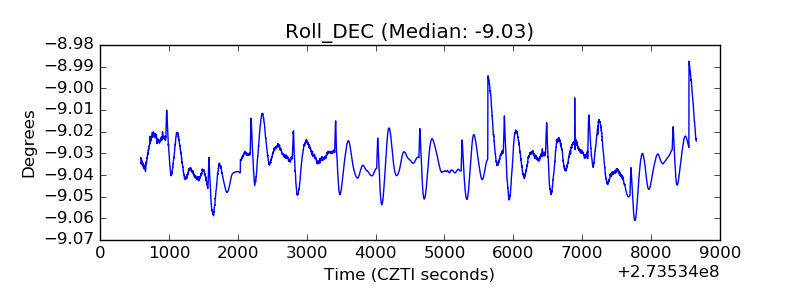 |
| _Roll_RA | 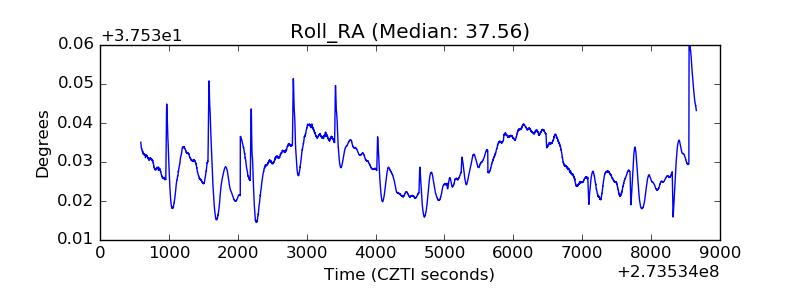 |
| Veto Counter | 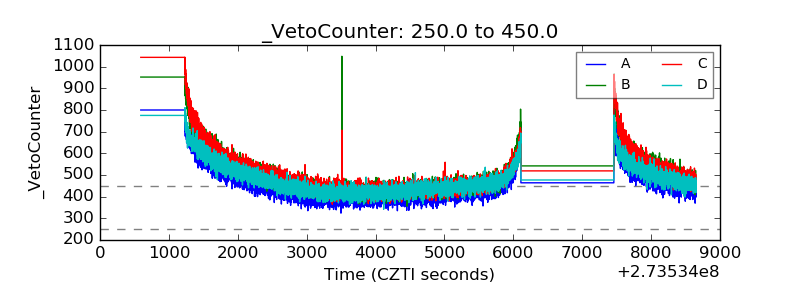 |