| Param | Original file | Final file |
|---|---|---|
| Filename | modeM0/AS1A04_143T01_9000002344_15837cztM0_level2.evt | modeM0/AS1A04_143T01_9000002344_15837cztM0_level2_quad_clean.evt |
| Size (bytes) | 1,016,052,480 | 173,064,960 |
| Size | 969.0 MB | 165.0 MB |
| Events in quadrant A | 8,630,128 | 1,066,769 |
| Events in quadrant B | 7,537,207 | 1,114,446 |
| Events in quadrant C | 6,849,459 | 1,061,907 |
| Events in quadrant D | 6,816,922 | 1,041,034 |
| Mode SS | |||
|---|---|---|---|
| Quadrant | BADHDUFLAG | Total packets | Discarded packets |
| A | 0 | 284 | 0 |
| B | 0 | 284 | 0 |
| C | 0 | 284 | 0 |
| D | 0 | 284 | 0 |
| Mode M0 | |||
|---|---|---|---|
| Quadrant | BADHDUFLAG | Total packets | Discarded packets |
| A | 0 | 34599 | 4 |
| B | 0 | 31248 | 3 |
| C | 0 | 29024 | 3 |
| D | 0 | 29572 | 3 |
| Mode M9 | |||
|---|---|---|---|
| Quadrant | BADHDUFLAG | Total packets | Discarded packets |
| A | 0 | 35 | 0 |
| B | 0 | 35 | 0 |
| C | 0 | 35 | 0 |
| D | 0 | 35 | 0 |
| Quadrant | Total seconds | Saturated seconds | Saturation percentage |
|---|---|---|---|
| A | 13859 | 647 | 4.668446% |
| B | 13859 | 373 | 2.691392% |
| C | 13859 | 163 | 1.176131% |
| D | 13859 | 51 | 0.367992% |
Noise dominated data is calculated using 1-second bins in cleaned event files. If a bin has >2000 counts, and if more than 50% of those come from <1% of pixels, then it is considered to be noise-dominated and hence unusable.
| Quadrant | # 1 sec bins | Bins with >0 counts | Bins with >2000 counts | High rate bins dominated by noise | Noise dominated (total time) | Noise dominated (detector-on time) | Marked lightcurve |
|---|---|---|---|---|---|---|---|
| A | 17375 | 13863 | 395 | 395 | 2.27% | 2.85% | 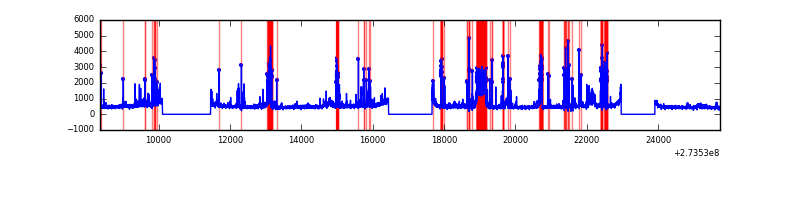 |
| B | 17375 | 13863 | 109 | 109 | 0.63% | 0.79% | 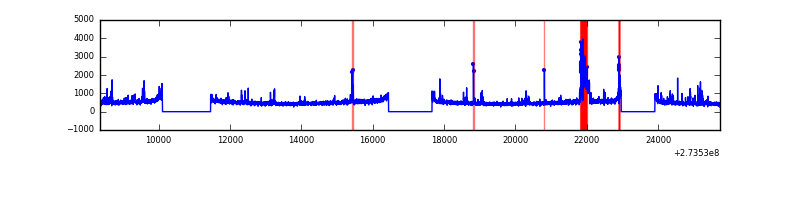 |
| C | 17375 | 13863 | 0 | 0 | 0.00% | 0.00% | 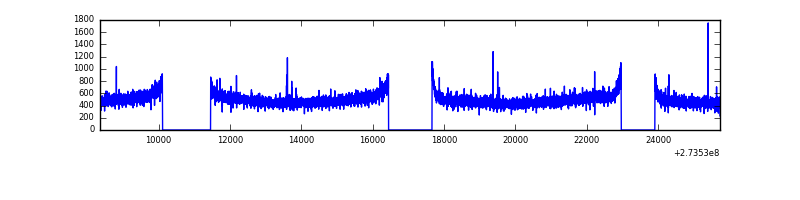 |
| D | 17375 | 13863 | 8 | 8 | 0.05% | 0.06% | 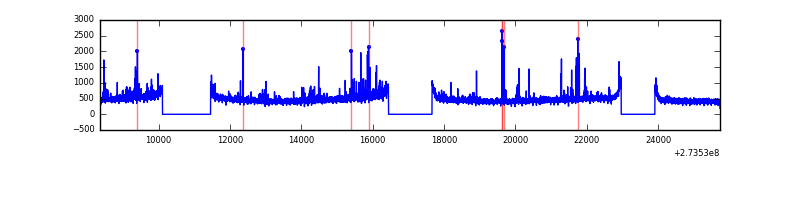 |
Top three noisy pixels from each quadrant. If the there are fewer than three noisy pixels in the level2.evt file, extra rows are filled as -1
| Pixel properties | Quadrant properties | ||||||
|---|---|---|---|---|---|---|---|
| Quadrant | DetID | PixID | Counts | Sigma | Mean | Median | Sigma |
| A | 15 | 239 | 1716300 | 4958.53 | 1718 | 1681 | 345.8 |
| A | 14 | 239 | 183174 | 524.86 | 1718 | 1681 | 345.8 |
| A | 15 | 157 | 107494 | 306.0 | 1718 | 1681 | 345.8 |
| B | 10 | 245 | 397220 | 1208.1 | 1739 | 1698 | 327.4 |
| B | 4 | 173 | 131282 | 395.81 | 1739 | 1698 | 327.4 |
| B | 4 | 48 | 57311 | 169.87 | 1739 | 1698 | 327.4 |
| C | 14 | 238 | 257270 | 655.54 | 1676 | 1690 | 389.9 |
| C | 3 | 233 | 27832 | 67.05 | 1676 | 1690 | 389.9 |
| C | 10 | 22 | 17348 | 40.16 | 1676 | 1690 | 389.9 |
| D | 1 | 52 | 253040 | 554.06 | 1690 | 1654 | 453.7 |
| D | 10 | 70 | 72525 | 156.2 | 1690 | 1654 | 453.7 |
| D | 2 | 234 | 52158 | 111.31 | 1690 | 1654 | 453.7 |
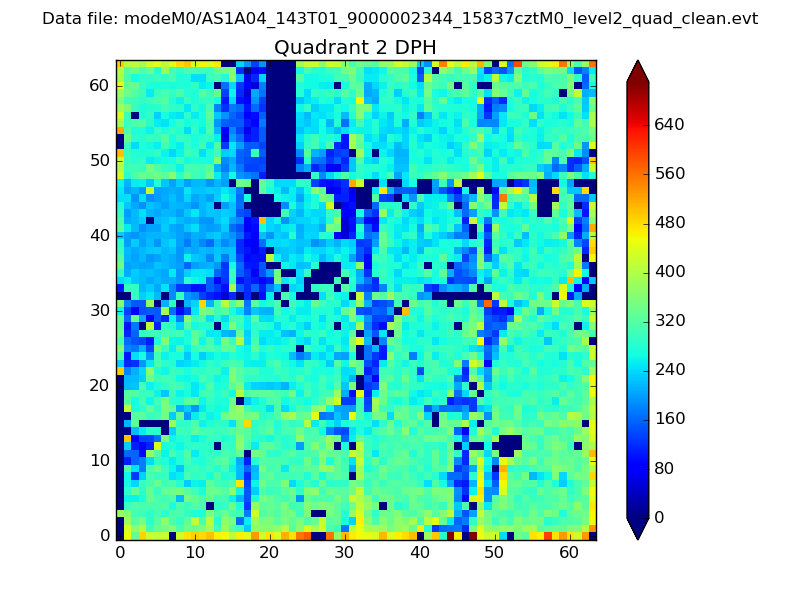
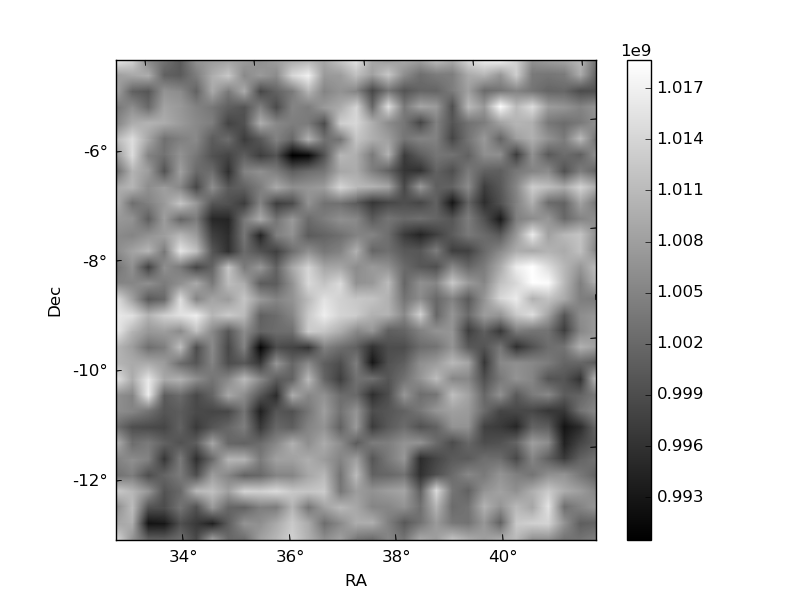
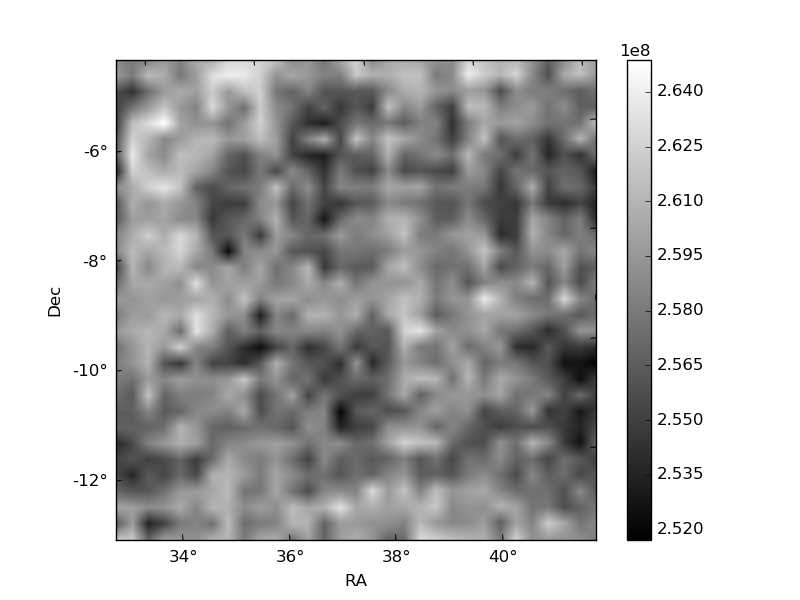
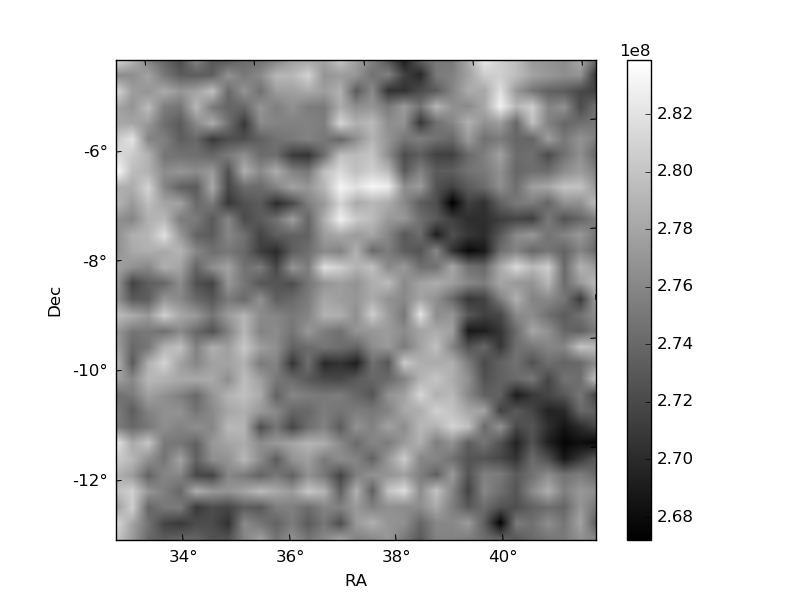
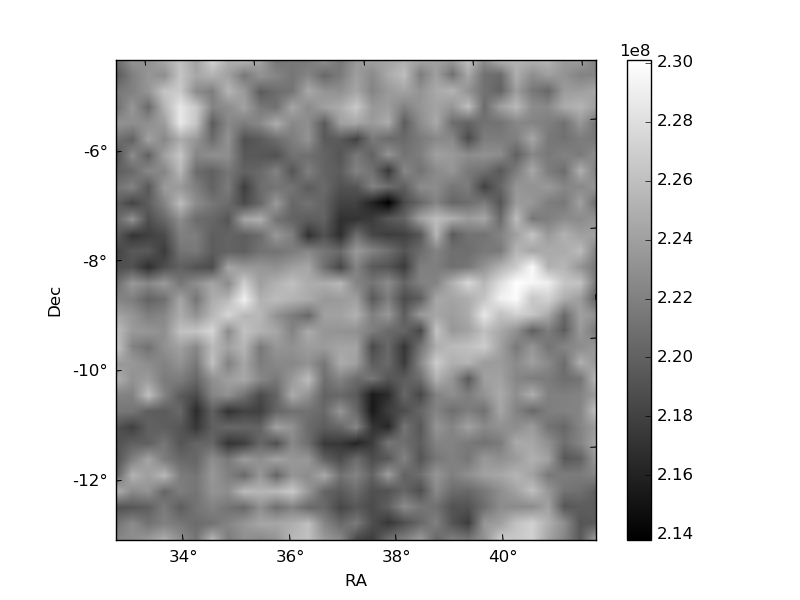
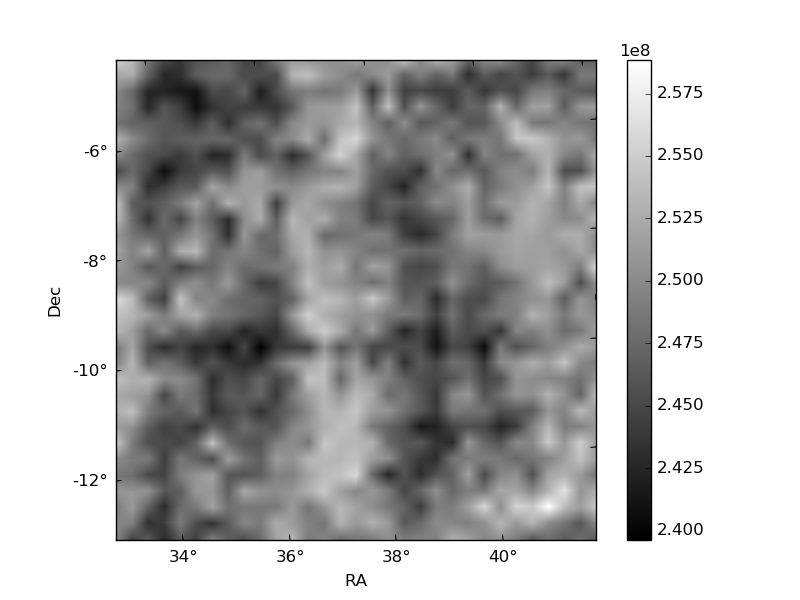
Histogram calculated using DETX and DETY for each event in the final _common_clean file
| Quadrant A | 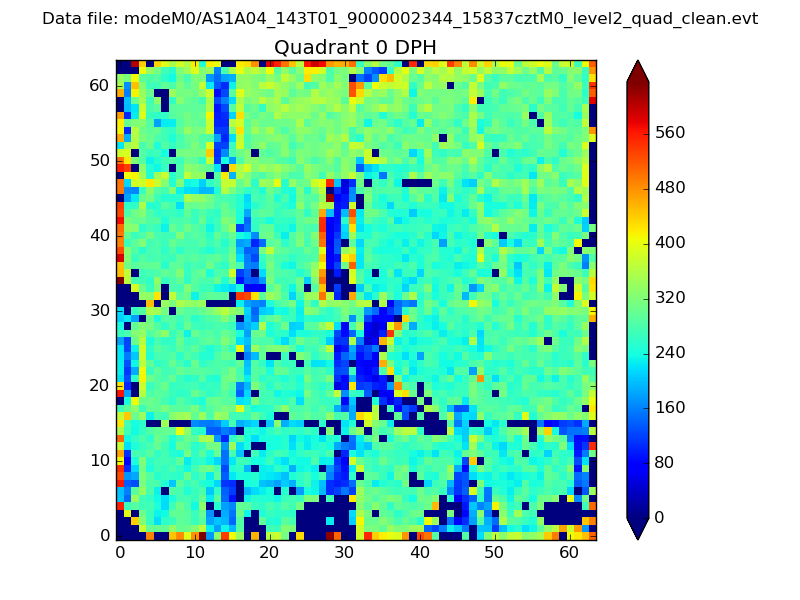 |
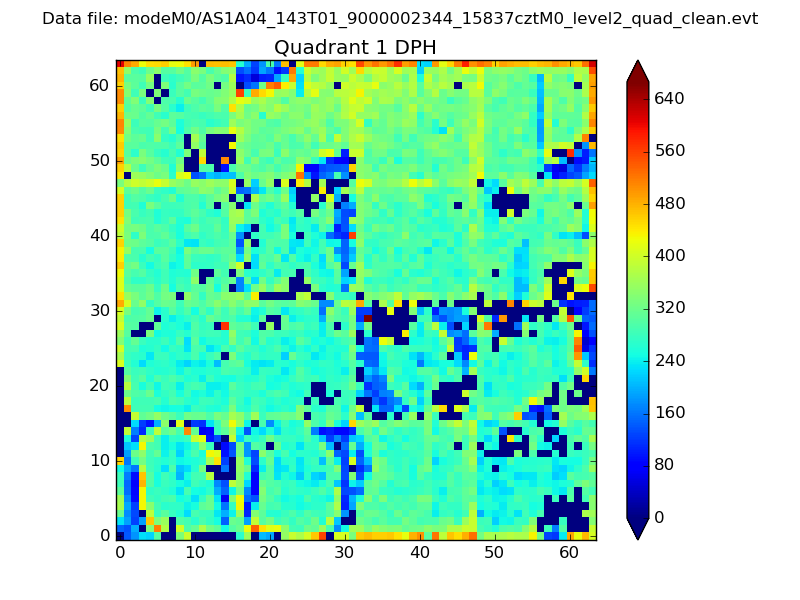 |
Quadrant B |
|---|---|---|---|
| Quadrant D | 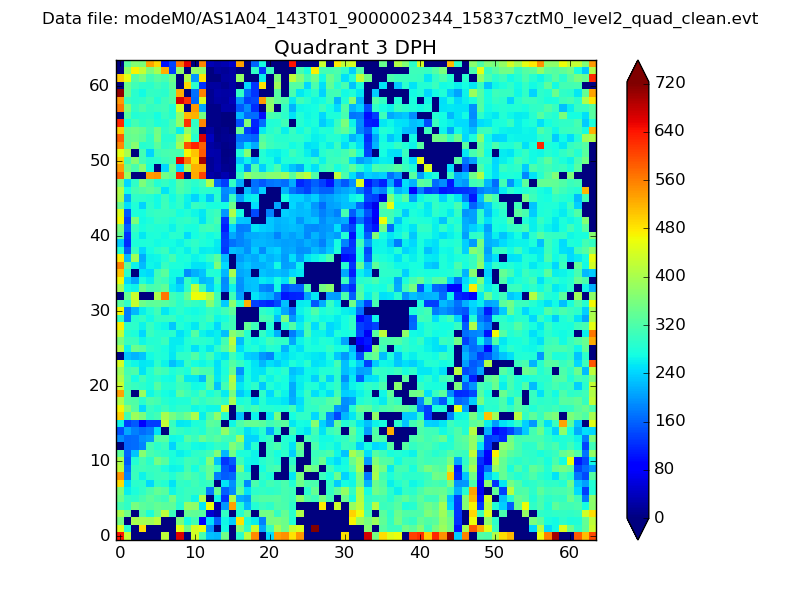 |
 |
Quadrant C |
| Plot type | Count rate plots | Images |
|---|---|---|
| Comparison with Poisson distribution Blue bars denote a histogram of data divided into 1 sec bins. Red curve is a Poisson curve with rate = median count rate of data. |
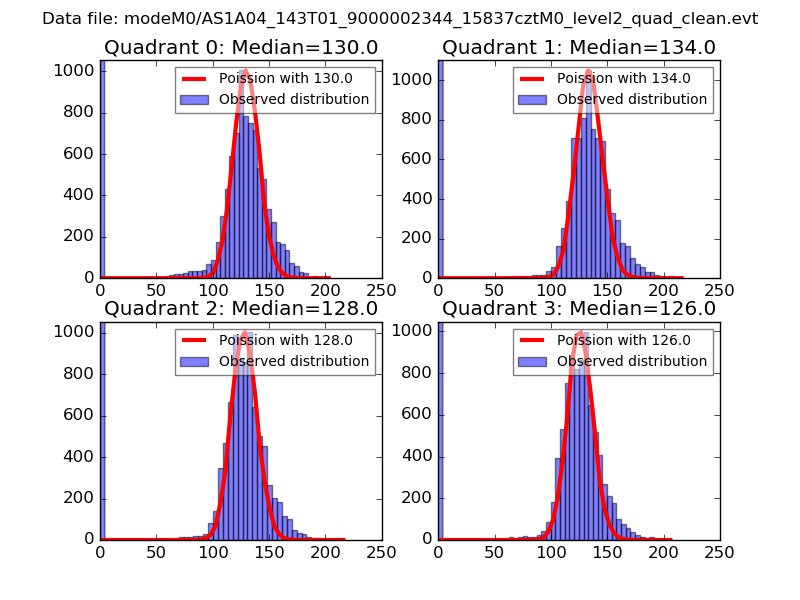 |
 |
| Quadrant-wise count rates Data is divided into 100 sec bins |
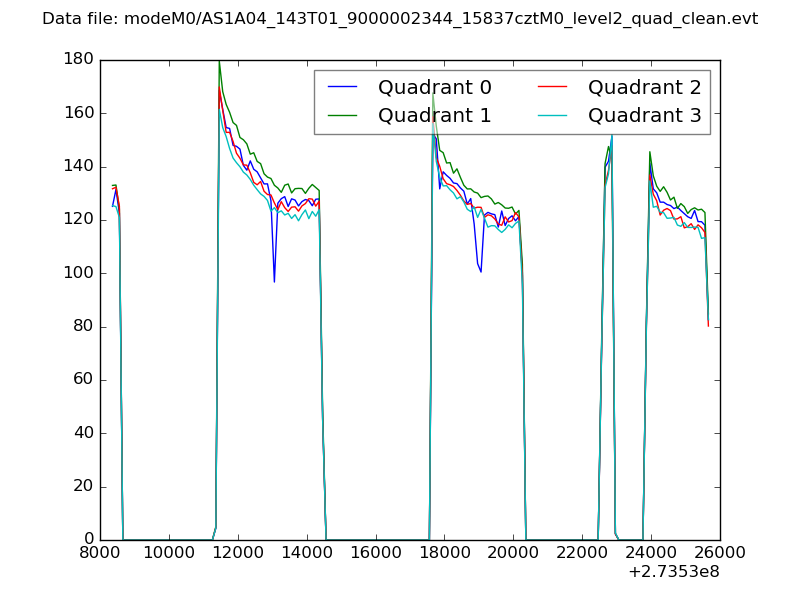 |
|
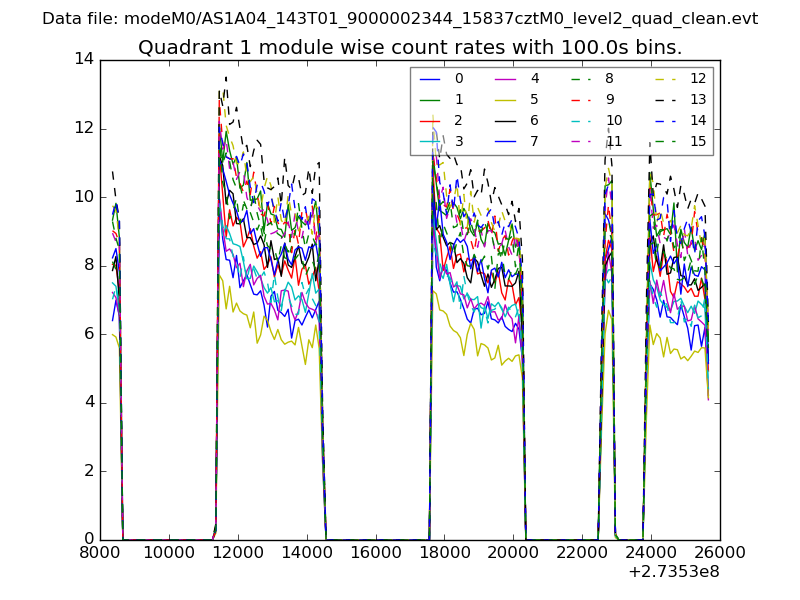
| Module-wise count rates for Quadrant A Data is divided into 100 sec bins |
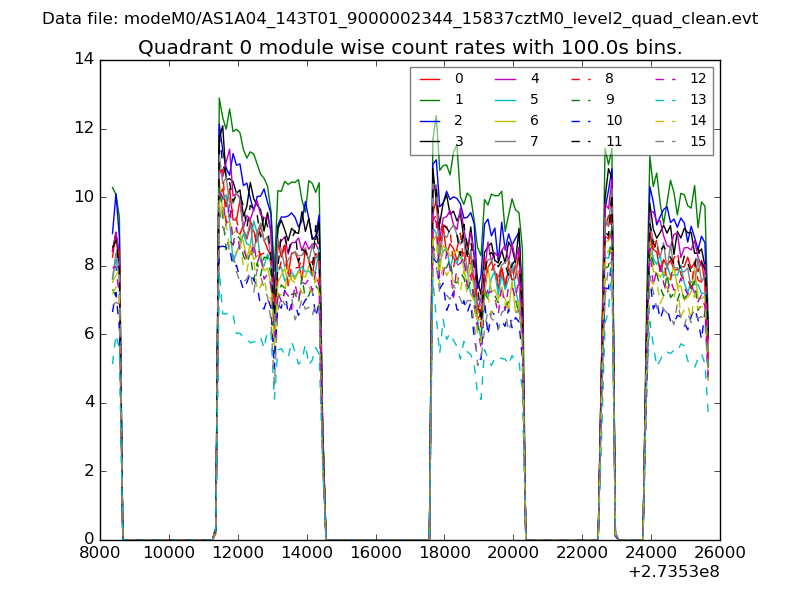 |
 |
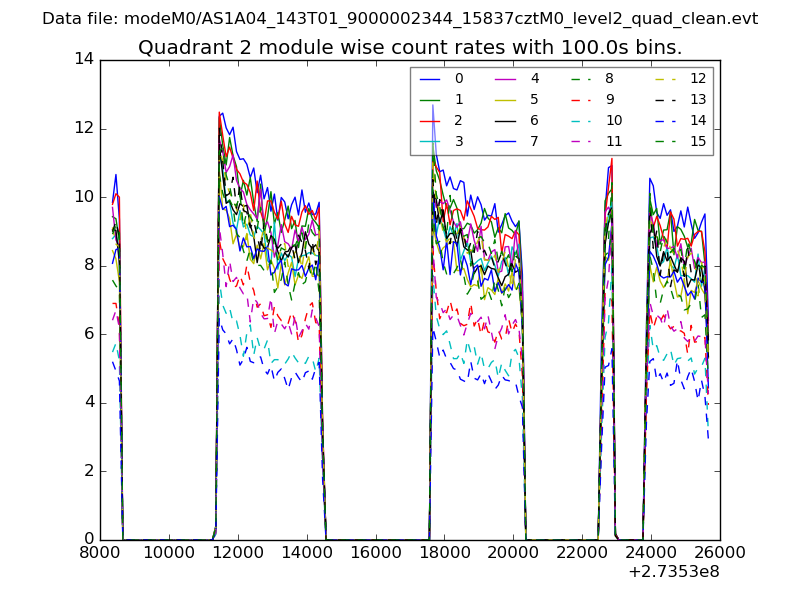
| Module-wise count rates for Quadrant B Data is divided into 100 sec bins |
 |
 |
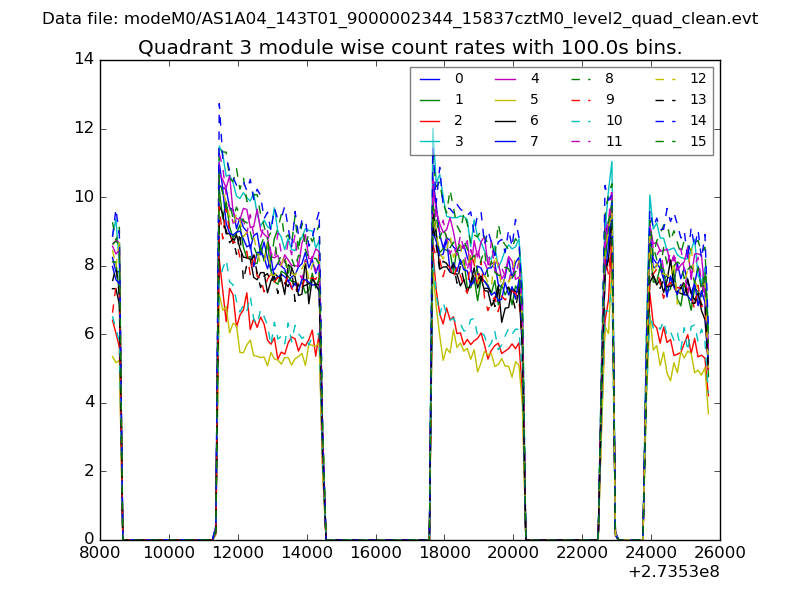
| Module-wise count rates for Quadrant C Data is divided into 100 sec bins |
 |
 |
| Module-wise count rates for Quadrant D Data is divided into 100 sec bins |
 |
 |
| Parameter | Plot |
|---|---|
| CZT HV Monitor |  |
| D_VDD | 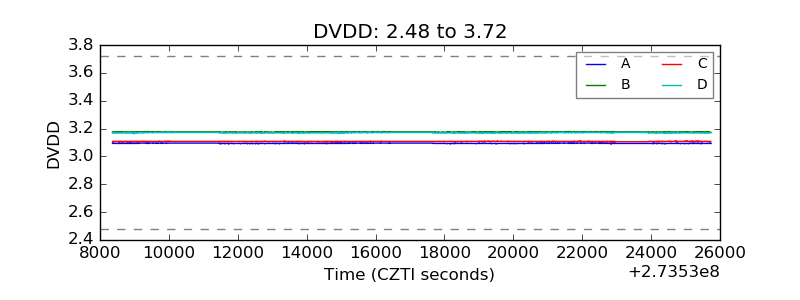 |
| Temperature 1 | 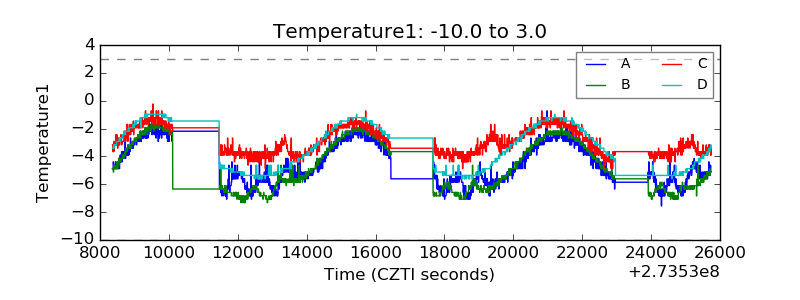 |
| Veto HV Monitor |  |
| Veto LLD |  |
| Alpha Counter | 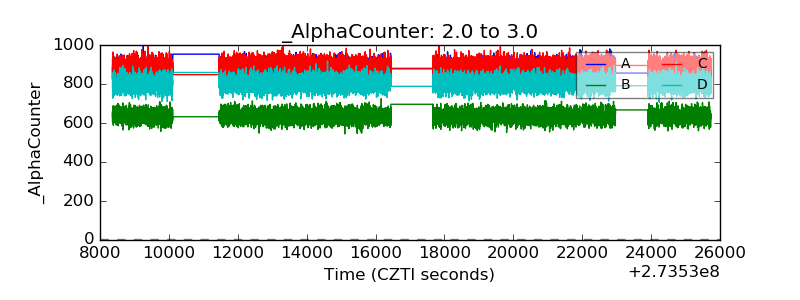 |
| _CPM_Rate | 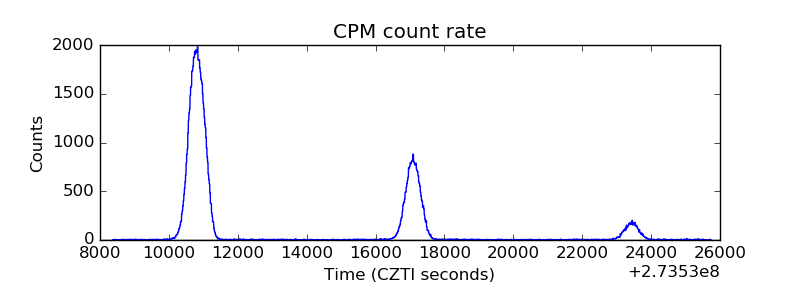 |
| CZT Counter | 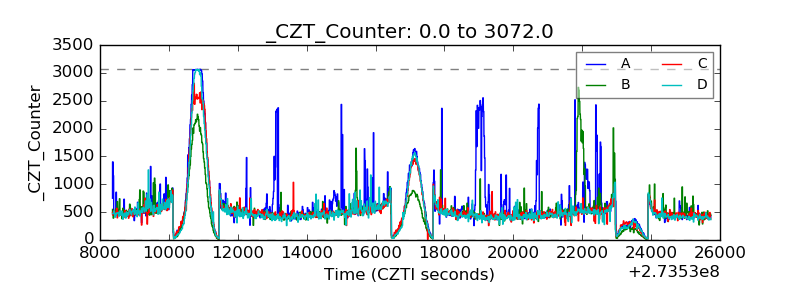 |
| +2.5 Volts monitor |  |
| +5 Volts monitor |  |
| _ROLL_ROT | 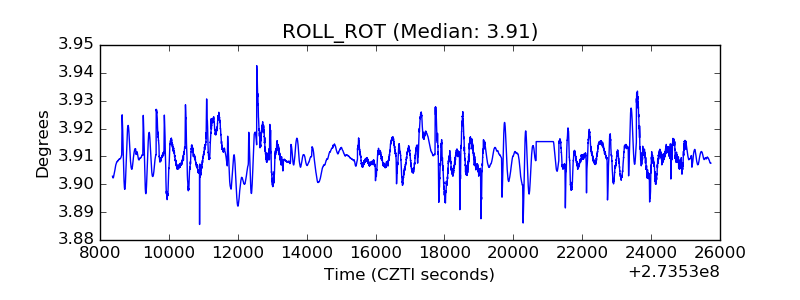 |
| _Roll_DEC | 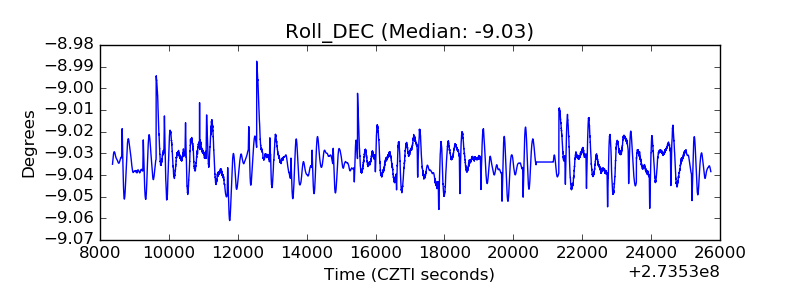 |
| _Roll_RA | 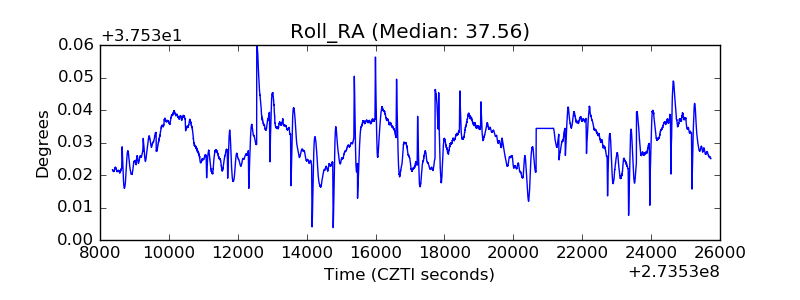 |
| Veto Counter |  |